


1. Introduction
Tidal and marine sources provide opportunities for developing clean and sustainable energy due to their relative abundance and predictable nature (Holzman Reference Holzman2007; Mehmood, Liang & Khan Reference Mehmood, Liang and Khan2012; Angeloudis et al. Reference Angeloudis, Falconer, Bray and Ahmadian2016; Neill et al. Reference Neill2018). Rotary turbines (RTs) offer many advantages that make them the widely accepted energy extraction device today, primarily due to their high efficiency and mature technology base. However, since the vast majority of tidal and fluvial ranges are concentrated at shallow depths and have a time-varying energy density, there are also several disadvantages associated with deployment of RTs to extract hydrokinetic energy (Howland, Lele & Dabiri Reference Howland, Lele and Dabiri2019). They have high maintenance costs, have high ‘cut in’ speeds, perform poorly at off-design conditions (Garrett & Cummins Reference Garrett and Cummins2005), easily clog with marine flora, and can pose a threat to various aquatic life. Furthermore, efficient use of inter-turbine spacing is not always possible in farm-scale RT installations, which can result in reduced individual turbine performance. The overall performance thus shows poor scalability in tidal and fluvial settings, particularly when operated below their rated flow conditions (Abdullah et al. Reference Abdullah, Yatim, Tan and Saidur2012; Draxl et al. Reference Draxl, Clifton, Hodge and McCaa2015; Howland et al. Reference Howland, Lele and Dabiri2019). Owing to many of these limitations, the use of oscillatory energy-harvesting devices has gained interest in the past decades. Simpson et al. (Reference Simpson, Licht, Hover and Triantafyllou2008) experimentally demonstrated that a flapping NACA0012 hydrofoil showed promise to be used for energy harvesting in unsteady and transient environments. Their low blade-tip speed, combined with certain structural advantages, and suitability for installation in shallow waters allowed for a reduced maintenance cost when compared to conventional RTs (Garrett & Cummins Reference Garrett and Cummins2007; Strom, Brunton & Polagye Reference Strom, Brunton and Polagye2017; Su et al. Reference Su, Miller, Mandre and Breuer2019).
During the energy extraction cycle, the flapping hydrofoil experiences points of high instantaneous force (Cleaver et al. Reference Cleaver, Calderon, Wang and Gursul2016; Wu et al. Reference Wu, Zhang, Tian, Li and Lu2020). One of the unsteady flow phenomena contributing to lift generation is the formation and growth of a leading-edge vortex (LEV) – an attached LEV can generate high lift and power coefficients (Chen, Colonius & Taira Reference Chen, Colonius and Taira2010; Lau Reference Lau2010; Onoue et al. Reference Onoue, Song, Strom and Breuer2015). However, once the LEV detaches from the hydrofoil, the instantaneous lift drops significantly. Recent efforts at improving efficiency using hydrofoils of various cross-sections have resulted in only marginal improvements (Kim et al. Reference Kim, Strom, Mandre and Breuer2017). Yet another constraint is that the hydrofoils used in oscillating foil technology for tidal applications need to have a symmetric cross-section (Kim et al. Reference Kim, Strom, Mandre and Breuer2017), which limits the flow turning and lift production capabilities. If one were to design a rigid, cambered hydrofoil for a half-cycle of operation, the performance can be expected to be high. However, the same foil would perform suboptimally in the return stroke of the oscillation cycle. In addition, performing flapping motion requires power input, the degree of which varies depending on whether the flapping motion is active or semipassive or fully passive (Boudreau et al. Reference Boudreau, Dumas, Rahimpour and Oshkai2018; Duarte et al. Reference Duarte, Dellinger, Dellinger, Ghenaim and Terfous2019). These factors lead to a low overall cycle efficiency for flapping foil technologies as compared to conventional RTs.
Movements that combine wing compliance with oscillatory kinematics (pitching and heaving) are widely prevalent in the natural world – in aquatic animals, birds and mammalian flight (Dickinson, Lehmann & Sane Reference Dickinson, Lehmann and Sane1999; Videler, Stamhuis & Povel Reference Videler, Stamhuis and Povel2004; Warrick, Tobalske & Powers Reference Warrick, Tobalske and Powers2005; Dabiri Reference Dabiri2009; Chen, Wang & Gursul Reference Chen, Wang and Gursul2018). Wing deformability has been shown to aid in performance and in the stability of the LEV, as the wing is able to adapt to sudden changes in flow and turbulent gusts (Muijres et al. Reference Muijres, Johansson, Barfield, Wolf, Spedding and Hedenstrom2008; Mountcastle & Combes Reference Mountcastle and Combes2013; Waldman & Breuer Reference Waldman and Breuer2017). However, the use of compliant wings has mostly been limited to propulsive applications. In this work, we employ an oscillating, compliant membrane in the energy extraction mode of operation. The membrane passively adapts its shape in a uniform water flow, and, by tuning the material's elastic properties, we assess the lift-generating capabilities under both steady and oscillatory conditions. We conduct simultaneous measurements of lift and power coefficients for oscillating membranes and compare them to those of an energy-harvesting, rigid hydrofoil. We model the instantaneous deformation of the membrane using a Young–Laplace type equation, which takes into account the deformation-dependent membrane stiffness in response to a fluid flow. We identify the leading mechanisms contributing to the high power extraction capability of compliant membranes. Lastly, we discuss the potential application of flapping membranes in tidal and fluvial energy extraction settings.
2. Experimental methods
The experiments were carried out in a free-surface water channel (flume) that has a test section of  $0.8\ \text {m} \times 0.57\ \text {m}$ in cross-section and 5 m in length. The tests were conducted over a range of flow speeds, $U_{\infty }= 0.1$ m s $^{-1}$ to $0.4$ m s $^{-1}$, which correspond to a Reynolds number, $Re \equiv U_\infty c/\nu$, in the range $1 \times 10^4$ to $4 \times 10^4$. Here, $c$ is the chord length of the membrane foil and $\nu$ is the kinematic viscosity of the fluid. The hydrofoil was actuated in heave and pitch mode, with amplitudes $h_0$ and $\theta _0$, respectively, and oscillation frequency $f$. For the experiments reported in this study, $h_0 = 1.2c$, and $\theta _0$ was varied in the range [ $15^{\circ },35^{\circ }$], and at a reduced frequency, $f^* \equiv {f c/U_{\infty }} = 0.08$. The chord length $c$ = 0.1 m and span $s = 0.4$ m. End plates placed at both ends of the hydrofoil ensured that the deformation profile and the overall flow field over the hydrofoil do not vary significantly in the spanwise direction. The heaving motion, $h(t)$, and the pitching motion, $\theta (t)$, were prescribed to be triangular and trapezoidal, respectively, drawing insights from prior studies (Simpson et al. Reference Simpson, Licht, Hover and Triantafyllou2008; Ashraf et al. Reference Ashraf, Young, Lai and Platzer2011; Lu, Xie & Zhang Reference Lu, Xie and Zhang2014). Larger pitch angles were not tested, as these introduced interactions between the wake of the support structure and the foil, affecting the reliability of the force measurements. The membrane hydrofoils were fabricated in-house by mixing a silicone elastomer compound with a measured percentage of thinner component in order to tune the material's elastic properties (Das, Breuer & Mathai Reference Das, Breuer and Mathai2020a). The results reported here correspond to a membrane of elastic modulus $E \approx 140$ kPa and thickness $t \approx 380 \pm 20\ \mathrm {\mu }$m. A rigid, flat-plate hydrofoil was also tested under identical experimental conditions to allow for direct comparisons with the performance of the membrane hydrofoil.
Figure 1(a) shows a top-view illustration of the oscillating membrane hydrofoil in a uniform flow. A side-view schematic (figure 1b) shows the same foil suspended from a six-axis load cell used to measure the forces and torques during the oscillations. Simultaneously to the load measurements, the membrane's midplane deformations were tracked using a laser profiler across the midspan of the foil (see inset to figure 1b), and the flow field around the membrane was obtained using two-dimensional (2-D) particle image velocimetry (PIV) measurements.

Figure 1. Schematic representations of an oscillating compliant membrane hydrofoil used in hydrokinetic energy extraction. (a) Cross-sectional schematic of the membrane foil deforming during the heaving and pitching oscillations in a uniform water flow. (b) Side-view schematic showing the membrane hydrofoil oscillating in the uniform water flow.
3. Results and discussion
We apply a transformation (Galilean) by subtracting the mean flow speed,  $U_{\infty }$, which yields the foil kinematics in the frame of reference of the uniform stream (see figure 2a). The images presented show the deformed cross-section of the membrane ( $h_0 = 1.2c$, $\theta _0 = 30^\circ$ and $f^* = 0.08$), as obtained from the laser profilometer, at selected instants during the oscillation cycle. Owing to its highly compliant nature, the membrane passively adapts its shape in response to the fluid forces, yielding a positive camber during most of the oscillation cycle. This passive compliance ensures that the deformed membrane shape resembles an asymmetrical foil, which generates more lift and is more resistant to stall, as compared to a rigid hydrofoil (Song et al. Reference Song, Tian, Israeli, Galvao, Bishop, Swartz and Breuer2008).

Figure 2. Deformations and performance of a membrane hydrofoil during a cycle of energy extraction from a uniform water flow. (a) Trajectory of the foil in the frame of reference of the uniform stream. (b) Deformation profiles of the membrane coloured by the instantaneous effective angle of attack,  $\alpha _{eff}$. (c) Predicted centreline deformation ( $w_0/c$) versus measured centreline deformation during the oscillation cycle for pitching amplitude $\theta _0$ varied from 15 $^\circ$ to 35 $^\circ$. (d) Cycle-averaged power coefficient for rigid foil and membrane. Inset shows power ratio, $\mathcal {R}$, which gives the ratio of the average power of the membrane to that of the rigid foil.
A crucial parameter that determines the energy extraction potential during flapping motion is the instantaneous effective angle of attack defined as
 \begin{equation} \alpha_{eff}(t)=\theta(t)-\tan^{{-}1} \left({\frac{\dot{h}(t)}{U_{\infty}}}\right).\end{equation}
As evident from (3.1),  $\alpha _{eff}$ is linked to the instantaneous values of the pitch angle, $\theta (t)$, and the instantaneous heave velocity, $\dot {h}(t)$. A positive power extraction generally occurs at instants where $|\alpha _{eff}| < |\theta |$. The instantaneous deformation profiles for the membrane foil at various instants during a half-cycle of oscillation are shown in figure 2(b). The maximum centreline deflection $w_0/c$ is measured at each instant during the cycle for a variety of pitching and heaving amplitudes. Here, a centreline deflection $w_0 > 0$ indicates a positive camber, which is desirable for energy extraction. The profiles are coloured by $\alpha _{eff}(t)$ at the instant. While the membrane evolves through a complex sequence of shapes, interestingly we note that $w_0$ grows with $\alpha _{{eff}}$.
The deformation profile of the membrane is representative of the balance between hydrodynamic forces and the tension in the membrane. Simplifying to a steady state, the membrane deformation under a pressure loading is governed by the Young–Laplace equation (Waldman & Breuer Reference Waldman and Breuer2017),
 \begin{equation} \kappa+\frac{p}{\mathcal{T}}=0,\end{equation}
where  $\kappa$ is the membrane local curvature, $p$ the pressure and $\mathcal {T}$ the tension in the membrane. This model considers the 2-D projection of a membrane that is pinned between the leading and trailing edges of a wing with a chord length $c$. We can further simplify this under the assumption of a uniform pressure load – the membrane curvature can be expressed in terms of the normalized centreline deflection, $\tilde {w} = w_0/c$ (Das, Mathai & Breuer Reference Das, Mathai and Breuer2020b), i.e. $\tilde {\kappa }= {8\tilde {w}}/({1+4\tilde {w}^{2}})$. The tension in the deformed membrane can be modelled based on the elastomer's constitutive relation. For the range of deformations in the current work, the membrane response can be approximated to be nearly linear elastic, with a Young's modulus $E$. Thus, $\mathcal {T}=Et(\lambda -1)$, where $t$ is the membrane thickness and $\lambda =(2 \lambda _0/\tilde {\kappa }) \sin ^{-1}(\tilde {\kappa }/2)$, with $\lambda _0$ the membrane pre-stretch in the undeformed state.
The above approximations dictate a circular-arc cross-section for the membrane. As we noted in figure 2(b), the membrane deformation profiles during the oscillation cycle are more complex than a circular arc. The effective angle of attack  $\alpha _{eff}$ and the relative velocity $U_{rel}$ vary dynamically during the membrane's motion. Nevertheless, with this simplification the deformed membrane can be modelled as a subfamily of Joukowski airfoils (Waldman & Breuer Reference Waldman and Breuer2017), and we can adapt the inviscid, thin-airfoil theory to model the pressure,
 \begin{equation} p = {\rm \pi}\rho U_\infty^2 \sin(\alpha_{eff}+\tfrac{1}{2}\sin^{{-}1}(\tilde{\kappa}/2)),\end{equation}
where  $\rho$ is the density of the fluid. The above expression takes into account the effective angle of attack and the camber in the membrane (Abbott & Von Doenhoff Reference Abbott and Von Doenhoff2012).
Combining (3.2) and (3.3) and non-dimensionalizing using the length scale,  $c$, the time scale, $c/U_\infty$, and the hydrodynamic pressure scale, $\frac {1}{2}\rho U_{\infty }^2$, we obtain the relation
 \begin{equation} \frac{2{\rm \pi} \sin(\alpha_{eff} + \frac{1}{2}\sin^{{-}1}(\tilde{\kappa}(\tilde{w})/2))}{(\lambda(\tilde{w})-1) \tilde{\kappa}(\tilde{w})} = Ae, \end{equation}
where  $Ae={Et}/({\frac {1}{2}\rho U_{\infty }^2 c})$ is a dimensionless parameter representing the ratio between elastic and aerodynamic stresses (also known as the aeroelastic number). The above relation links the independent variables $Ae$ and $\alpha _{eff}$ through a known function of $\tilde {w}$. We solve the set of equations using an iterative Newton's method to obtain the centre-chord deflection. In figure 2(c), we compare the predictions of (3.4) to the experimental measurements of the centreline deflection for pitching amplitudes varied from 15 $^\circ$ to 35 $^\circ$. The model demonstrates a remarkable agreement with the experimental measurements, despite the simplifying assumptions outlined earlier.
The lift generated during the oscillatory motion can yield useful work only when the lift force acts along the same direction as the heaving velocity,  $\dot {h}$. The resulting power extracted is summarized in the cycle-averaged power coefficient, $C_P = ( \langle F_L \dot {h} \rangle + \langle M \dot {\theta } \rangle )/(\frac {1}{2} \rho U_\infty ^3 c s$), for rigid foils and membranes (figure 2d), where $M$ is the pitching torque. The coefficient $C_P$ increases with pitching amplitude and appears to plateau for large $\theta _0$. The membrane outperforms the rigid hydrofoil and gives a higher power extraction at all $\theta _0$ tested. The inset to figure 2(d) presents the ratio between the power coefficients, $\mathcal {R}$, of the membrane and of the rigid foil. At the lowest $\theta _0 = 15^\circ$, the compliant membrane provides a 160 % improvement in power extraction when compared to the rigid hydrofoil. Even at the highest $\theta _0 = 35^\circ$ (which corresponds to the lowest $\mathcal {R}$), the membrane yields 55 % higher power than the rigid foil.
Next, we focus on the in-cycle variation of the lift coefficient  $C_L(t)$ for varying pitch amplitudes. Since the motion prescribed is symmetric during up- and downstrokes, we present a phase-averaged representative half-cycle of oscillation, from $t/T = 0.25$ to 0.75, where $T = 1/f$ is the period of oscillation (figure 3a,b). This time interval was chosen to be such that $\dot {h} \geq 0$, and therefore we may note that, for all $C_L > 0$ in this interval, we extract positive power. In figure 3(a), the lift coefficient variation for the rigid foil is presented at different values of the pitch angle, $\theta _0$. In general, as $\theta _0$ is increased, $C_L$ also increases (see different colour curves in the figure). The peak value of $C_L$ occurs between $0.25 < t/T < 0.5$. One contribution to the lift comes from $\alpha _{eff}$, which increases and decreases symmetrically during the half-cycle interval plotted. However, soon after this initial increase, the lift drops off rather quickly during the latter part of the half-cycle shown. We evaluate the same for the membrane at different $\theta _0$ (figure 3b). Here, again, and similar to the case of the rigid foil, $C_L$ increases with increasing $\theta _0$. However, unlike the rigid foil, the lift for the membrane does not drop off rapidly during the latter part of the half-cycle.

Figure 3. Comparison of lift coefficient for a rigid plate with that of a membrane during unsteady and static conditions. Time evolution of lift coefficients (phase-averaged) for (a) rigid foil and (b) membrane. In (a,b), the pitch amplitude,  $\theta _0$, is varied from 15 $^\circ$ to 35 $^\circ$. (c) Lift coefficient of the membrane foil for different values of the static angle of attack, $\alpha _s$. Inset shows comparison of $C_L$ versus $\alpha _s$ for the membrane and rigid plate at fixed $Ae = 10$.
The LEV does not play a significant role in controlling the maximum camber, but it has a noticeable effect in determining both the shape of the deformed profile (see figure 2b) and the vortex lift. Note that, while the model simplified the shape to a circular cap (a subfamily of Joukowski airfoils), we can clearly notice that the leading edge is influenced by the LEV that grows and remains attached. Yet, the centreline values of deformation are in fair agreement, which is mainly our experimental finding. As will be discussed in the following comment, this difference in the shape of the profile makes it important for us to account for the vortex lift in order to capture the total force.
While the deformations were fairly well captured by the inviscid model, it is important to note that the model underpredicts the lift measured in the experiments (figure 3a,b). This can be expected, since unsteady effects arising from the membrane/foil kinematics, drag (d'Alembert's paradox) and separated, vortical flows at the leading edge are not included in (3.4). We map out the static lift coefficient,  $C_L = F_L/(\frac {1}{2} \rho U_\infty ^2 c s)$, by performing lift measurements at different $Ae$ (obtained by varying $U_\infty$) at stationary angles of attack, $\alpha _s$ (figure 3c). Here, $F_L$ is the lift force and $s$ is the span of the hydrofoil. The membrane experiences high lift coefficients, reaching a peak lift coefficient of around 3.5 at the lowest $Ae = 5$. It may be noted that the peak $C_L$ we achieve here is higher than the values reported in prior works ( $C_L < 1.8$) using stiffer membranes (Song et al. Reference Song, Tian, Israeli, Galvao, Bishop, Swartz and Breuer2008; Rojratsirikul, Wang & Gursul Reference Rojratsirikul, Wang and Gursul2010). Next, we present $C_L$ versus $\alpha _s$ variation at $Ae \approx 10$ (see inset), which corresponds to the aeroelastic number of the oscillating foil experiments. Firstly, we note that, for the rigid plate, the slope of $C_L$ versus $\alpha _s$ is in good agreement with the $C_L \propto 2 {\rm \pi}\alpha$ based on thin-airfoil theory, and the stall behaviour is comparable to prior measurements (Abbott & Von Doenhoff Reference Abbott and Von Doenhoff2012). In contrast, the membrane displays a higher lift and gentler stall behaviour, with lift slope exceeding $2 {\rm \pi}$ (Song et al. Reference Song, Tian, Israeli, Galvao, Bishop, Swartz and Breuer2008). Moreover, the membrane hydrofoil provides a finite lift even at very small angles of attack, in agreement with prior works (Waldman & Breuer Reference Waldman and Breuer2017). However, the static lift contribution (inset to figure 3c) is lower than the peak lift coefficients measured during the oscillatory motion. Therefore, unsteady vortex dynamics around the foil might play a role in enhancing the lift contribution. These will be analysed in further detail using PIV measurements of the vorticity field surrounding the hydrofoil. The LEV has a noticeable effect in determining both the instantaneous deformed shape of the membrane (see figure 2b) and the vortex lift. Note that, while the model simplified the shape to a circular cap (a subfamily of Joukowski airfoils), it is apparent that the region near the leading edge is influenced by the LEV that grows and remains attached. This aspect, unaccounted for in the model, makes it important for us to consider the vortex lift contribution.
Further to the enhanced lift coefficients for the membrane foil, in figure 3(b), we observe lift fluctuations, particularly prominent during the time interval  $0.25 < t/T < 0.5$. The frequency of these oscillations is nearly unchanged despite the variations in $\theta _0$. In comparison, for the rigid flat plate (figure 3a), the peak in the lift curve is not noticeable at low $\theta _0$ – presumably due to the absence of an LEV at small pitch amplitudes. From the laser profilometer images, we detect that the membrane undergoes shape oscillations at a frequency comparable to its natural frequency (dimensionless) under water, estimated as $\widetilde {f_n} = {\rm \pi}\sqrt {{Ae (\lambda _0- 1)}/(8R_{eff})}$, where $\lambda _0$ is the pre-stretch ratio and $R_{eff} = R + R_a$ is the effective mass ratio, which takes into account the membrane mass ratio $R$ and the added-mass coefficient $R_a = 0.68$ for a vibrating membrane (Minami Reference Minami1998; Tzezana & Breuer Reference Tzezana and Breuer2019). Here, the added-mass coefficient of heaving/pitching was ignored because the heaving and pitching accelerations were small compared to the membrane vibrations. The measured lift force fluctuations for the membrane may therefore be understood as originating from the damped vibrations of the membrane foil in water, which occurs every time the membrane abruptly flips its shape at the end of a pitching cycle. When the foil flips its orientation, the change in the membrane's shape is not an instantaneous reflection of the loads. One can define a Stokes number, using the ratio of the membrane's response time, $\tau _n$, to the foil oscillation time scale, $\tau _{osc}$. The ratio of the response times can be written as ${\tau _n}/{\tau _{osc}} \approx ({0.08}/{{\rm \pi} }) \sqrt {{8 (R+R_a)}/(Ae (\lambda _0- 1))} \approx 0.07$ in our experiments. Hence, this phase lag, although noticeable, is not significant for the current experiments.
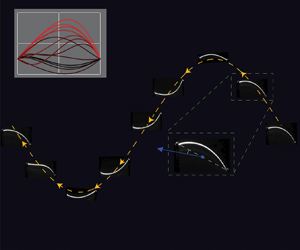
To understand the flow-field evolution around the oscillating hydrofoils, we look into a case with a pitch amplitude  $\theta _0 = 30^\circ$. Figure 4 shows the lift coefficient, $C_L$, variation during the half-cycle of oscillation for a rigid symmetric foil (black curve in upper main panel) and a membrane foil (blue curve in lower main panel). Note that these lift curves were reproduced from figure 3(a,b). As earlier discussed, the peak lift coefficients are higher for the membrane compared to the rigid foil, and we also identified that the force fluctuations for the membrane occur at approximately the natural frequency of the membrane in water. The uppermost and lowermost inset panels of figure 4 show a sequence of instantaneous vorticity fields obtained from PIV measurements around the rigid hydrofoil and the membrane, respectively. These correspond in time to the points marked as (1), (2) and (3) in the lift curves for the rigid foil and the membrane. For the rigid plate, a large LEV structure develops during the instant marked as (1), but the vortex begins to shed by the time instant (2). By (3), the vortex has completely detached. In the $C_L$ versus $t/T$ plot, we observe that the peak lift coincides in time with the development of the LEV, and, soon afterwards, we observe a declining lift curve. The relatively short duration for which the LEV remains attached can explain the declining lift curve for the rigid hydrofoil. In contrast, for the membrane foil, the LEV stays attached for a considerably longer duration, as seen from the vorticity fields (lowermost panels (1)–(3)). Consequently, the lift curve does not decrease sharply as in the case of the rigid plate.

Figure 4. Lift forces and flow structures around a rigid foil (upper panels) and membrane (lower panels) during a half-cycle of oscillation. The inset panels (1)–(3) with black and blue bounding boxes compare the vorticity field around the rigid foil (upper panels) and the membrane (lower panels), respectively. Shaded regions in the two central panels show the total lift prediction based on a semi-empirical model. The blue and red regions in the vorticity fields depict negative and positive vorticity, respectively.
Thus, the attached LEV dynamics, combined with the greater flow turning induced by the membrane's camber, is believed to generate the higher lift performance for the membrane hydrofoils. We can decompose the lift into a steady component and a phase-averaged vortex lift,  $F_L=F_{steady}+F_{vortex}$, where the latter can be linked to the LEV dynamics around the oscillating hydrofoil. The steady lift, $F_{steady}$, was obtained from force measurements on the hydrofoil in a uniform flow and fixed angle-of-attack setting. We follow an approach similar to those by Onoue & Breuer (Reference Onoue and Breuer2016) and Van der Kindere et al. (Reference Van der Kindere, Laskari, Ganapathisubramani and De Kat2019), by making use of the static lift measurements at various $\alpha _s$ and $Ae$ as given in figure 3(c). For the vortex lift, we estimate the LEV circulation as $\varGamma = \iint _s{\boldsymbol {\omega }} \boldsymbol {\cdot } \text {d}\boldsymbol {s}$, where ${\boldsymbol {\omega }}$ represents the vorticity vector and $s$ the surface over the hydrofoil where the LEV is formed. The vortex measurement only accounts for the developing LEV. We do not consider the viscous boundary layer very close to the foil surface because the PIV field is not sufficiently resolved to capture this region very close to the foil surface. The flow field at the lower side of the membrane foil was expected to be nearly potential (irrotational) and did not contribute significantly to the vortex lift. This semi-empirical approach yields a lift variation that is phenomenologically in agreement with the experimental measurements, as shown by the grey and blue shaded regions in the $C_L$ versus $t/T$ plots for the rigid foil and the membrane, respectively. Interestingly, the shape of the $C_L$ versus $t/T$ plot is reproduced fairly well with the inclusion of this vortex lift, since the steady contribution is lower in magnitude and left–right symmetric. These characteristics of compliant membranes may provide key benefits in hydrokinetic energy-harvesting applications.
4. Conclusions
In summary, we have studied the fluid–structure interactions of a compliant membrane hydrofoil undergoing heaving and pitching oscillations in a uniform water stream. Membranes passively camber during the oscillations, which leads to enhanced lift generation and power extraction. Membrane compliance generally aids in the development and stabilization of an LEV over the hydrofoil. We modelled the instantaneous membrane deformation using an inviscid model, which predicts the centreline deformations accurately for a range of pitching amplitudes. The total lift force generated by the oscillating membrane is decomposed into a lumped model that includes a steady lift and a vortex lift contribution. The origin of the high lift performance of membrane hydrofoils lies in the membrane's deflection (camber) and the delayed shedding of the LEV.
The present work has demonstrated that a soft material can be used as an efficient flapping foil energy extraction device. Further, we have revealed the capabilities of the membrane hydrofoils to maintain their performance even at low pitching amplitudes,  $\theta _0$, in regimes where rigid hydrofoils are not efficient. At the highest pitch amplitude tested ( $\theta _0 = 35^\circ$), we report around 55 % power enhancement for the membrane foils. Additionally, during operation, the membrane foils provide a gentler and delayed stall behaviour, and their elastic properties can be adapted for tidal and fluvial settings where seasonal variations can be expected.
Acknowledgements
This work was supported by a grant from the US Army/Natick Soldier Systems Center.
Declaration of interests
The authors report no conflict of interest.


 Open access