


Introduction
The tetrahedrite group includes the most common sulfosalts occurring in hydrothermal ore deposits, where they host different elements owing to the possibility of several homo- and heterovalent substitutions (Moëlo et al., Reference Moëlo, Makovicky, Mozgova, Jambor, Cook, Pring, Paar, Nickel, Graeser, Karup-Møller, Balić-Žunić, Mumme, Vurro, Topa, Bindi, Bente and Shimizu2008; Biagioni et al., Reference Biagioni, George, Cook, Makovicky, Moëlo, Pasero, Sejkora, Stanley, Welch and Bosi2020). This compositional diversity is reflected in the relatively large number of mineral species belonging to this group that have been approved by the Commission on New Minerals, Nomenclature and Classification of the International Mineralogical Association (IMA–CNMNC). In addition to the 11 mineral species redefined in Biagioni et al. (Reference Biagioni, George, Cook, Makovicky, Moëlo, Pasero, Sejkora, Stanley, Welch and Bosi2020), a total of 32 potential end-member compositions has been hypothesised in the tetrahedrite group based on the literature. Since the publication of the tetrahedrite-group nomenclature, 13 new mineral species have been described, emphasising the chemical variability of this isotypic group.
Among the chemical constituents hosted in tetrahedrite-group minerals and representing species-forming elements, the rarest is Te (Z = 52), with an estimated crustal abundance of 5 ng/g (e.g. Wedepohl, Reference Wedepohl1995). Its occurrence in this sulfosalt group has been known since the first description of goldfieldite (Sharwood, Reference Sharwood1907; Ransome, Reference Ransome1909), though only Thompson (Reference Thompson1946) proved it had isotypic relations with tetrahedrite. The actual definition of goldfieldite has been debated by several authors (e.g. Trudu and Knittel, Reference Trudu and Knittel1998, and references therein) and it was finally solved by Biagioni et al. (Reference Biagioni, George, Cook, Makovicky, Moëlo, Pasero, Sejkora, Stanley, Welch and Bosi2020) taking into account the current IMA-CNMNC guidelines and in agreement with the Report of the Sulfosalt Sub-Committee (Moëlo et al., Reference Moëlo, Makovicky, Mozgova, Jambor, Cook, Pring, Paar, Nickel, Graeser, Karup-Møller, Balić-Žunić, Mumme, Vurro, Topa, Bindi, Bente and Shimizu2008). Goldfieldite is defined as the Te-rich member of the tetrahedrite group having end-member formula (Cu4□2)Cu6Te4S13; its type locality is the Mohawk mine, Goldfield, Nevada, USA. In fact, chemical data available for samples from this locality show (As+Sb+Bi)/Te atomic ratios close to 1, with Sb > (As,Bi), i.e. close to the end-member formula Cu12(Sb2Te2)S13 (e.g. Ransome, Reference Ransome1909; Lévy, Reference Lévy1967). For this reason, Shimizu and Stanley (Reference Shimizu and Stanley1991) applied the name goldfieldite to this composition. However, in order to avoid any confusion, the name goldfieldite is currently applied to the Te-pure compositional end-member, whereas a new name should be associated with the Sb/Te and As/Te end-members (Biagioni et al., Reference Biagioni, George, Cook, Makovicky, Moëlo, Pasero, Sejkora, Stanley, Welch and Bosi2020).
During the examination of some specimens classified as goldfieldite from the Mohawk mine, the phase corresponding to the end-member Cu12(Sb2Te2)S13 was found and characterised. The new mineral and its name, stibiogoldfieldite (in agreement with Biagioni et al., Reference Biagioni, George, Cook, Makovicky, Moëlo, Pasero, Sejkora, Stanley, Welch and Bosi2020), have been approved by the IMA–CNMNC (IMA2020-104, Biagioni et al., Reference Biagioni, Sejkora, Musetti, Makovicky, Pagano, Pasero and Dolníček2021). Type material is deposited in the mineralogical collections of the Museo di Storia Naturale of the University di Pisa, Via Roma 79, Calci, Pisa, Italy, under catalogue number 19926 (part of holotype), and of the Department of Mineralogy and Petrology, National Museum, Cirkusová 1740, Prague, Czech Republic, under catalogue numbers P1P 78/2020 (part of holotype) and P1P 80/2020 (cotype). In addition, a sample labelled ‘goldfieldite’ from the Prasolovskoe Au deposit, Kuril Islands, Sakhalin Oblast, Russia, belonging to the private collection of one of the authors (RP – catalogue number 8947) was examined and chemically characterised.
In this paper the description of the new member of the tetrahedrite group stibiogoldfieldite is reported and new crystal chemical data on Te-bearing members of this sulfosalt group are discussed.
Occurrence and physical properties
Stibiogoldfieldite was found at the Mohawk mine (37°43′01″N, 117°13′25″W), Goldfield mining district, Esmeralda County, Nevada, USA. The Goldfield mining district belongs to a series of large epithermal precious metal ore deposits hosted in Oligocene-to-Miocene hydrothermally altered volcanic rocks, in the western part of the Basin and Range province (Ashley, Reference Ashley1974), and structurally controlled by a caldera formed during the early stage of the volcanic activity. Further details can be found in Rockwell (Reference Rockwell2000) and references therein.
Stibiogoldfieldite forms anhedral grains (Fig. 1), up to 0.6 mm in size, dark grey in colour, with grey streak and metallic lustre. Mohs hardness was not measured, owing to the small size of the grain studied, but it should be close to 3½–4, in agreement with other members of the tetrahedrite group. Stibiogoldfieldite is brittle, with a conchoidal fracture and an indistinct cleavage. Due to the small size of the grains studied, density was not measured; on the basis of the empirical formula and the single-crystal X-ray diffraction data, the calculated density is 5.055 g⋅cm–3.

Fig. 1. (a, b) Holotype (sample P1P 78/2020) and (c, d) cotype (sample P1P 80/2020) specimens of stibiogoldfieldite. (a, b) Reflected light images (one polar) of holotype stibiogoldfieldite, as anhedral grains up to 0.6 mm across in quartz. Field of view: 1.2 mm (a) and 0.6 mm (b). (c, d) BSE images showing stibiogoldfieldite [dark grey in (c)], as anhedral grains up to 0.3 mm in quartz gangue; white mineral phases in (c) are distinguished in (d), collected using different image conditions: gold (white), calaverite (grey), and an Ag–Bi–(S,Se) phase (dark grey).
In reflected light, stibiogoldfieldite is isotropic. It is grey, with indistinct brownish shade. Internal reflections were not observed. Reflectance values measured in air on the holotype sample using a spectrophotometer MSP400 Tidas at Leica microscope, with a 50× objective, are given in Table 1 and shown in Fig. 2.

Fig. 2. Reflectance curves for stibiogoldfieldite (1) from the Mohawk mine (holotype sample) measured in air. For comparison, the reflectance curves of stibiogoldfieldite (2) from Goldfield (Criddle and Stanley, Reference Criddle and Stanley1993), and ‘arsenogoldfieldite’ (3) from the Tramway mine (Criddle and Stanley, Reference Criddle and Stanley1993) are shown. Both samples were described as ‘goldfieldite’ by Criddle and Stanley (Reference Criddle and Stanley1993).
Table 1. Reflectance data for holotype stibiogoldfieldite.

The reference wavelengths required by the Commission on Ore Mineralogy (COM) are given in bold.
Stibiogoldfieldite was identified in a quartz sample, in association with pyrite and an Ag–Bi–(S,Se) phase (holotype material – Fig. 1). Another specimen of stibiogoldfieldite was later determined from the same kind of occurrence; in this sample (Fig. 1) it forms anhedral grains, associated with pyrite, calaverite, bismuthinite, bohdanowiczite and the Ag–Bi–(S,Se) phase (cotype material). Some μm-sized domains of the sample studied have As > Sb, thus corresponding to the not yet approved mineral ‘arsenogoldfieldite’. According to Tolman and Ambrose (Reference Tolman and Ambrose1934), the occurrence of stibiogoldfieldite at the Mohawk mine may be related to the circulation of Te-bearing hydrothermal fluids during the late-stage evolution of the Goldfield ore deposits.
The sample labelled as ‘goldfieldite’ from the Prasolovskoe Au deposit was represented by black anhedral grains. Some data about this ore deposit and its tetrahedrite-group minerals can be found in Kovalenker et al. (Reference Kovalenker, Nekrasov, Sandormiskaya, Nekrasova, Malov, Danchenko and Dmitrieva1989), Kovalenker and Plotinskaya (Reference Kovalenker and Plotinskaya2005) and Kemkina (Reference Kemkina2007).
Chemical data
Quantitative chemical analyses were carried out using a Cameca SX 100 electron microprobe (National Museum of Prague, Czech Republic) and the following experimental conditions: wavelength dispersive spectroscopy mode, accelerating voltage 25 kV, beam current 20 nA and beam diameter 1 μm. Standards (element, emission line) were: chalcopyrite (CuKα and SKα), pyrite (FeKα), ZnS (ZnKα), NiAs (AsLβ), Ag metal (AgLα), Sn (SnLα), Sb2S3 (SbLα), PbTe (TeMα), Tl(Br,I) (Tl Lα), PbS (PbMα), Bi2Se3 (BiMβ) and PbSe (SeLβ). The amount of other elements with Z > 8 was below detection limits. Matrix correction by PAP procedure (Pouchou and Pichoir, Reference Pouchou, Pichoir and Armstrong1985) was applied to the data. Results (average of 60 and 181 spot analyses for holotype and cotype samples, respectively) are given in Table 2.
Table 2. Chemical data for stibiogoldfieldite.

‘–’ = below detection; *Ev (%) = [Σ(val+) – Σ(val–)]×100/Σ(val–).
The empirical formula of stibiogoldfieldite from the Mohawk mine, recalculated on the basis of (As+Sb+Bi+Te) = 4 atoms per formula unit (apfu), is (Cu12.05(15)Ag0.04(1)Zn0.03(4)Fe0.01(1))Σ12.13(Sb1.12(8)As0.63(14)Bi0.23(7)Te2.02(17))Σ4.00(S12.99(20)Se0.11(2))Σ13.10 (holotype) and (Cu11.30(22)Ag0.03(1))Σ11.33(Sb0.80(11)As0.57(10)Bi0.06(3)Te2.57(14))Σ4.00(S12.83(29)Se0.20(7))Σ13.03 (cotype). Associated ‘arsenogoldfieldite’, observed in cotype material, has the chemical formula (Cu11.39(33)Ag0.04(1))Σ11.43(As0.93(32)Sb0.56(20)Bi0.04(2)Te2.47(22))Σ4.00 (S12.90(27)Se0.16(4))Σ13.06.
The end-member formula of stibiogoldfieldite is Cu12(Sb2Te2)S13 (Z = 2), corresponding to (in wt.%) Cu 45.44, Sb 14.51, Te 15.21, S 24.84, total 100.00.
Chemical data of the sample from the Prasolovskoe Au deposit and those of ‘arsenogoldfieldite’ observed in the cotype sample, along with all spot analyses performed on holotype and cotype material, are deposited as Supplementary Table S1 (see below).
X-ray crystallography
Single-crystal X-ray diffraction intensity data were collected on the holotype stibiogoldfieldite using a Bruker Smart Breeze diffractometer (50 kV and 30 mA) equipped with a Photon II CCD detector and graphite-monochromatised MoKα radiation (Dipartimento di Scienze della Terra, Università di Pisa, Italy). The detector-to-crystal distance was set at 50 mm. Data were collected using φ scan mode in 0.5° slices, with an exposure time of 10 s per frame, and they were corrected for Lorentz, polarisation, absorption and background effects using the software package Apex3 (Bruker AXS Inc., 2016). The refined unit-cell parameters are a = 10.3466(17) Å, V = 1107.6(5) Å3; and space group I $\overline 4$ 3m. The crystal structure of stibiogoldfieldite was refined using Shelxl–2018 (Sheldrick, Reference Sheldrick2015) starting from the structural model of Johnson and Burnham (Reference Johnson and Burnham1985). The following neutral scattering curves, taken from the International Tables for Crystallography (Wilson, Reference Wilson1992), were used: Cu vs. □ at the M(2) and M(1) sites, Te vs. As at X(3), and S at S(1) and S(2) sites. After several cycles of isotropic refinement, the agreement factor R 1 converged to 0.0755, confirming the correctness of the structural model. The occurrence of racemic twinning was taken into account and the absolute structure needed to be inverted. The M(2) and M(1) sites were found to be fully occupied by Cu, and thus their site occupancy factors (s.o.f.) were fixed to 1. The anisotropic structural model for all atoms converged to R 1 = 0.0316 for 285 unique reflections with F o > 4σ(F o) (0.0485 for all the 331 measured unique reflections) and 20 refined parameters. Table 3 gives details of data collection and refinement.
Table 3. Summary of crystal data and parameters describing data collection and refinement for stibiogoldfieldite.

1 w = 1/[σ2(F o2)+18.1789P], where P = (F o2+2F c2)/3
2 Flack (Reference Flack1983)
Powder X-ray diffraction (PXRD) data of holotype stibiogoldfieldite were collected using a 114.6 mm Gandolfi camera and Ni-filtered CuKα radiation (Dipartimento di Scienze della Terra, Università di Pisa, Italy) owing to the paucity of material. Unit-cell parameters were refined on the basis of 18 unequivocally indexed reflections using UnitCell (Holland and Redfern, Reference Holland and Redfern1997) and are a = 10.3664(5) Å and V = 1113.98(17) Å3. The cotype sample was analysed at room temperature using a Bruker D8 Advance diffractometer equipped with a solid-state LynxEye detector and secondary monochromator producing CuKα radiation at the Department of Mineralogy and Petrology, National Museum, Prague, Czech Republic. The instrument was operating at 40 kV and 40 mA. In order to minimise the background, the powder sample was placed on the surface of a flat Si wafer. The PXRD pattern was collected in Bragg–Brentano geometry in the 2θ range 3–70°, with step of 0.01° and counting time of 20 s per step (total duration of the experiment was ca. 30 h). The positions and intensities of diffraction effects were found and refined using the Pearson VII profile-shape function of the ZDS program package (Ondruš, Reference Ondruš1993). Unit-cell parameters were refined by the least-square program of Burnham (Reference Burnham1962) and are a = 10.3035(2) Å and V = 1093.83(7) Å3. Table 4 reports the observed and calculated PXRD patterns.
Table 4. Powder X-ray diffraction data for holotype and cotype samples of stibiogoldfieldite.*
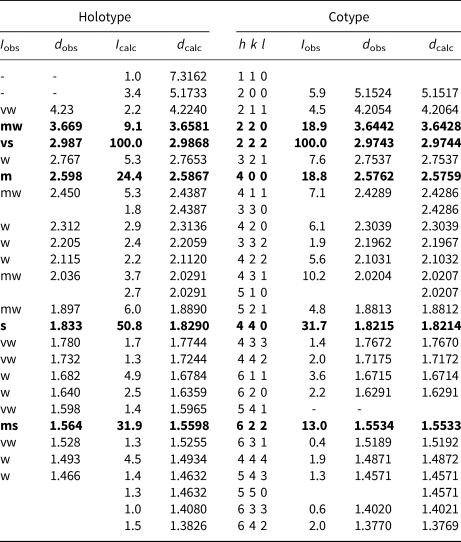
* Intensity and d hkl were calculated using the software PowderCell2.4 (Kraus and Nolze, Reference Kraus and Nolze1996) on the basis of the structural model given in Table 5. Only reflections with I calc > 1 are listed. The five strongest reflections are given in bold. For the holotype sample, I obs were visually estimated. vs. = very strong; s = strong; ms = medium-strong; m = medium; mw = medium–weak; w = weak; and vw = very weak.
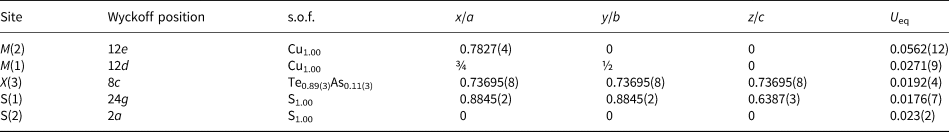
Table 5. Sites, Wyckoff positions, site occupancy factors (s.o.f.), fractional atom coordinates and equivalent isotropic displacement parameters (Å2) for stibiogoldfieldite.
Results and discussions
Crystal structure description
Fractional atomic coordinates and equivalent isotropic displacement parameters for stibiogoldfieldite are reported in Table 5, and selected bond distances in Table 6. The bond-valence sums (BVS) are given in Table 7 and were obtained using the bond-valence parameters of Brese and O'Keeffe (Reference Brese and O'Keeffe1991), assuming the simplified structural formula discussed below and neglecting minor Se. The crystallographic information files have been deposited with the Principal Editor of Mineralogical Magazine and are available as Supplementary material (see below).
Table 6. Selected bond distances (Å) for stibiogoldfieldite.

Table 7. Weighted bond-valence sums (in valence units) for stibiogoldfieldite*.

* Left and right superscripts indicate the number of equivalent bonds (when > 1) involving cations and anions, respectively. The following site occupancieswere used: M(2) = Cu0.993Ag0.007; M(1) = Cu0.993Zn0.005Fe0.002; X(3) = Sb0.28As0.16Bi0.06Te0.50.
Stibiogoldfieldite has isotypic relations with the other members of the tetrahedrite group; its crystal structure can be described as a collapsed sodalite-like framework of corner-sharing M(1)-centred tetrahedra with S(2)-centred M(2)-octahedra and X(3)S(1)3 trigonal pyramids hosted within structural cages (e.g. Johnson et al., Reference Johnson, Craig and Rimstidt1988).
The M(2) site is three-fold coordinated and has a pure Cu occupancy, with only a negligible Ag content (0.04 apfu). Its average bond distance is 2.251 Å. Such a value can be compared with those shown by pure Cu M(2) sites in tetrahedrite (2.259 Å – Wuensch, Reference Wuensch1964) and tennantite (2.240 Å – Wuensch et al., Reference Wuensch, Takéuchi and Nowacki1966). The relatively large U eq value (0.056 Å2) is probably related to the positional disorder usually associated to the M(2) site (e.g. Andreasen et al., Reference Andreasen, Makovicky, Lebech and Karup-Møller2008; Welch et al., Reference Welch, Stanley, Spratt and Mills2018). Such a disorder was not resolved in the refinement of the crystal structure of stibiogoldfieldite. The BVS at the M(2) site (Table 7) is 1.05 valence units (vu), in agreement with the presence of monovalent cations. Its site population, based on electron microprobe and structural data, is proposed as M (2)(Cu5.96Ag0.04), i.e. almost a pure Cu site.
The tetrahedrally coordinated M(1) site is a pure Cu site, with only minor amounts of Zn and Fe, i.e. M (1)(Cu5.96Zn0.03Fe0.01). The average bond distance is 2.329 Å, to be compared with those observed in other Cu-centred tetrahedrally coordinated sites, i.e. in chalcopyrite-like minerals (2.302–2.33 Å; Hall, Reference Hall1975). The BVS is 1.12 vu, agreeing with the dominance of Cu+ at this structural site.
The X(3) site has an average bond distance of 2.390 Å. Taking into account the electron microprobe data, the site occupancy (Sb0.28As0.16Bi0.06Te0.50) can be proposed, which corresponds to a calculated mean atomic number (MAN) of 50.54 electrons, to be compared with the observed MAN of 49.98 electrons. Assuming idealised X–S distances of 2.26, 2.55, 2.45 and 2.34 Å for As3+, Bi3+, Sb3+ and Te4+, respectively (calculated according to the bond parameters of Brese and O'Keeffe, Reference Brese and O'Keeffe1991), an average X(3)–S(1) distance of 2.37 Å can be expected. The BVS is 3.39 vu, to be compared with a theoretical value of 3.50 vu.
The S(1) site is four-fold coordinated and is bonded to two M(1), one M(2) and one X(3). Its BVS is 2.04 vu. S(2) is octahedrally coordinated by atoms hosted at M(2) sites, with BVS of 2.10 vu. Both S sites are fully occupied.
Coupling the results of the crystal structure refinement and the electron microprobe analysis, the structural formula of holotype stibiogoldfieldite can be written as M (2)(Cu5.96Ag0.04)M (1)Cu6X (3)(Sb0.28As0.16Bi0.06Te0.50)4S13.
Crystal-chemistry of stibiogoldfieldite
Tellurium-bearing tetrahedrite-group minerals display several crystal-chemical features that were deciphered towards the end of the 1960s. Kato and Sakurai (Reference Kato and Sakurai1970) and Kalbskopf (Reference Kalbskopf1974) realised that Te does not substitute for S (as initially hypothesised) but behaves like As and Sb, as proposed by Lévy (Reference Lévy1967). This agrees with our results, showing a full S occupancy at the S(1) and S(2) sites of stibiogoldfieldite and a site scattering at the X(3) site in accord with a mixed (Sb,Te,As,Bi) occupancy.
Kalbskopf (Reference Kalbskopf1974) also reported the occurrence of vacancies at the trigonally-coordinated M(2) sites in Te-rich tetrahedrite-group minerals. Similar results were then obtained by Dmitrieva et al. (Reference Dmitrieva, Yefremov and Kovalenker1987) and Pohl et al. (Reference Pohl, Ließmann and Okrugin1996). At the end of the 1970s and during the 1980s, several authors (e.g. Novgorodova et al., Reference Novgorodova, Tsepin and Dmitrieyeva1978; Kase, Reference Kase1986; Knittel, Reference Knittel1989) proposed that the accommodation of Te4+ (up to 2 Te apfu) in the crystal structure of tetrahedrite-group minerals is possible through an increase of the (Cu,Ag)+ content from 10 to 12 apfu, according to the substitution (i) M (1)Me2+ + X (3)(Sb/As)3+ = M (1)Cu+ + X (3)Te4+, where Me = Fe, Zn, Hg, etc. For Te contents between 2 and 4 apfu, the charge balance is maintained through the creation of vacancies at the M(2) site, according to the substitution mechanism (ii) M (2)Cu+ + X (3)(Sb/As)3+ = M (2)□ + X (3)Te4+ (e.g. Shimizu and Stanley, Reference Shimizu and Stanley1991). Summarising, the general chemical formula can be written as Cu10+xMe2–x[(Sb/As)4–xTex)S13 for 0 ≤ Te ≤ 2 apfu and (Cu12–y□y)[Te2+y(Sb/As)2–y]S13 for 2 < Te ≤ 4 apfu. Data collected on the specimens from the Mohawk mine and the Prasolovskoe Au deposit agree with these substitution mechanisms. The relationship between formally monovalent cations (Cu + Ag) and Te is shown in Fig. 3a. There is a positive relationship up to ~2 Te apfu and 12 (Cu + Ag) apfu. Then, a negative correlation between the Te and (Cu + Ag) can be observed. This is probably related to the transition from substitution (i) to (ii). This hypothesis is supported by Fig. 3b. Indeed, the content of (Zn + Fe + Cd + …), i.e. formally divalent cations (Fe could also occurs as ferric iron when occurring in low amounts – e.g. Makovicky and Karup-Møller, Reference Makovicky and Karup-Møller2017), decreases up to 2 Te apfu, when the sum of transition metals approaches zero. In the samples studied, the content of Te then increases up to ~3 apfu.

Fig. 3. Relationships between (a) Te vs. (Cu + Ag) and (b) Te vs. (Zn + Fe + Cd) in apfu in stibiogoldfieldite. Symbols: violet triangles = holotype specimen; grey squares = cotype specimen; orange circles = Prasolovskoe Au deposit. The red star indicates the position of the ideal stibiogoldfieldite, i.e. (Cu + Ag) = 12 apfu and Te = 2 apfu.
Taking the general formula discussed above, the holotype material has x = 2, corresponding ideally to Cu12[(Sb/As)2Te2]S13. Indeed, the amount of Zn and Fe is very low, close to the detection limit, i.e. 0.03(4) and 0.01(1), respectively, and the sum of the formally monovalent cations Cu and Ag is close to 12 apfu. Trivalent cations are represented by Sb (1.12 apfu), As (0.63 apfu) and minor Bi (0.22 apfu).
The chemical formula of cotype material has Te > 2 apfu, with y ≈ 0.6, ideally (Cu11.4□0.6)[Te2.6(Sb/As)1.4]S13. This agrees with the empirical formula, showing (Cu+Ag) = 11.33 apfu, with no formally divalent metals. Among trivalent cations, Sb is dominant over As (0.80 vs. 0.57 apfu), whereas the content of Bi (0.06 apfu) is negligible.
The composition of the sample from the Prasolovskoe Au deposit is more variable, ranging from tetrahedrite-(Zn), with As/(As+Sb) and Te/(As+Sb+Te) atomic ratios in the ranges 0.27–0.44 and 0.02–0.23, respectively, and stibiogoldfieldite, with the same ratios in the ranges 0.24–0.39 and 0.26–0.47. The wide compositional variability of tetrahedrite-group minerals from this Russian locality has been reported previously by Kemkina (Reference Kemkina2007).
Miscibility gap along the stibiogoldfieldite–goldfieldite join
Makovicky and Karup-Møller (Reference Makovicky and Karup-Møller2017) pointed out that along the join between synthetic Cu12(Sb2Te2)S13 and Cu10Te4S13 a possible miscibility gap may occur between 3.5 and 2.1 Te apfu. Indeed, a charge with composition Cu10.62(Sb0.59Te3.44)S12.94 gave two unit-cells, i.e. a = 10.279 and 10.330 Å. The same was observed for the charge compositions Cu11.37(Sb1.36Te2.65)S12.97 and Cu11.54(Sb1.51Te2.52)S12.93, whereas only one unit-cell was refined for the compositions Cu11.46(Sb1.58Te2.53)S12.96 and Cu11.93(Sb2.03Te2.00)S13.02. This was interpreted as due to the exsolution between Te-poor and Te-rich phases; such exsolutions were not observed in reflected light, suggesting the intimate nature of these intergrowths (Makovicky and Karup-Møller, Reference Makovicky and Karup-Møller2017).
The refined unit-cell parameter of the holotype material, having the simplified composition Cu12(Sb1.1As0.7Bi0.2Te2.0)S13, is a = 10.347 Å, close to that given by Makovicky and Karup-Møller (Reference Makovicky and Karup-Møller2017) for Fe-free and Te-rich tetrahedrite, i.e. a = 10.352 Å. It is likely that the replacement of Sb by As, favouring a contraction of the unit-cell parameter, is balanced by the occurrence of Bi, leading to an expansion of the unit-cell size. Indeed, the chemical composition of the holotype sample should be out of range of the hypothetical miscibility gap.
On the contrary, the cotype sample, ideally (Cu11.4□0.6)(Te2.6Sb0.8As0.6)S13, is within the presumed miscibility gap, its chemistry closely corresponding to the charge with composition Cu11.37(Sb1.36Te2.65)S12.97. This charge gave two unit-cell parameters, a = 10.286 and 10.344 Å. However, no exsolution phenomena nor intergrowths were observed on BSE images or in reflected light; moreover, PXRD patterns show no evidence for the occurrence of two tetrahedrite-like phases and only one unit-cell parameter, a = 10.304 Å, was refined. This discrepancy between synthetic and natural samples may be due to the occurrence of As replacing Sb, in agreement with Makovicky and Karup-Møller (Reference Makovicky and Karup-Møller2017).
The chemical variability of the samples as a function of the cations occurring in X(3), along with selected literature data is shown in Fig. 4. Since minor Bi was considered along with Sb (Sb* = Sb + Bi), some chemical data having As slightly dominant over Sb can be displaced towards the Sb field, due to the presence of some Bi. In particular, this occurs for some of the data for ‘arsenogoldfieldite’ associated with cotype stibiogoldfieldite. In the stibiogoldfieldite compositional field, available chemical data are always characterised by the coexistence of Sb and As, whereas As-free or very As-poor compositions are not reported and could suggest the existence of a natural miscibility gap. On the contrary, in the compositional field of the not yet approved mineral species ‘arsenogoldfieldite’, compositions very poor in Sb have been reported; for instance, in the ‘arsenogoldfieldite’ observed in the cotype material in this work, Sb contents down to 0.06 apfu were measured. This could be related to the large misfit between pure stibiogoldfieldite and goldfieldite; such a misfit can be reduced through the partial replacement of Sb by As.

Fig. 4. Compositional variation of Te-bearing tetrahedrite-group minerals. For the samples studied in this work, the same symbols as in Fig. 3 are used. Selected chemical data from literature are shown. Symbols: red square = ‘arsenogoldfieldite’ associated with cotype stibiogoldfieldite; light blue circles = Ozernovskoe deposit, Kamchatka, Russia (Spiridonov et al., Reference Spiridonov, Ivanova and Yapaskurt2014); red circles = Goldfield, USA (Lévy, Reference Lévy1967 – also indicated by the red arrow); green squares = Marian Au mine, Philippines (Knittel, Reference Knittel1989); dark blue triangles = Sazare deposit, Japan (Kase, Reference Kase1986); dark green square = Kawazu mine, Japan (Shimizu and Stanley, Reference Shimizu and Stanley1991); light blue squares = Rhodope area, southern Bulgaria – northern Greece (Repstock et al., Reference Repstock, Voudouris, Zeug, Melfos, Zhai, Li, Kartal and Matuszczak2016); yellow squares = Iriki mine, Japan (Shimizu and Stanley, Reference Shimizu and Stanley1991); red triangles = Ikadazu deposit, Japan (Kase, Reference Kase1986). The light grey area indicates the possible miscibility gap. Sb* = Sb + Bi. Me = formally divalent metals (e.g. Cu, Fe, Hg, Zn, …).
Conclusions
The investigation of Te-bearing members of the tetrahedrite group, following Biagioni et al. (Reference Biagioni, George, Cook, Makovicky, Moëlo, Pasero, Sejkora, Stanley, Welch and Bosi2020), allowed the description of stibiogoldfieldite. Its formal approval by the IMA–CNMNC improves the classification of tetrahedrite-group minerals; moreover, the crystal-chemical investigations agree with previous investigations and hypotheses about the role of Te in these sulfosalts, as well as the mechanisms favouring its incorporation in their crystal structures (e.g. Makovicky and Karup-Møller, Reference Makovicky and Karup-Møller2017).
Holotype stibiogoldfieldite corresponds to ‘goldfieldite’ originally described by Ransome (Reference Ransome1909); consequently, although goldfieldite is still a valid mineral species, a study on natural specimens is mandatory, coupled with a definition of neotype material. As some occurrences of goldfieldite, with up to 3.77 Te apfu are known, their crystal-chemical study should be performed, refining our knowledge on this important sulfosalt group.
Acknowledgements
CB and MP acknowledge financial support from the Ministero dell'Istruzione, dell'Università e della Ricerca through the project PRIN 2017 “TEOREM – deciphering geological processes using Terrestrial and Extraterrestrial ORE Minerals”, prot. 2017AK8C32. The study was also financially supported by the Ministry of Culture of the Czech Republic (long-term project DKRVO 2019–2023/1.II.c-d; National Museum, 00023272) for JS and ZD. The comments of Peter Leverett, Yves Moëlo, and an anonymous reviewer improved the original manuscript.
Supplementary material
To view supplementary material for this article, please visit https://doi.org/10.1180/mgm.2021.107


 Open access