


1. Introduction
The Nebraska Legislature in 2003 enacted legislation, known as LB 754, with the intent “to seek reasonable means to nurture and support the livestock sector of the state” (LB 754, 2003). To that end, the legislature directed the Nebraska Department of Agriculture (NDA) to develop a Livestock Friendly County (LFC) program to “recognize and assist efforts of counties to maintain or expand their livestock sector” (LB 754, 2003). As per Nebraska Administrative Code 2004, which contains the LFC regulations, “LIVESTOCK FRIENDLY COUNTY means any county designated by the Director as a “Livestock Friendly County” under the Act after fulfilling all of the requirements and meeting the criteria and standards established by the department under the Act and these regulations” (NDA, 2004).
Once designated, a county may use the words LFC and the NDA logo for promotional purposes (NDA, 2004). As further elaborated on NDA’s website, “The LFC sign at the county entrance tells visitors that the county is committed to the people, the businesses, the environment, and the livestock industry. The designation is a strong statement of support of animal agriculture.”Footnote 1 Designated counties are reviewed annually by the NDA Director to determine if they continue to qualify for the designation. Counties may also choose to withdraw from the LFC program.
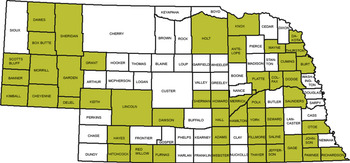
Between 2003 and 2018, 49 of the state’s 93 counties received the LFC designation (Table 1 and Figure 1). In 2005, Morrill was the first and the only county to be designated LFC. In 2018, six counties (Red Willow, Platte, Furnas, Polk, Seward, and Sherman) were designated. The other 42 counties received the designation at staggered years during the 15-year interval.
Table 1. Nebraska designated livestock-friendly counties by date of designation

Source: J. David Aiken, Professor at the Department of Agricultural Economics, University of Nebraska-Lincoln.

Figure 1. Counties with Nebraska livestock friendly designation.
Source: Nebraska Department of Agriculture.
In the only study investigating the impact of the program on the state’s livestock sector, Mills et al. (Reference Mills, Azzam, Brooks and Aiken2016) examine whether counties with the LFC designation experienced a higher expansion in the number of cattle and hog farms. Using 2002, 2007, and 2012 census data, the authors regressed the number of farms on several county-specific control variables and an indicator variable representing LFC designation of counties. The statistical significance of the LFC indicator variable coefficient in their regression model led to the conclusion that the program has resulted in higher livestock expansion by inducing more net entry of livestock farms.Footnote 2
A key limitation of Mills et al.’s study stemmed from their use of census data where farm numbers are available only every 5 years. Consequently, not only does the periodicity of the census data make it difficult to match the census years with the years when counties were designated LFC, but it also makes it impossible to account for the staggered entry of counties into the LFC program, as clearly shown in Table 1.
In this paper, we re-examine the impact of the LFC designation on the Nebraska cattle industry and, in so doing, we mitigate the limitations of Mills et al.’s (Reference Mills, Azzam, Brooks and Aiken2016) study and contribute to the literature on the economic impact of geographical designations by being the first to implement a model in a setting where units (e.g., cities, counties, states, or countries) are designated at different points in time. To that end, we use a difference-in-difference (DID) with staggered treatments for a data panel with yearly outcome variables, mitigating the mismatch between the data periods and the year during which a county was LFC designated. Four county-level outcome variables for the cattle industry are usedFootnote 3: cattle numbers (all cattle and calves in Nebraska as of January 1), cattle density (cattle numbers per square mile), cattle share (cattle numbers as a proportion of the state’s cattle numbers), and cattle per capita (cattle numbers per county resident). The four outcome variables are indicators of various dimensions of cattle industry expansion/contraction. While changes in cattle numbers, in general, indicate changes in the extensive margin of the cattle industry, changes in cattle density are indicators of the intensive margin only. Cattle share captures both the importance of a county’s dominance and efficiency in cattle production relative to other counties. Cattle per capita proxies how receptive residents are to cattle production in their respective counties.
In addition to accounting for staggered treatment, the model accounts for self-selection bias by including not only the time-varying observable variables that contribute to LFC designation but also other county-specific fixed characteristics that may contribute to livestock expansion/contraction (e.g., physical characteristics such as topography and climatic condition or socio-economic and cultural characteristics such as demography, infrastructure, etc.).
The next section briefly describes the LFC designation process. The third section reviews literature related to designations. The econometric model is described in section 4. Sections 5 and 6 present the data and the results, respectively. The final section summarizes and concludes.
2. The LFC Designation Process
To be considered for LFC designation, a county must first apply and submit certain information and documents as set forth in section 008, “The Application Process,” of the Code.
Broadly speaking, the application is partitioned into three sections. The first section is largely declaratory. The applicant expresses commitment to livestock development, acknowledges the importance of the sector to its economy, and commits to compliance with the Livestock Waste Management Act. The second section requires documentation of “zoning regulations applicable to animal feeding operations (AFOs)” at the county level. The third section asks for the same “if any city, village, or other governmental jurisdictions with the county imposes restrictions on AFOs” (NDA, 2004).
To determine if a county qualifies for LFC status, the NDA Director compares the examples listed under each of the criteria in the Code with “activities undertaken in the county or regulation imposed by the county.” There are six criteria, with several detailed examples under each criterion (NDA, 2004). The six criteria are: (1) the county’s expressed commitment to developing the livestock sector of its economy, supported by specific programs to that effect; (2) the restrictions on AFOs by other governmental jurisdictions within the county are within what is permissible by Nebraska statutes unless the restrictions are supported by science-based analysis specific to the jurisdiction; (3) nonfarm land uses do not infringe on animal agriculture in predominately agricultural areas; (4) the procedures for obtaining a livestock permit are clear, and the requirements for obtaining a permit are clear, reasonable, and science-based; (5) the design and site requirements for AFOs are not more restrictive than the requirements under existing state standards; and (6) and setbacks are not >0.25 mile for 1,000 animal units (AUs), 0.375 miles for 5,000 AUs, 0.50 mile for 10,000 AUs, and 0.75 miles for 20,000 AUs. The LFC applications are evaluated by an evaluation committee consisting of representatives from the NDA, the Nebraska Department of Economic Development, the Nebraska Department of Environmental Quality, other state and county government agencies, academic institutions, and others as determined by the NDA Director (NDA, 2004).
3. Related Literature
Since Mills et al.’s (Reference Mills, Azzam, Brooks and Aiken2016) study of the Nebraska LFC designation is the only direct precursor to ours, this section’s purpose is necessarily limited to how our contribution fits within the broader literature that examines local impacts of localized policies. The literature has two strands. The first strand examines the economic impacts of a variety of designations. Perhaps, the designation most familiar to agricultural economists is the protected designation of origin of food products and its effect on consumer willingness to pay for products (e.g., Garavaglia and Mariani, Reference Garavaglia and Mariani2017).
Non-food-related designations in the literature include designations such as floodplain (Meldrum, Reference Meldrum2016), conservation area (Ahlfeldt et al., Reference Ahlfeldt, Moeller, Waights and Wendland2017), historic district (Angjellari-Dajci and Cebula, Reference Angjellari-Dajci and Cebula2016), arts and cultural district (Rich and Tsitsos, Reference Rich and Tsitsos2016), ozone non-attainment (Sheriff, Ferris, and Shadbegian, Reference Sheriff, Ferris and Shadbegian2019), and enterprise zone designation (Zhang, Reference Zhang2015). The studies investigate the impacts of designations on a variety of outcome variables such as real estate value, employment, and income. For example, Angiellani-Dajci and Cebula (Reference Angjellari-Dajci and Cebula2016) investigate the impact of national historic district designation on the sales price of residential properties in St. Augustine, Florida, and conclude that the property sales prices are positively affected by various historical designations. Rich and Tsitsos (Reference Rich and Tsitsos2016) conduct a case study of Station North Arts and Entertainment District in Baltimore, Maryland, and conclude that home values have increased in Station North since the Art and Entertainment District designation. Zhang (Reference Zhang2015) studies the impact of the Louisville Enterprise Zone program on the growth of different industries and concludes that the enterprise zone program has significantly increased the growth of service and manufacturing activities in Louisville.
The second strand of literature examines the effect of a business-friendly policy environment on indicators of economic outcomes. Examples include how state-level policies concerning taxes (Bartik, Reference Bartik1989), environmental regulation (Azzam, Nene, and Schoengold, Reference Azzam, Nene and Schoengold2015), anti-corporate farming (Schroeter, Azzam, and Aiken, Reference Schroeter, Azzam and Aiken2006), and antitrust enforcement (Feinberg, Reference Feinberg2014) influence firm location, entry, and exit. For example, Azzam, Nene, and Schoengold (Reference Azzam, Nene and Schoengold2015) study the impact of environmental regulation stringency on U.S. hog industry and conclude that the regulation has a limited impact on small-scale hog farms and leads to a reduction in the number of large farms. Schroeter, Azzam, and Aiken (Reference Schroeter, Azzam and Aiken2006) examine the impact of an anti-corporate farming law, Initiative 300, on the feedlot industry structure in Nebraska and conclude that there is no strong evidence that Initiative 300 affected the dynamics of feedlot industry structure in Nebraska. Some studies examine the effect of business-friendly policies on economic indicators such as poverty (Djankov, Georgieva, and Ramalho, Reference Djankov, Georgieva and Ramalho2018) and economic growth (Gillanders and Karl, Reference Gillanders and Whelan2014) across countries.
4. Econometric Model
The model we use is an extension of the basic DID with simultaneous treatment to a DID with a staggered treatment (de Janvry and Sadoulet, Reference de Janvry and Sadoulet2016). In terms of our application, the idea behind the basic DID is to estimate the net difference in the outcome variable in a county attributed to LFC designation by subtracting the outcome of non-LFC-designated counties (control group) from the outcome of LFC-designated counties (treatment group) over the same period.
Let ${\bar Y_{T0}}$
and
${\bar Y_{T0}}$
and ${\bar Y_{T1}}$
denote the average of an outcome variable before and after LFC designation for the treatment group, and
${\bar Y_{T1}}$
denote the average of an outcome variable before and after LFC designation for the treatment group, and ${\bar Y_{C0}}$
and
${\bar Y_{C0}}$
and ${\bar Y_{C1}}$
for the control group. Then, the average treatment effect of LFC designation ATE = (
${\bar Y_{C1}}$
for the control group. Then, the average treatment effect of LFC designation ATE = ( ${\bar Y_{T1}} - {\bar Y_{T0}}) - \left( {{{\bar Y}_{C1}} - {{\bar Y}_{C0}}} \right)$
. The term (
${\bar Y_{T1}} - {\bar Y_{T0}}) - \left( {{{\bar Y}_{C1}} - {{\bar Y}_{C0}}} \right)$
. The term ( ${\bar Y_{T1}} - {\bar Y_{T0}})\;$
represents the change in the outcome for LFC counties. The term (
${\bar Y_{T1}} - {\bar Y_{T0}})\;$
represents the change in the outcome for LFC counties. The term ( ${\bar Y_{C1}} - {\bar Y_{C0}})$
represents the natural change in the outcome variable of non-LFC counties. The crucial assumption of the DID method is that both treatment and control groups have “parallel trends,” i.e., in the absence of LFC designation, both the treatment and the control counties would have identical changes in their respective outcome variables.
${\bar Y_{C1}} - {\bar Y_{C0}})$
represents the natural change in the outcome variable of non-LFC counties. The crucial assumption of the DID method is that both treatment and control groups have “parallel trends,” i.e., in the absence of LFC designation, both the treatment and the control counties would have identical changes in their respective outcome variables.
A slight modification on the DID model is needed since the timing of LFC designation was not concurrent—some counties were designated LFC as early as in 2006, and others were designated as recently as 2018. To account for the difference, a modified version of DID called the DID with a staggered entry of the units is more appropriate (Dhoubhadel, Reference Dhoubhadel2021; Galiani, Gertler, and Schargrodsky, Reference Galiani, Gertler and Schargrodsky2005; Jensen, Reference Jensen2007). The assumption of “parallel trends” in outcome variables across counties may also be invoked in this case. The assumption may be violated if LFC-designated counties are markedly different from non-LFC-designated counties, and these differences are correlated with the outcome variables. The assumption is also violated if there are exogenous shocks to the industry that may induce counties to apply for the designation, leading to livestock expansion/contraction when the designation is granted.
To estimate the DID with staggered entry, we use a standard fixed effect panel data DID model. The model controls for the time-invariant unobservable individual characteristics of the counties that might be correlated with LFC designation as well as the observable time-variant variables that affect LFC designation. Accounting for both time-invariant and time-variant variables mitigates selection bias due to the inclusion of county-specific characteristics and helps isolate the actual impact of LFC designation.
The fixed-effect modified DID model is specified as:
 $${Y_{it}} = \alpha + \beta {{\rm X}_{it}} + {\lambda _i} + {\gamma _t} + \delta\, LF{C_i} + {\varepsilon _{it}}$$
where ${Y_{it}}\;$
is the outcome variable measuring the different dimensions of cattle industry expansion mentioned earlier: cattle numbers, cattle density, cattle share, and cattle per capita of county i in year t;
${Y_{it}}\;$
is the outcome variable measuring the different dimensions of cattle industry expansion mentioned earlier: cattle numbers, cattle density, cattle share, and cattle per capita of county i in year t; ${{\rm X}_{it}}$
is a vector of time-varying observable characteristics. As in Mills et al. (Reference Mills, Azzam, Brooks and Aiken2016), the vector includes cattle and corn prices, real per capita income, population density (human population per sq. miles), indicator variables for the presence of ethanol plants in the county and neighboring countiesFootnote 4, and an indicator variable for LFC designation status of neighboring counties. We also added an indicator variable to account for periods of cattle expansion and contraction during the cattle cycle.
${{\rm X}_{it}}$
is a vector of time-varying observable characteristics. As in Mills et al. (Reference Mills, Azzam, Brooks and Aiken2016), the vector includes cattle and corn prices, real per capita income, population density (human population per sq. miles), indicator variables for the presence of ethanol plants in the county and neighboring countiesFootnote 4, and an indicator variable for LFC designation status of neighboring counties. We also added an indicator variable to account for periods of cattle expansion and contraction during the cattle cycle.
The expectation is that higher cattle prices and lower corn prices contribute positively to cattle industry expansion. A higher population density should dampen livestock expansion, as should LFC designation of neighboring counties. The effects of ethanol plant presence and real per capita income on cattle industry expansion are ambiguous. While the presence of ethanol plants may contribute negatively to cattle industry expansion by increasing corn prices, it may also contribute positively by providing a substitute for cattle feeding in the form of distillers’ grain. The effect of an increase in per capita income is also ambiguous. An increase in county per capita income allows producers to buy more cattle and build new facilities, contributing positively to cattle industry expansion. An increase in county per capita income also implies higher labor wages, contributing negatively to the expansion. We also expect cattle expansion/contraction in Nebraska to follow the national cattle cycle.
The coefficient ${\lambda _i}\;$
is the fixed effect unique to each county, and
${\lambda _i}\;$
is the fixed effect unique to each county, and ${\gamma _t}$
is the time effect that is common to all counties.
${\gamma _t}$
is the time effect that is common to all counties. $LF{C_i}\;$
is the indicator variable taking a value of one for the years during county i has LFC designation and zero otherwise, and ϵit
is an independently distributed error term. The estimate of
$LF{C_i}\;$
is the indicator variable taking a value of one for the years during county i has LFC designation and zero otherwise, and ϵit
is an independently distributed error term. The estimate of ${\delta}$
is the DID estimate, i.e., the change in the dependent variables attributable to LFC designation. The estimate is inferred as follows:
${\delta}$
is the DID estimate, i.e., the change in the dependent variables attributable to LFC designation. The estimate is inferred as follows:
For control counties
 $${Y_{c0}} = \alpha + \beta + {\lambda _c} + {\gamma _0}$$
 $$\;{Y_{c1}} = \alpha + \beta + {\lambda _c} + {\gamma _1}$$
 $${Y_{c1}} - {Y_{c0}} = {\gamma _1} - {\gamma _0}$$
For treatment counties
 $${Y_{T0}} = \alpha + \beta + {\lambda _T} + {\gamma _0}$$
 $${Y_{T1}} = \alpha + \beta + {\lambda _T} + {\gamma _1} + {\delta}$$
 $${Y_{T1}} - {Y_{T0}} = {\gamma _1} - {\gamma _0} + {\delta}$$
Average treatment effect (ATE)
 $${\rm ATE} = ({Y_{T1}} - {Y_{T0}}) - ({Y_{c1}} - {Y_{c0}}) = {\delta}$$
While it is not possible to verify the assumption of parallel trends for the entire period, it is possible to test if the trends were ‘parallel’ in periods before LFC designation. For this purpose, we first test if the pre-treatment trends of dependent variables are correlated with the order of LFC designation. This test is implemented by slightly modifying equation (1) as follows (de Janvry and Sadoulet, Reference de Janvry and Sadoulet2016):
 $${Y_{it}} - {Y_{it - 1}} = \alpha + \beta {{\rm X}_{it}} + {\lambda _i} + \sigma \,Entr{y_i} + {\varepsilon _{it}}$$
where $Entr{y_i}$
is a dummy variable equal to one for the years before the LFC designation and zero afterward for county i.
$Entr{y_i}$
is a dummy variable equal to one for the years before the LFC designation and zero afterward for county i.
To test if the adoption of LFC designation is not correlated with dependent variables in the period immediately before the LFC designation, the following model is estimated (de Janvry and Sadoulet, Reference de Janvry and Sadoulet2016):
 $${Y_{it}} = \alpha + \beta {{\rm X}_{it}} + {\lambda _i} + \delta\, LF{C_i} + \phi ImP{d_{it}} + {\varepsilon _{it}}$$
where $ImP{d_{it}}$
is a dummy variable equal to one for the year immediately before county i was designated LFC and zero for the other years in the sample.
$ImP{d_{it}}$
is a dummy variable equal to one for the year immediately before county i was designated LFC and zero for the other years in the sample.
5. Data
The data on time-varying observable characteristics of the counties are obtained from various sources. The data period includes the years from 2000 to 2018. Data on cattle numbers, cattle, and corn prices are obtained from the National Agricultural Statistical Service database (USDA NASS, 2020). To account for decision lags in cattle production, we used lagged 2-year averages for cattle (steer and heifer) and corn prices. As price data are not available at the county level, state-level prices are used. Prices were deflated using the producer price index data for cattle and corn obtained from the U.S. Bureau of Labor Statistics (US BLS, 2020a). County population data are obtained from the Census Bureau (U.S. CB, 2020) and county-level personal income data from the U.S. Bureau of Economic Analysis (US BEA, 2020). Per capita income was deflated by the consumer price index (US BLS, 2020b). Data on ethanol plant location come from the Nebraska Ethanol Board (NEB, 2020). Finally, the list of LFC-designated counties and their respective designation dates are obtained from the Nebraska Department of Agriculture website (NDA, 2020) and J. David Aiken, Professor at the Department of Agricultural Economics of the University of Nebraska-Lincoln. The cattle cycle is represented by a dummy variable that has a value of one during expansion and zero otherwise. Information on years of expansion and contraction is obtained from Market Intel (2020).
Tables 2 and 3 compare the summary statistics of LFC-designated counties with the rest of the counties. On average, cattle density, cattle per capita, two-year average cattle and corn prices, and population density are higher in non-LFC counties than in LFC counties. LFC counties have higher cattle numbers, higher cattle shares, and higher real per capita income compared to non-LFC counties.
Table 2. Descriptive statistics for non-LFC counties

LFC, Livestock Friendly County.
Note: The summary statistics for LFC counties are based on the years during which a county was LFC designated. The summary statistics for non-LFC include all years in the sample. Average prices vary by year and not by county.
Table 3. Descriptive statistics for LFC counties

LFC, Livestock Friendly County.
Note: The summary statistics for LFC counties are based on the years during which a county was LFC designated. The summary statistics for non-LFC include all years in the sample. Average prices vary by year and not by county.
6. Results
Before estimating the impact of LFC on cattle industry expansion, we need to check if the pre-treatment trends in the dependent variables are similar for LFC and non-LFC counties and if the timing of LFC designation is correlated with the dependent variables immediately before the designation. The results of the tests are as follows:
6.1 Pre-treatment Trend Test (equation (9)) and Immediate Period Performance Test (equation (10))
The pre-treatment trend test result is in Table 4. Since the coefficient on the variable “entry” is not statistically different from zero for all of the dependent variables, we conclude that the livestock expansion trend measured by the four alternative dependent variables before LFC designation is the same for both LFC and non-LFC counties.
Table 4. Testing the association between pre-program trend and the order of entry

LFC, Livestock Friendly County.
Notes: Robust standard errors in parentheses. Due to space limitation, the coefficients on county fixed effect are not presented here.
***P < 0.01, **P < 0.05, *P < 0.1.
The immediate period performance test result is in Table 5. The estimate of the variable “immediate period” is not statistically significant from zero for all the dependent variables, indicating that the immediate period (one year) before LFC designation did not influence LFC designation.
Table 5. Testing the association between entry into the program and the immediate period before the entry

LFC, Livestock Friendly County.
Notes: Robust standard errors in parentheses. Due to space limitation, the coefficients on county fixed effect are not presented here.
***P < 0.01, **P < 0.05, *P < 0.1.
6.2. Staggered Entry DID Model Results (equation (1))
Table 6 presents the estimation results of the four alternative DID models: model 1 (cattle numbers), model 2 (cattle density), model 3 (cattle share), and model 4 (cattle per capita). All continuous variables are log-transformed to reduce skewness in the data. Because of heteroscedasticity and serial correlation, all standard errors are robust standard errors. We tested for collinearity among the independent variables and found an average variance inflation factor of 1.44, indicating the absence of multi-collinearity. The time fixed effect is removed from the model as none of the years were statistically different from zero. The coefficient estimates for cattle numbers and cattle density models are almost identical except for the intercept. We present the results of all four models for completeness.
Table 6. Parameter estimates of the DID model

DID, difference-in-difference; LFC, Livestock Friendly County.
Notes: Robust standard errors in parentheses. Due to space limitation, the coefficients on county fixed effect are not presented here.
***P < 0.01, **P < 0.05, *P < 0.1.
As expected, the effect of the price of cattle on cattle expansion is positive and significant at the 10% level for all four models. The corn price coefficient is also statistically significant at the 10% level for models 1, 2, and 4, but the sign is contrary to expectation, implying that cattle expansion took place despite increasing corn prices. Except for model 3, the cattle cycle is also statistically significant and positive, as would be expected in a leading cattle-producing state like Nebraska. The other statistically significant variables are population density and presence of LFC designation of neighboring counties. Both lead to cattle industry contraction. AFOs may face more restrictive regulations in the counties with higher population densities, which can raise their production costs. A plausible explanation for the negative impact of LFC in neighboring counties is that existing livestock enterprises in non-LFC counties may relocate to a neighboring LFC county because of its “friendliness” for livestock operations. Real per capita income and presence of ethanol plants in the county and neighboring counties do not have a statistically significant effect on cattle industry expansion/contraction. As for the effect of the LFC designation, our variable of interest, the evidence from our sample is not sufficient to conclude that the designation had any effect on cattle industry expansion statewide under all of the four model specifications. Stated differently, we find no significant statewide effect of the LFC designation on both the intensive and extensive margins of the state’s cattle industry.Footnote 5
However, an examination of Figures 1 and 2 reveals that some of the state’s Crop Reporting Districts (CRDs) have very few counties designated as LFC. For example, of the 16 counties in the north-central CRD, only three counties have LFC designation. Similarly, of the 10 counties in the south-central CRD, three are LFC designated. In contrast, most counties in the Northwest, Southeast, and Northeast CRDs are LFC designated. This pattern clearly shows that the designation is more concentrated in some parts of the state than others, suggesting that there may be an interaction between LFC designation and CRDs.

Figure 2. Nebraska Crop Reporting Districts (CRDs).
Source: CROPWATCH University of Nebraska-Lincoln. Accessed from https://cropwatch.unl.edu/2019/crop-disease-reports-unl-diagnostic-clinic
Table 7 presents the estimates with the interaction between LFC and CRDs. Resulting coefficient estimates and (robust) standard errors are similar to the estimates in Table 6. Again, the coefficient on LFC is not statistically different from zero in all four models. However, the interaction between LFC and CRD turns out statistically significant for CRDs 5 (Central) and 7 (South Central) irrespective of the dependent variable used. For CRD 1 (Northwest), LFC is significant for all dependent variables except for the cattle share variable.
Table 7. Parameter estimates of the DID model with interaction between LFC and CRDs

DID, difference-in-difference; CRD, Crop Reporting Districts; LFC, Livestock Friendly County.
Notes: Robust standard errors in parentheses. Due to space limitation, the coefficients on county fixed effect are not presented here.
***P < 0.01, **P < 0.05, *P < 0.1.
Judging by the R 2 values of the four models, the model with cattle per capita as the dependent variable is the “best model” if the aim is forecasting, although all the R 2 values are low across the board. Since our aim is hypothesis testing with a focus on the LFC designation, low R 2 values are not a serious concern. Also, given that most of the coefficient estimates are similar across the four models, either model can be used to measure the partial effect on the dependent variables conditioned on LFC by CRD. For that, we need to measure the marginal effects.
Table 8 presents for each CRD, their ID number, CRD name, the ratio of the number of LFC-designated counties to all counties in the CRD, and the marginal effectsFootnote 6. Using a 5% significance level, the estimates in the fourth column indicate that the LFC designation has a statistically significant and positive impact on cattle numbers in counties comprising the Central and South Central CRDs in the order of 12.8% and 19.7%, respectivelyFootnote 7. The corresponding percentage increases in cattle density and cattle per capita are similar. This means that the LFC designation contributed significantly to the intensive and extensive margins of the cattle industry in the two CRDs. The question is what implications does the result have for the LFC designation? We offer a couple of hypotheses below.
Table 8. Marginal effects

DID, difference-in-difference; CRD, Crop Reporting Districts; LFC, Livestock Friendly County.
Note: Robust standard errors in parentheses.
***P < 0.01, **P < 0.05, *P < 0.1.
First, the fact that both CRDs have in place a sizeable preexisting cattle industry, amounting to 32% (Central 20.9% and South Central 11.4%) of all cattle and calves in the state, suggests that agglomeration economies may be behind the effectiveness of LFC in expanding cattle in Central and South Central Nebraska. By agglomeration economies, we mean that in addition to the natural endowments of the region in cattle raising and feeding, cattle production is probably attracted by aggregate external benefits known to contribute to external economies, such as shared infrastructure, availability of suppliers upstream and customers downstream, and a labor pool (Artz, Kim, and Orazem, Reference Artz, Kim and Orazem2016). Should that be true, the corollary is that the LFC designation might be a more effective policy for cattle expansion in counties that are already endowed with the initial conditions for cattle production and are adjacent to similarly endowed counties. This is in line with the implications of agglomeration economies for rural industrial development policies in general. According to Barkley and Henry (Reference Barkley and Henry1997), policies aimed at expanding industries in areas that lack agglomeration economies will likely fail to attract new firms.
However, what is curious is that the South Central and Central CRDs have the second and third lowest number of LFC counties within their boundaries (three out of eight and four out of eight, respectively (Table 8))Footnote 8. On the other hand, in CRDs where the impact of LFC is statistically insignificant, the proportion of counties with LFC designation is consistently higher than South Central and Central CRDs and goes as high as 10 out of 11 counties in the North West. While this observation does not invalidate the notion of agglomeration economies at the CRD level, it is suggestive that agglomeration economies may have been exhausted as more counties join the LFC club within their CRDs.
In sum, while the LFC designation effectively expands cattle numbers by offering benefits to CRDs with significant livestock production clusters, those benefits are exhausted as more counties are designated LFC. According to the LFC designation code, designated counties have to devise livestock development and promotion programs, which require tangible resources. Given this requirement, future applicants, where most counties in a CRD have the designation, may want to compare the marginal cost and benefit of LFC designation.
7. Summary and Conclusions
In this paper, we re-examine the impact of the Nebraska LFC program by accounting for the staggered designations of counties between 2005 and 2018 and, in so doing, contribute to the literature on geographical designations in a setting where units (e.g., cities, counties, states, or countries) are designated at different points in time. We estimate a fixed effect DID model with staggered treatments for a data panel from 2000 to 2018. Four county-level outcome variables are considered: cattle numbers, cattle density per square mile, cattle share, and cattle per capita. Control variables include cattle and corn prices, the cattle cycle, ethanol plants in a county and its neighboring counties, population density, per capita income, and interaction between LFC and Nebraska crops reporting districts.
While we fail to reject the hypothesis of no effect of LFC designation statewide, the marginal effect of the designation on cattle industry expansion is noteworthy for two crop reporting districts: Central and South Central. Both CRDs have sizeable preexisting livestock clusters, suggesting that the effectiveness of the LFC designation may have been facilitated by cattle agglomeration economies. However, compared to other CRDs, the Central and South Central CRDs also have the second and third lowest number of counties with LFC designation. This raises the question of why the LFC designation is not effective at expanding livestock production in counties with larger numbers of counties with LFC designation. We postulate the reason might be that as more counties within a CRD are designated LFC, agglomeration economies are exhausted, rendering the designation ineffective in expanding livestock production.
Should such economies exist, one policy implication is that livestock business promotion tools, such as LFC, might be more effective for expanding livestock production if the whole CRD is designated as livestock-friendly rather than a single county. CRDs may be more relevant for the manifestation of agglomeration economies than a county. This approach is in line with research findings, which calls into question the efficacy of blanket, rather than targeted, rural development policies (Artz, Kim, and Orazem, Reference Artz, Kim and Orazem2016). However, as more counties adopt the designation, agglomeration economies may be exhausted, diminishing the designation’s effectiveness. Since the designation is not costless to counties, as they have to demonstrate a commitment to livestock production through a concrete program that requires real resources, future applicants in LFC-crowded CRDs may want to weigh the marginal benefit against the marginal cost of the LFC designation.
Whether such livestock agglomeration economies exist in Nebraska and elsewhere is an empirical question that is worth addressing in the future. This could prove useful for state and local decision-makers to evaluate local economic policy impacts ex-ante. The methodology we use in this paper could also prove useful in evaluating staggered local policy decisions ex-post.
Acknowledgments
The authors thank Dr. J. David Aiken, Professor at the Department of Agricultural Economics of the University of Nebraska-Lincoln, for providing the information in Table1. Dr. Sunil P Dhoubhadel acknowledges support from the Faculty Enhancement Program at Prairie View A&M University to publish this article.


 Open access