


Dietary protein is one of the most expensive components and most important nutrients incorporated in aquatic animal feed(Reference Wang, Zhang and Yang1). Insufficient quantity or poor quality of dietary protein results in a reduction or cessation of the growth of aquatic animals. Furthermore, excessive protein in the aquafeed leads to increased costs and pollutes the environment(Reference Zhang, Yin and Gao2). Fish meal (FM) is used as a major animal protein source within most aquatic animals formulas due to its high digestibility, balanced essential amino acid composition, vitamins, minerals and good palatability(3). However, FM production is gradually declining, and its price and demand are increasing because of a reduction in global capture fisheries(Reference Cao, Naylor and Henriksson4,Reference Hardy5) . Therefore, research on new dietary protein sources as substitutes for FM has aroused wide concern in aquaculture.
Currently, many kinds of plant protein sources have been widely used in aquaculture as the main source of FM substitution, such as red swamp crayfish feed. However, commercial use of plant protein sources is often restricted due to anti-nutritional factors(Reference Francis, Makkar and Becker6), lower lipid digestibility(Reference Brinker and Reiter7) and a lack of some essential amino acids(Reference Dayal, Jannathulla and Ambasankar8). Several studies suggest that aquafeed can be formulated using multiple plant protein combinations to balance amino acids and reduce FM consumption and feed costs without affecting the growth performance of aquatic animals, such as Litopenaeus vannamei (Reference Dayal, Jannathulla and Ambasankar8–Reference Yue, Liu and Tian11), Procambarus clarkii (Reference Tan, Song and Chen12), Marsupenaeus japonicus (Reference Bulbul, Kader and Asaduzzaman13), Ctenopharyngodon idella (Reference Hu, Hu and Wu14) and Eriocheir sinensis (Reference Jiang, Chen and Qin15,Reference Luo, Li and Wang16) .
The Redclaw crayfish Cherax quadricarinatus has been widely cultivated around the world due to its high economy and rich nutrition(Reference Edgerton17–Reference Yin, Yan and Zheng19). C. quadricarinatus is an omnivore, but its phytophagous characteristics have attracted the attention of researchers(Reference Campaña-Torres, Martínez Córdova and Villarreal Colmenares20–Reference Figueiredo and Anderson22). Because of the presence of special endogenous cellulase(Reference Figueiredo, Kricker and Anderson23–Reference Xue, Anderson and Richardson25), C. quadricarinatus can efficiently digest plant proteins. At present, plant-based baits, including pumpkin, carrots and so on, are still used in practical production for feeding. However, feeding plant-based bait is not only harmful to culture management but also does not satisfy the nutrient requirements of crayfish during the growth period. Therefore, the development of special feeds containing plant-based protein for the pre-adult stage of Redclaw crayfish is a feasible approach. In addition, cellulose degradation depends on gut microbiota at the phylum level, such as Proteobacteria, Firmicutes, Actinobacteriota, Bacteroidetes and Fusobacteria (Reference Parma, Candela and Soverini26–Reference Zhu29).
Previous research found that cottonseed meal (CM) is the most suitable FM substitution, followed by soyabean meal (SM)(Reference Qian, Yang and Xu30). Nevertheless, previous studies have not determined the substitution ratio and the effect of combined replacement. Further research should be undertaken to investigate the utilisation of multiple plant protein sources. Therefore, in the present study, diverse plant protein combinations and multiple substitution ratios in crayfish diets were used to determine the effects on the growth, antioxidant ability, body composition, intestinal morphology and gut microbiota of Redclaw crayfish. The results provide a theoretical reference for the development of a special compound aquafeed of C. quadricarinatus.
Materials and methods
Experimental diets
All abbreviations of the present study are shown in Table 1. FM was used as the sole protein source in the control diet (FM). Seven experimental diets were produced by the formula shown in Table 2. Seventy-five percentage or 100 % of the dietary FM was replaced by SM (SM75 and SM100) or CM (CM75 and CM100), respectively. Fifty percentage, 75 % or 100 % of the FM was replaced by a mixture of SM and CM with equal crude protein (SC50, SC75 and SC100), respectively.
Table 1. All abbreviations and full name covered in this study
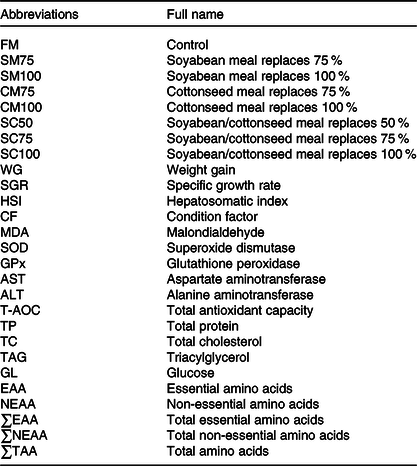
Table 2. Ingredients (g/kg dry basis) and proximate composition (%) of the eight experimental diets fed to Cherax quadricarinatus

FM control, fish meal control; SM75/SM100, soyabean meal replaces 75/100 %; CM75/100, cottonseed meal replaces 75/100 %; SC50/75/100, soyabean/cottonseed meal replaces 50/75/100 %.
* Sangon Biotech, Ltd., Shanghai, China.
† Shanghai Taiwei, Ltd., Shanghai, China.
‡ Vitamin mix (g/kg premix): thiamin, 0.5; riboflavin, 3; pyridoxine, 1; cyanocobalamine, 0.003; ascorbic acid (35 %), 100; α-tocopherol (50 %), 50; menadione, 2; inositol, 5; nicotinamide, 5; cholecalciferol (500 000 μg/g), 0.8; retinol palmitate (500 000 μg/g), 0.48; folic acid, 0.18; biotin, 0.05; choline chloride, 100; pantothenic acid, 5. All ingredients were filled with α-cellulose to 1 kg.
§ Mineral mix (g/kg premix): KCl, 28; MgSO4, 71; ZnSO4, 20; MnSO4·H2O, 1.625; CuSO4·5H2O, 0.625; Ca (IO3)2, 0.2; CoCl2·6H2O, 0.01; NaH2PO4, 215; CaHPO4·2H2O, 250; CaCO3, 180; Na2SeO3, 0.025; FeSO4·H2O, 10; KH2PO4, 216. All ingredients were filled with α-cellulose to 1 kg.
|| Sangon Biotech, Ltd., Shanghai, China.
In the formula, FM, SM and CM were used as the main dietary protein sources. Wheat starch was supplied as the carbohydrate. Soyabean oil, soyabean lecithin and cholesterol were used as the lipid sources. All the raw materials were fully ground and sieved through a 60-mesh sieve. The dry ingredients were finely ground and mixed thoroughly, and then oils were slowly added. The mixture was passed through a 40-mesh sieve, and distilled water was added to the dry mixture to attain a soft dough (120 ml/kg dry diet). The mixtures were extruded by a double helix plodder into 2·0-mm diameter and cut into diet pellets (CD4 × 1TS, SCUT). Diet pellets were naturally dried at room temperature until the moisture was < 10 % and then stored at −20°C. The amino acid profiles of the eight experimental diets are shown in Table 3.
Table 3. The amino acid profiles (g/100 g DM) of the eight experimental diets
(Mean values and standard errors)

EAA, essential amino acids; NEAA, non-essential amino acid; ∑EAA, total essential amino acids; ∑NEAA, total non-essential amino acids; ∑TAA, total amino acids.
FM control, fish meal control; SM75/SM100, soyabean meal replaces 75/100 %; CM75/100, cottonseed meal replaces 75/100 %; SC50/75/100, soyabean/cottonseed meal replaces 50/75/100 %.
a,b,cValues within a row without a common superscript letter are significantly different (a indicates a higher value). The results are presented as the mean ± se (n 4).
Crayfish rearing and experimental conditions
Seven hundred juvenile Redclaw crayfish (11·70 (se 0·13) g) were purchased from an aquaculture company in Chengmai county, Hainan province, China. The C. quadricarinatus were allocated into net cages (90 cm × 60 cm × 90 cm) with a stocking density of twenty crayfish per net cage. All experimental diets were investigated in randomly distributed quadruplicate cages. Polyvinyl chloride pipe was included in each net cage as shelters and continuously aerated with air stones by blowers. The experimental animals were fed manually twice a day at 08.30 and 18.30 hours with a daily ratio of 3 % body mass of crayfish. During the experiment, aerated water temperature was kept at 27 (se 3)°C, dissolved oxygen concentration kept over 4 mg/l and the pH ranged from 7·8 to 8·2. In addition, the water exchange rate was 70 % of the cement pool every week. During the trial period, to maintain stable water quality, the spare aerated water was stored in aeration pools close to the breeding pools. The culture water was exchanged by aerated tap water through a pipe from a storage pool. In addition, the culture water has filtered the algae through a 48-μm nylon screen to maintain water quality.
Experimental sample collection and animal ethics
At the end of the 8-week trial, all crayfish were fasted for 24 h before sampling. All crayfish were anaesthetised in ice bath prior to sampling. Crayfish were counted and weighed to calculate survival, weight gain and specific growth rate. Five crayfish were randomly selected from each cage and stored at −20°C to analyse the whole-body composition. In each replicate, the haemolymph samples were extracted from the pericardial cavity using 1-ml sterile syringes. The hepatopancreas was weighed to calculate the hepatosomatic index, and body length was measured to calculate the condition factor of crayfish. The hepatopancreas, muscle and intestine samples were partially separated on ice, transferred to liquid N2 for quick freezing and then stored at −80°C for further analysis. Partial intestinal samples were separated and fixed in paraformaldehyde (4 %) for histological analysis.
The experimental procedures and designs in this study were approved by the Hainan University Institutional Animal Use and Care Committee, Haikou, China (HNUAUCC-2020-00004).
The survival, weight gain, specific growth rate, hepatosomatic index and condition factor were calculated using the following formulae:
(1) Weight gain (WG, %) = 100 × (final crayfish weight – initial crayfish weight)/initial crayfish weight
(2) Specific growth rate (% day–1) = 100 × (ln (final crayfish weight) – ln (initial crayfish weight))/days
(3) Survival (%) = 100 × (final crayfish number/initial crayfish number)
(4) Hepatosomatic index (%) = 100 × (wet hepatopancreatic weight/final crayfish weight)
(5) Condition factor (%) = 100 × (final crayfish weight/final crayfish body length3)
Whole-body proximate composition analysis
The composition of raw feed ingredients, experimental diets and crayfish whole-body samples was analysed based on standard Association of Official Agricultural Chemists (AOAC) protocol(31). Moisture contents were calculated gravimetrically after drying samples at 105°C for 10 hours to a constant weight. The crude protein contents of the samples were determined by the Dumas combustion method using a protein analyser (FP-528, Leco). Crude lipid concentration was extracted by the Soxhlet extraction system. The ash contents were analysed by combustion in a muffle furnace (SX2-4-10 N) at 550°C for 8 h.
Muscle amino acid composition
The amino acid compositions of the experimental diets and crayfish muscle were determined by hydrolysing samples with 6 mol/l hydrochloric acid at 110°C for 24 h and neutralised to pH 7·0 with NaOH. The hydrolysate was filtered and evaporated to remove other acids. The acid-free liquid was mixed with 0·05 mol/l hydrochloric acid, and a 0·2-μm nylon membrane filter was used to remove other residues. Phenyl thiocarbamate was synthesised from phenyl isothiocyanate by precolumn derivatisation of amino acids, which can be detected with HPLC amino acid analytical system. During acid digestion, the partial oxidation of sulphur-containing amino acids, in particular methionine, was prevented by using 0·1 % phenol. The composition of amino acids in experimental diets and muscle samples was measured using an automatic amino acid analyser (Biochrom 20, Harvard Bioscience Company).
Analysis of digestive enzyme activity
Hepatopancreas and intestinal samples of crayfish were weighed and homogenised on ice in 10 volumes (v/w) of prechilled saline solution (0·86 %), and then all the homogenate was centrifuged at 3000 rpm at 4°C for 10 min. The activities of amylase, lipase, pepsin and trypsin in the hepatopancreas and intestinal supernatant were measured by commercial kits (C016, A054, A080, A080, Jiancheng Bioengineering Institute). The digestive enzyme activities were determined by previously published documents(Reference Chen, Feng and Kuang32,Reference Cheng, Ai and Mai33) . In this system, 1 mg reducing sugar catalysed by per gram of tissue per minute is defined as 1 unit of amylase enzyme activity. One gram of tissue protein reacts with substrate in the reaction system at 37°C, and 1 μmol substrate consumption is considered as 1 lipase activity unit. Pepsin enzyme activity unit is defined as 1 μg tyrosine generated with protein hydrolysis catalysed by enzymes within 1 g protein. One trypsin activity unit is defined as every 0·003 change in absorbance per minute caused by trypsin in 1 mg protein from tissues at 37°C and pH = 8.
Biochemical analysis
After the feeding trial, the haemolymph from two crayfish per replicate was collected. After that, all samples were centrifuged at 3000 rpm for 10 min at 4°C, and the serum was collected for antioxidant capacity assays according to the instructions of commercial kits. The contents of malondialdehyde (MDA), activities of superoxide dismutase (SOD), glutathione peroxidase (GPx), aspartate aminotransferase (AST), alanine aminotransferase (ALT) and total antioxidant capacity in the serum of crayfish were measured by using the relevant commercial kits with the codes A003, A001, A005, C010, C009 and A015, respectively (Jiancheng Bioengineering Institute). The contents of total protein, total cholesterol, TAG and glucose in the hepatopancreas of crayfish were also detected with relevant commercial kits (A045, A111, A110 and A019, respectively) purchased from Nanjing Jiancheng Bioengineering Institute. SOD, GPx, MDA and total antioxidant capacity were analysed with previously reported documents(Reference Benzie and Strain34–Reference Reiners, Kodari and Cappel37). The SOD activity was tested by using the Water soluble tetrazole salt (WST-1) method. Corresponding quantity of SOD that its inhibition percentage reaches 50 % in a mixture reaction is considered as one SOD activity unit. GPx activity was determined by using the colorimetric method. One unit of GPx activity was defined as 1 mmol/l GSH concentration decreasing (already deducted effect of non-enzymatic reaction) in reaction system per mg protein per 60 s. The MDA content was determined by the Thibabituric Acid (TBA) method. MDA can combine with TBA to produce red compounds, which has absorption peak at 532 nm. Total antioxidant capacity was tested by the spectrophotometric method. One unit of total antioxidant capacity was defined as 0·01 reaction system OD value increasing per ml blood serum per 60 s at 37°C. The activities of ALT and AST were determined according to a published procedure(Reference Chen, Feng and Kuang32). The determination of the content of total protein in the hepatopancreas was based on previous feasible methods(Reference Bradford38).
Paraffin sections of the intestine
Three crayfish intestines from each replicate were used for histological analysis. Intestinal samples were kept in 4 % paraformaldehyde for 24 h dehydrated through ascending concentrations of ethanol and cleaned in xylol. After that, the samples were embedded in paraffin and then cut into 5 μm slice thicknesses (RM2125 RTS). Tissue slices of the intestines were stained with haematoxylin and eosin (H&E). After washing and drying, the thicknesses were sealed with resin. The stained sections were observed using a light microscope (Eclipse 200, Nikon) and photographed by the SBI image analysis software (version 2·0, HK SAIBAO Instrument Limited Co.).
Intestinal microbiota analysis in Cherax quadricarinatus
The intestines of crayfish fed the FM, SM100, CM100 and SC100 diets were collected according to the growth performance and health status for the intestinal microbiota assays (n 4). Total intestinal bacterial DNA was extracted from the gut contents of the four experimental groups using an E.Z.N.A.® Soil DNA Kit (Omega Bio-Tek). DNA quality and concentration were assessed by Nano Drop 200 Spectrophotometer (Thermo). Bacterial DNA was used as the template for 16S rRNA gene V4–V5 region amplification. PCR was performed utilising the forward and reverse primers 338F (5′-ACTCCTACGGGAGGCAGCAG-3′) and 806R (5′-GGACTACHVGGGTWTCTAAT-3′), respectively. PCR products were isolated from a 2 % agarose gel and purified using a PCR product recovery kit (Thermo Scientific Inc.) before being quantified utilising a Quantus™ Fluorometer (Promega). Subsequently, sequencing libraries were created by the NEXTFLEX ® Rapid DNA-Seq Kit based on the manufacturer’s procedure, and then purified amplicons were subjected to the Illumina MiSeq PE300 platform for analysis by high-throughput sequencing (Majorbio Technology Co., Ltd.). The sequencing datasets obtained in this study are deposited in SRA with the accession number SRP310043.
Operational taxonomic units (OTU) were clustered with a level of 97 % sequence similarity via UPARSE software (version 7.0.1). For each representative sequence, RDP classifier software was used for species annotation(Reference Wang, Garrity and Tiedje39). Theα-diversity indexes, including Shannon, Simpson, Chao1 and ACE, were measured by QIIME software (version 1.9), and the t test analysis method was used to analyse the difference among the four experimental treatments. The β-diversity among bacterial communities was determined by non-metric multidimensional scaling according to the Bray–Curtis method(Reference Hammer, Harper and Ryan40). Venn diagrams were used to authenticate unique and common OTU among four experimental treatments. The linear discrimination analysis effect size (LEfSe) was used to determine the biomarkers in bacterial communities between each two treatments(Reference Segata, Izard and Waldron41). The Wilcoxon rank-sum test evaluated the genera with relative abundance in the top 10 in the intestinal tract of crayfish in each group. Heatmaps were created for genera with relative abundance in the top 50, and one-way ANOVA was performed to determine significant differences among all treatments. The microbial functions were predicted using the phylogenetic investigation of communities by reconstruction of unobserved states (PICRUSt) by 16S data and metagenomic data. The functional profiles of the microbial communities were annotated according to the Kyoto Encyclopedia of Genes and Genomes at levels 1, 2 and 3(Reference Langille, Zaneveld and Caporaso42).
Statistical analysis
Statistical analysis was performed via SPSS software version 24.0 (IBM). All results are presented as the mean values and standard errors. The data conform to the prerequisites for ANOVA: comparability, normality and homogeneity. One-way ANOVA was used to confirm the effects of FM substitution, and the significant difference level was P < 0·05. Tukey’s multiple comparison test was utilised to compare the group mean values when there were significant differences among the dietary treatments. Furthermore, the t tests were performed to determine the difference between each treatment group and the control group. Other analysis tests are as follows:
1. The Wilcoxon rank sum test was used to determine the genus-level bacteria.
2. PICRUSt was utilised to predict the function of the intestinal microbiota.
3. LEfSe was used to determine the biomarkers in bacterial communities.
4. The α-diversity and β-diversity indices were applied to analyse the gut bacterial diversity and resemblance.
Result
Growth performance and hepatosomatic index
Different plant protein sources and FM replacement ratios showed no significant difference in survival, condition factor or hepatosomatic index (P > 0·05). The WG and specific growth rate of crayfish fed the CM100 and SC100 diets were significantly lower than those in the control (P < 0·001). Meanwhile, crayfish fed the CM100 diets displayed significantly lower WG and specific growth rate values than those fed the other substituted diets, excluding the SC100 diet (P < 0·05). There was no significant difference in WG and specific growth rate between crayfish fed FM and SC50 (P > 0·05) (Table 4).
Table 4. Growth performances of C. quadricarinatus fed different experimental diets
(Mean values and standard errors)

WG, weight gain; SGR, special growth rate; HSI, hepatosomatic index; CF, condition factor; C. quadricarinatus, Cherax quadricarinatus.
FM control, fish meal control; (SM75/SM100, soyabean meal replaces 75/100 %; CM75/100, cottonseed meal replaces 75/100 %; SC50/75/100, soyabean/cottonseed meal replaces 50/75/100 %.
a,b,cValues within a row without a common superscript letter are significantly different (a indicates a higher value). The results are reported as the mean ± se (n 4).
Asterisks denote statistically significant differences.
*(P < 0.05).
**(P < 0.01).
***(P < 0.001), compared with the control group.
Whole-body proximate composition and amino acids composition in muscle
After the 8-week feeding trial, different dietary plant protein sources and FM replacement ratios had no significant impact on the moisture, crude protein, crude lipid or ash of crayfish (P > 0·05) (Table 5).
Table 5. Proximate composition (% wet weight) of Cherax quadricarinatus fed the eight experimental diets
(Mean values and standard errors)

Values are presented as the mean ± se (n 4).
FM control, fish meal control; SM75/SM100, soyabean meal replaces 75/100 %; CM75/100, cottonseed meal replaces 75/100 %; SC50/75/100, soyabean/cottonseed meal replaces 50/75/100 %.
There was no significant difference in the relative contents of total essential amino acids, total non-essential amino acids and total amino acids in crayfish among experimental groups (P > 0·05). The concentrations of arginine and valine in the tail muscle of crayfish fed the CM100 diet were significantly higher than those in the control. Similarly, crayfish fed the SC50 and SC75 diets showed a significantly increased relative content of valine compared with the control (P < 0·05) (Table 6).
Table 6. Amino acid profile (g/100 g DM) in tail muscle of Cherax quadricarinatus fed different experimental diets
(Mean values and standard errors)

EAA, essential amino acids; NEAA, non-essential amino acid; ∑EAA, total essential amino acids; ∑NEAA, total non-essential amino acids; ∑TAA, total amino acids.
FM control, fish meal control; SM75/SM100, soyabean meal replaces 75/100 %; CM75/100, cottonseed meal replaces 75/100 %; SC50/75/100, soyabean/cottonseed meal replaces 50/75/100 %.
a,b,cValues within a row without a common superscript letter are significantly different (a indicates a higher value). Values are presented as the mean ± se (n 4).
Digestive enzyme activities in hepatopancreas and intestine
The effects of all treatments on the activities of trypsin, pepsin, lipase and amylase in the hepatopancreas or intestine are displayed in Fig. 1. Compared with the control diet, the trypsin activity produced in the hepatopancreas was significantly reduced in all treatments except the SM75 diet (P < 0·05) (Fig. 1(a)). The intestinal trypsin activity in the CM75, CM100 and SC50 groups was notably lower than that of those fed a control diet (P < 0·05) (Fig. 1(e)). The hepatic pepsin activity in the rest of the treatment groups significantly declined, except those of the crayfish fed the SC50 and SC75 diets, compared with the control group (P < 0·05) (Fig. 1(b)). Hepatic pepsin activity in the SC50 and SC75 groups was markedly higher than that in the other treatments (P < 0·05) (Fig. 1(b)). Compared with the control, intestinal pepsin activity markedly decreased in the SM75, CM75 and CM100 groups (P < 0·05) (Fig. 1(f)). Higher intestinal pepsin activity was found in the SC50 group than in the groups of other plant substitutes, excluding the SC75 group (P < 0·05) (Fig. 1(f)). Lipase activity in the hepatopancreas and intestine was not significantly affected by any of the groups (P > 0·05) (Fig. 1(c) and (g)). Except for the SC50 diet, higher activities of amylase in the hepatopancreas were observed in crayfish fed with all replaced diets compared with those reared in the control group (P < 0·05) (Fig. 1(d)). Crayfish fed the SM75, SM100, CM75, SC50 and SC75 diets had significantly higher intestinal amylase activity than crayfish in the control (P < 0·01) (Fig. 1(h)).

Fig. 1. The activities of trypsin (a), pepsin (b), lipase (c) and amylase (d) in the hepatopancreas and the activities of trypsin (e), pepsin (f), lipase (g) and amylase (h) in the intestine of C. quadricarinatus fed the eight experimental diets. SM75 and SM100, dietary FM is replaced by soyabean meal at the ratio of 75 and 100 %. CM75 and CM100, dietary FM is replaced by cottonseed meal at ratios of 75 and 100 %, respectively. SC50, SC75 and SC100, dietary FM is replaced by soyabean meal and cottonseed meal mixture (equal crude protein contents) at the ratio of 50, 75 and 100 %. Values (mean ± se) in bars that show the same letter or nothing are not significantly different (P > 0·05) between treatments. Values are presented as the mean ± se (n 4). Asterisks denote statistically significant differences via t test *(P < 0·05), **(P < 0·01), ***(P < 0·001), compared with the FM group. C. quadricarinatus, Cherax quadricarinatus; FM, fish meal.
Antioxidant status and the amount of energy materials in hepatopancreas
The SOD activities were the highest in the CM100 group and were significantly higher than those in the control and SM75 groups (P < 0·05) (Fig. 2(a)). The GPx activities were significantly higher in the CM100 group than in the control, SM75, SC75 and SC100 groups (P < 0·05) (Fig. 2(b)). No difference was observed in haemolymph total antioxidant capacity among all treatments (P > 0·05) (Fig. 2(c)). The MDA concentration also showed a significantly elevated trend in the SM100, CM100 and SC100 treatments compared with the control diet (P < 0·001) (Fig. 2(d)). The CM100 and SC100 diets significantly affected the MDA concentrations, which were notably increased compared with the SM75, CM75 and SC50 diets (P < 0·05) (Fig. 2(d)). Compared with the control and SC50 groups, the ALT activities were significantly increased in C. quadricarinatus fed with pure CM that completely replaced the FM diet (P < 0·01) (Fig. 2(e)). Except for the SC50 diet, the AST activities of the haemolymph in crayfish fed with other substituted diets were higher than those cultivated in the control (P < 0·01) (Fig. 2(f)).

Fig. 2. The levels of SOD (a), GPx (b), T-AOC (c), ALT (e) and AST (f) and the contents of MDA (D) in the haemolymph of C. quadricarinatus fed the eight different diets for 8 weeks. There was a significant difference between groups represented by different letters (P < 0·05). Values are presented as the mean ± se (n 4). Statistical analysis was determined by t test, and significant differences are indicated by *(P < 0·05), **(P < 0·01), ***(P < 0·001). SOD, superoxide dismutase; GPx, glutathione peroxidase; T-AOC, total antioxidant capacity; ALT, alanine aminotransferase; AST, aspartate aminotransferase.
Of all the replaced treatments, there was no significant difference in total cholesterol, total protein, TAG or glucose (P > 0·05) (Fig. 3(a–d)). However, with the replacement of CM increasing, a significant elevation of hepatopancreas glucose content in CM75 and CM100 was found in comparison with the control (P < 0·01) (Fig. 3(c)). In addition, the content of total protein in SM75 and SC75 was much higher than that in crayfish in the control (P < 0·01).

Fig. 3. The contents of total cholesterol (a), TAG (b), glucose (c) and total protein (d) in the hepatopancreas of C. quadricarinatus fed the eight experimental diets for 8 weeks. Values (mean ± se) in bars that show the same letter or nothing are not significantly different (P > 0·05) among treatments. Values are presented as the mean ± se (n 4). Asterisks denote statistically significant differences via t test *(P < 0·05), **(P < 0·01), ***(P < 0·001), compared with the FM group. C. quadricarinatus, Cherax quadricarinatus; FM, fish meal.
Intestinal histology
The intestinal histology of crayfish fed different plant protein sources and rations is shown in Fig. 4. The intestinal peritrophic membrane, observed from the control, covered the intestinal folds closely, and the goblet epithelial cells attached to the intestinal folds. In contrast, the intestinal peritrophic membrane structure of crayfish fed SM100 and CM100 was partially detached from the intestinal folds. The intestinal histology of crayfish fed the SM75, CM75, SC50, SC75 and SC100 diets was similar to that of the control.

Fig. 4. Intestinal histology of C. quadricarinatus fed diets with different replacement levels of plant protein sources. The magnification was 400×. Arrows show the peritrophic membrane detached from the intestinal epithelial cells and intestinal folds. C. quadricarinatus, Cherax quadricarinatus.
Differences in intestinal microbial community composition, diversity and structure
In total, 675 825 high-quality sequences were obtained from sixteen crayfish intestinal samples, with an average of 42 239 valid sequences per sample. No significant difference was found inα-diversity indexes, including Chao1, Shannon and Simpson indexes, compared with the control (P > 0·05) (Fig. 5(a), (b) and (c)). The Ace index, as one of the community richness indexes, was markedly decreased in the SC100 treatment compared with the control (P < 0·05) (Fig. 5(c)). Venn diagrams showed that 184 OTU were shared among all treatments (Fig. 5(e)). In addition, 129, 42, 78 and 40 unique OTU only appeared in FM, SM100, CM100 and SC100, respectively (Fig. 5(e)). In nonmetric multidimensional scaling analysis, the Bray–Curtis distance between SM100 and CM100 treatments was observed to cluster together and remarkably detached from the FM group (Fig. 5(f)). Moreover, the SC100 group showed OTU clusters similar to those of the FM group (Fig. 5(f)).

Fig. 5. α-Diversity, β-diversity and OTU difference in intestinal microbiota of C. quadricarinatus fed diets with different plant protein sources and ratios. Shannon index (a), Simpson index (b), Venn diagram (c), Ace index (d), Chao1 index (e) and NMDS analysis (f). The box bar represents the mean ± se (n 4). The t test was used to identify the differences among two experimental groups. Statistical significance is indicated by *(P < 0·05). C. quadricarinatus, Cherax quadricarinatus; NMDS, non-metric multidimensional scaling.
Proteobacteria, Firmicutes and Actinobacteriota in crayfish of all the four treatments were the most dominant phyla shown in the relative abundance histogram (Fig. 6(a)). Interestingly, the relative abundance of Actinobacteriota in crayfish existed significant difference among the control and the other three treatments (Fig. 6(a)). LEfSe analysis revealed that CM100 and SC100 contained two microbial biomarkers and one microbial biomarker, respectively (Fig. 6(b)).

Fig. 6. Comparisons of the relative abundance of intestinal microbiota of C. quadricarinatus. Relative abundances of dominant microbial phyla among the four groups (a) and LEfSe analysis for intestinal microbiota of C. quadricarinatus fed diets with FM, SM100, CM100 and SC100 (b). C. quadricarinatus, Cherax quadricarinatus.
The Wilcoxon rank-sum test was used to analyse the abundance of the top 10 genus-level bacteria in the crayfish intestine in all experimental groups, and then the differential bacterial community was displayed (Fig. 7). The sequencing data indicated that the relative abundance of Aeromonas was decreased significantly in SM100 and CM100, and unclassified Enterobacteriaceae and Bacilloplasma were significantly increased compared with FM (P < 0·05) (Fig. 7(a) and (b)). Unclassified Mycoplasmataceae showed a remarkably higher abundance in crayfish fed CM100 than in crayfish fed the control diet (P < 0·05) (Fig. 7(b)). The relative abundance of Staphylococcus was significantly decreased in the SC100 treatment compared with the FM group (P < 0·05) (Fig. 7(c)).

Fig. 7. Wilcoxon rank-sum test of the discrepant abundant genera in the gut microbiota of C. quadricarinatus fed diets with different plant protein sources and ratios. C. quadricarinatus, Cherax quadricarinatus.
A genus-level heatmap is presented in Fig. 8. There were also significant differences among unclassified Mycoplasmataceae, Bacteroidia, Ruminococcaceae, Enterobacteriaceae and Bacilloplasma, as well as Aeromonas and Ralstonia in crayfish among all experimental treatments (P < 0·05).

Fig. 8. Heatmap with the top 50 most abundant genera in microbiota communities in the intestine of C. quadricarinatus fed diets with different plant protein sources and ratios. There was a significant difference between treatments represented by different letters (P < 0·05). C. quadricarinatus, Cherax quadricarinatus.
Functional prediction of the intestinal microbial community
PICRUSt was used to analyse the function of the intestinal microbiota of crayfish fed with diets with different protein sources and rations (Fig. 9). In Kyoto Encyclopedia of Genes and Genomes level 1 analysis, functional genes related to ‘Metabolism’ pathway were the highest in all treatments (Fig. 9(a)). There was no significant difference in any predicted pathway among the FM, SM100, CM100 and SC100 groups (Fig. 9(a)). In the heatmap of KEGG level 2 analysis, the relative abundance of the ‘membrane transport’ pathway was the highest among all predictive functional pathways (Fig. 9(b)). Noticeably, significantly decreased relative abundance was observed in those fed the CM100 diet in the ‘cell motility’ pathway (P < 0·05) (Fig. 9(b)).

Fig. 9. KEGG predicted by PICRUSt. Heatmap of KEGG level 1 (a) and relative abundance in top 10 of KEGG level 2 (b). The data in the violin bar have been transformed via log10. The t test was used to identify the differences among groups. Statistical significance is indicated by *(P < 0·05).
Discussion
Due to the anti-nutritional factors involved in plant products, excessive use of plant protein to replace FM protein was formulated in aquafeed that would inhibit the growth of aquatic animals(Reference Hu, Hu and Wu14). The present study aimed to investigate the effects of replacing FM with SM and CM in the diet of C. quadricarinatus on growth and health. Essential amino acid imbalance is the first limiting factor for FM substitutes with high levels of plant protein, and some of their deficiencies lead to poorer growth(Reference Bulbul, Kader and Asaduzzaman13). The growth performance of crayfish, including parameters such as survival and specific growth rate, decreased significantly in the CM100 and SC100 treatments. The present study supports results from previous observations(Reference Alvarez, Hernández-Llamas and Galindo43–Reference Sun, Tang and Yao45). There are some anti-nutritional factors present in plant protein sources, such as protease inhibitors and lectins contained in SM and gossypols involved in CM, which could affect the growth of aquatic animals. Although the impact of negligible negative effects by blending plant protein with a certain proportion, there is still an adverse influence when FM substitution is at a high level(Reference Jiang, Chen and Qin15). A previous study illustrated that 25 % of FM replaced by a single SM or CM in the diet increased growth performance in terms of weight gain in Macrobrachium nipponense (Reference Huang, Zhang and Fan46). Interestingly, this is similar to the results in the present study, which found that the WG of crayfish in the SC50 treatment was higher than that in the control, but there was no significant difference. Moreover, by using a plant protein mixture as a FM substitution at a low level in the diets of Procambarus clarkii and Eriocheir sinensis, both obtained better weight gain(Reference Tan, Song and Chen12,Reference Luo, Li and Wang16) .
In this study, no remarkable difference was found in the proximate whole-body composition of crayfish in all treatments. Similar results were also published for several aquatic animals, including Lateolabrax japonicus (Reference Li, Ai and Mai47), Cherax quadricarinatus (Reference Muzinic, Thompson and Morris48), Eriocheir sinensis (Reference Jiang, Chen and Qin15) and Litopenaeus vannamei (Reference Yue, Liu and Tian11). The crude protein content of whole-body crayfish decreased with the increase in the plant protein replacement ratio, but there was no significant difference, mainly due to plant protein’s effects on digestion and absorption as well as its low digestibility(Reference Liu, Ye and Wang49). Several previous studies stated that there was no remarkable difference in the amino acid content of crayfish when FM was replaced with SM and brewer’s grains in diets(Reference Muzinic, Thompson and Morris48,Reference Kalhoro, Zhou and Hua51) . However, the difference in our experiment was that the arginine content in crayfish muscle in the CM100 was observably higher than crayfish in the control, which may be attributed to high arginine concentrations in the CM100 diet. From the nutritional value of dietary amino acids, the arginine content of Redclaw crayfish in the SM100 and SC50 treatments also increased remarkably compared with FM.
Generally, digestive enzymes reduce the retention time of feed in the intestine and then decompose it into various nutrients, which are beneficial to digestion and absorption in animals(Reference Kalhoro, Zhou and Hua51,Reference Wang, Yuan and Li52) . As the content of plant protein in the diet increases, anti-nutritional substances can inhibit the activity of digestive enzymes(Reference Fuentes-Quesada, Viana and Rombenso53–Reference Yaghoubi, Mozanzadeh and Marammazi55). Therefore, a decrease in protease and lipase activities was observed in all plant protein replacement treatments. A previous study reported that a similar result found in FM was replaced with a high proportion of plant protein(Reference Dayal, Jannathulla and Ambasankar8). In addition, a study demonstrated that lipase activity was indirectly influenced by glycine concentration in feed(Reference Yaghoubi, Mozanzadeh and Marammazi55). In our experiment, a reduction in the glycine concentration of crayfish muscle was due to the decline in lipase activity caused by dietary CM and SM inclusion. Some studies have suggested that amylase activity in omnivorous animals is elevated with rising dietary plant protein levels(Reference Falcón-Hidalgo, Forrellat-Barrios and Farnés56,Reference Furné, Hidalgo and López57) . In the present study, the amylase activity of Redclaw crayfish fed diets with plant protein inclusion was increased. At the same time, Redclaw crayfish are omnivorous species, and their amylase activity is significantly affected by the dietary plant protein source.
MDA, as an indicator of lipid peroxidation, is often used to determine the presence of oxidative stress in aquatic animals. Anti-nutritional substances in plant protein result in the production of a large amount of reactive oxygen species(Reference Turan and Mahmood58). In the present study, the MDA value was elevated markedly in C. quadricarinatus fed the CM100 and SC100 diets, implying that there is a state of oxidative stress in crayfish. Decreased antioxidant enzyme activity was reported by using high levels of plant protein to replace FM in the diet(Reference Liu, Ye and Wang49,Reference Ray, Liang and Yang59) . However, the activities of SOD and GPx in CM100 were observed to be remarkably higher than crayfish in the control, and the activities of the two enzymes also showed an upwards trend in SM100. Meanwhile, there is also a similarly increased activity of antioxidant enzymes in crayfish fed diets with plant protein replacing FM(Reference Yun, Shahkar and Hamidoghli60,Reference Xie, Liu and Zeng61) . The MDA results suggest that the increase in the activity of antioxidant enzymes is due to the elimination of reactive oxygen species generated by anti-nutritional factors(Reference Takahashi and Cohen62). Glucose concentrations, as a stress indicator, increased significantly in the CM100 treatment, indicating the presence of a state of stress in crayfish in CM100 (Reference Iwama63). With damage to the hepatopancreas, the levels of ALT and AST in the serum, as indicators of hepatopancreas injury, were increased(Reference Meng, Chen and Guan64). In this experiment, the ALT activity increased significantly in crayfish fed a diet with FM totally replaced by CM. Damage to the hepatopancreas might influence ALT and AST activities which finally affect growth(Reference Kalhoro, Zhou and Hua51).
The level of nutrients absorbed by animals is determined by their normal histological structure(Reference McGuckin, Lindén and Sutton65). Distributed epithelial cells in the intestinal folds play an important role in absorbing nutrients and resisting pathogenic bacteria(Reference Faggio, Torre and Pelle66). Meanwhile, in the normal histological structure, the intestinal peritrophic membrane is able to protect epithelial cells and improve digestion ability because of its tightly surrounded epithelial cells(Reference Dinglasan, Devenport and Florens67). In the present study, part of the intestinal peritrophic membrane of crayfish fed 100 % SM- or CM-supplemented diets appeared to be slightly separate from the intestinal folds, suggesting that epithelial cells are at risk for damage. Similarly, a previous study found that Totoaba macdonaldi fed with SM inclusion content of more than 22 % of the diet developed enteritis and intestinal fold atrophy, resulting in lower growth performance and digestive enzyme activity(Reference Fuentes-Quesada, Viana and Rombenso53). Because of this, the main reason for the growth restriction of crayfish fed a totally CM-supplemented diet may be that the intestinal epithelial cells of CM100 were injured.
The intestinal microbiota is well known to play a vital function in digestion and immune response, and it is able to regulate numerous metabolic reactions in animals(Reference Wang, Ran and Ringø68). Some studies have proven that the composition and structure of gut microbiota are influenced by feed ingredient composition(Reference Catalán, Villasante and Wacyk69,Reference Qiao, Liu and Sun70) . Actinobacteriota is well known as a probiotic used to improve disease resistance in aquatic animals(Reference Das, Ward and Burke71). According to this experiment, the relative abundance of Actinobacteriota, as the dominant phylum, was found to decrease in plant protein-supplemented diets. The microbiota with a low level of abundant Actinobacteriota in crayfish fed the SM100, CM100 and SC100 diets demonstrated a reduction in beneficial bacteria and low disease resistance compared with the control. A higher relative abundance of Candidatus Bacilloplasma and Unclassified Enterobacteriaceae was observed in crayfish fed diets with pure CM as a total replacement of FM, and a higher relative abundance of Aeromonas was found in the SC100 group. However, Candidatus Bacilloplasma and Aeromonas are considered common opportunistic pathogens in Pacific white shrimp, for example, resulting in gastritis(Reference Chen, Shen and Yeh72,Reference Hou, Huang and Zeng73) . Proteobacteria was a potential diagnostic criterion for disease, and the increase of relative abundance may result in poorer growth. Relative research has indicated that a higher relative abundance of Enterobacteriaceae in shrimp leads to lower growth performance and a higher risk of disease(Reference Shin, Whon and Bae74). This seems to explain the lower growth performance and higher relative abundance of pathogenic bacteria in the SM100, CM100 and SC100 groups than in the FM group.
At the genus level, the relative abundance of Candidatus Bacilloplasma and Unclassified Enterobacteriaceae was elevated significantly in crayfish fed the SM100 and CM100 diets. Enterobacteriaceae were isolated from fish in an insalubrious environment by researchers, which indicated that Enterobacteriaceae are potential pathogens and that humans are also at risk of infection after consumption(Reference Yagoub75,Reference Sivakami, Premkishore and Chandran76) . Further studies indicated that Enterobacteriaceae are environmental causative agents of human mastitis(Reference Puppel, Kalińska and Kot77). As a result, Redclaw crayfish are cultured in 100 % CM and SM treatment groups, which not only affects their health status but also poses a risk of disease after human consumption. Several previous studies have shown that Ralstonia, such as Ralstonia solanacearum and Ralstonia eutropha, are pathogenic bacteria in crops(Reference Garg, Yindeeyoungyeon and Gilis78,Reference Yamada, Kawasaki and Nagata79) . However, in consideration of plant protein supplementation in diets, the increased relative abundance of Ralstonia may be related to the use of plant ingredients in our formulation. The present study revealed a positive correlation between the structure and predicted function of gut bacteria. The secondary metabolic pathways are mainly enriched in carbohydrate metabolism, amino acid metabolism, energy metabolism and metabolism of cofactors and vitamins. The experimental diets contain plant-based proteins that regulate carbohydrate metabolism and promote the production of compounds related to cellulose and hemicellulose degradation(Reference Toledo, Gutiérrez and Siles80,Reference López-González, Suárez-Estrella and Vargas-García81) . The decomposition of amino acids and cellulose produces a source of carbon and energy that could be utilised by bacteria. The relative abundance of amino acid metabolism and carbohydrate metabolism increased in the FM and SC100, which significantly facilitated the relative abundance of cell motility.
Conclusion
Among the mixed replacement treatments, the activities of pepsin, lipase and amylase in crayfish fed the SC50 diet were higher than those in crayfish fed the control diet, and the growth performance and arginine content were also higher than those in the control. However, containing a high proportion of CM and SM in the diet not only restricts the growth but also influences the health of C. quadricarinatus. Therefore, this study concluded that half of the dietary FM can be replaced with a composite mixture of SM and CM (protein content ratio = 1:1) without influencing the growth performance and physiological health of C. quadricarinatus.
Acknowledgements
This work was supported by grants from the National Key R & D Program of China (2018YFD0901305) and the initial fund from Hainan University for R&D (KYQD(ZR)1924). Meanwhlie, thanks to all authors for their contributions.
The authors’ contributions are as follows: C. X., E. L. and Y. J. conceived the experiment; Z. J. and D. Q. conducted the experiments and statistical analysis; Z. L. formulated the experimental diets; Z. J. and C. X wrote and revised the manuscript; E. L. and Y. J. conducted polish work of this manuscript. All authors contributed, read and approved the final manuscript.
No potential conflict of interest.


