


Introduction
For all sorts of military and civilian safety and security applications it is interesting to use radar to track individuals moving over ground. Radar provides an all-weather and day and night capability to detect and track objects. However, it generally lacks the capability to present human interpretable images of tracked objects. Therefore, there is a great interest in automatic classification of radar targets. An interesting source of signature information is micro-Doppler (μ-D) which, in this case, captures the movements of body parts as function of time. μ-D is an interesting source of information because it can be obtained without imposing technological requirements on the radar's bandwidth. By adapting the time-on-target and measuring the μ-D signal of ground moving targets it is possible to classify moving personnel based on the most relevant and unique form of human motion, their human gait. Human gait classification based on μ-D has attracted the interest of many researchers. Non-machine learning approaches were used in [Reference Groot, Harmanny, Driessen and Yarovoy1, Reference Fioranelli, Ritchie, Gürbüz and Griffiths2] proposing a particle filter method and handcrafted features, respectively. In [Reference Kim and Ling3, Reference Seifert, Schäfer, Zoubir and Amin4] machine learning approaches were used to solve gait classification problems such as activity and walking style classification. Deep learning-based methods have gained popularity in several fields, including radar. In [Reference Kim and Moon5, Reference Trommel, Harmanny, Cifola and Driessen6] deep convolutional neural networks (DCNNs) were used to deal with challenging problems such as personnel recognition based on multistatic μ-D and multi-target human gait classification revealing the potential of such networks. In [Reference Cao, Xia, Ye, Zhang and Zhou7, Reference Abdulatif, Aziz, Armanious, Kleiner, Yang and Schneider8] DCNNs were used successfully for person identification based on human gait K-band μ-D measurements revealing the potential of DCNNs for human identification. However, identification accuracy of above 89% was achieved for less than 10 subjects in [Reference Cao, Xia, Ye, Zhang and Zhou7] and 98% in [Reference Abdulatif, Aziz, Armanious, Kleiner, Yang and Schneider8] considering that the subjects were walking on a treadmill.
This study explores the potential of data-driven methods that take into consideration the personal traits of individuals. The aim is to classify personnel on an individual basis by assuming that there are machine observable differences between the gait of different persons. These differences originate from variations in body dimensions, reflective wearables, and the locomotion timing between the different body parts observable in their μ-D return. The inputs considered for this method are human gait spectrograms which can be fed to image-based deep neural networks (DNNs). The spectrogram representation is a time−frequency response obtained by several consecutive Doppler measurements. The spectrogram is computed by applying short time Fourier transform (STFT) to coherent radar measurements with sufficient sampling rate, which are then stitched together to form an image. In previous study, personnel identification was performed using an X- band radar and a CNN network and achieved a classification accuracy of 93.5% for a population of 22 individuals [Reference Papanastasiou, Trommel, Harmanny and Yarovoy9]. However, this leads to the question how many individuals a deep learning model can correctly classify while still maintaining competitive classification accuracies. Another question that arises is whether the features learnt from a classification problem are transferrable from one set of individuals to another and whether they can be utilized for a different classification task. Also, it is worthwhile to further investigate whether the deep learning models attend to areas of the spectrogram which are relevant for the classification decision and learn to become invariant to the background noise that makes up a large part of the spectrogram.
This study extends and improves the study undertaken in [Reference Papanastasiou, Trommel, Harmanny and Yarovoy9] by the following contributions. The dataset diversity and size has been enlarged by increasing the number of individuals from 22 to 39. This study investigates the classification performance attainable and the efficacy of transfer learning by training two VGG-16-based models. The features used by the models for classification are also visualized in the pixel space, which will reveal that the networks partly base their output on background noise. To mitigate this, a convolutional block attention model (CBAM) [Reference Woo, Park, Lee and Kweon10] is incorporated to guide the network towards attending the relevant parts of the spectrogram, which increases both performance and interpretability of the classification output.
The section on “Methodology” describes the data-acquisition process, the VGG-16 network details and the CBAM architecture. The next section presents the experimental results obtained and conclusions are summarized in the final section.
Methodology
Radar system and experimental set-up
A human gait μ-D dataset has been collected to complement the first measurement campaign employed in [Reference Papanastasiou, Trommel, Harmanny and Yarovoy9]. The second measurement campaign employed the same 10 GHz (X-band) continuous wave (CW) monostatic radar and contains samples of completely different individuals to those present in the first dataset. The combination of both datasets provides a larger and more complex dataset to that employed in [Reference Papanastasiou, Trommel, Harmanny and Yarovoy9]. In both experiments, the test subjects walked along the line of sight of the radar system in both inbound and outbound direction three consecutive times. Data from 22 individuals, 16 male and 6 female, was collected in the first measurements campaign and from 17 individuals, 8 males and 9 females, in the second measurement campaign, with subject heights varying between 1.55and 2.07 m.
Data acquisition and pre-processing
The resulting baseband IQ Doppler signals obtained from each test subject are sampled at 16 kHz. They are pre-processed in the following way. First, the IQ imbalance present in the signal due to calibration flaws is reduced by correcting the magnitude and phase. Signals are decimated to 2 kHz and spectrograms for each target are obtained by performing the STFT with a Hanning window of 128 samples and 90% overlap to produce spectrograms of size 128 Doppler bins × 192 time bins, corresponding to an observation time of 1.25 s. The number of spectrograms obtained from each class varied due to differences in stride length and walking speed between persons. Differences between spectrograms were spotted by computing statistical indicators. For this reason, normalization was performed independently for each spectrogram, resulting in power values between 0 and 1, while still preserving a clear μ-D signature even if spectrograms are normalized with different linear transformations. The normalization technique employed ensures spectrogram values span throughout the entire input range of values, improving convergence and contributing towards making the classification invariant to fluctuations in the power values of the returned signal. Furthermore, the pre-processing applied in [Reference Papanastasiou, Trommel, Harmanny and Yarovoy9] employed a narrow-band high-pass filter to remove static clutter and a low-pass filter to extract the bandwidth of interest. After evaluating the pre-processing applied, a design choice was made to disregard the narrow-band and high-pass filter in the second measurement campaign dataset to avoid complexity and unnecessary pre-processing steps. This resulted in some subtle differences in the background noise of spectrograms belonging to different measurement campaigns, but it does not affect the μ-D signature of interest.
CNN model set-up
The same VGG-16 network architecture as [Reference Papanastasiou, Trommel, Harmanny and Yarovoy9] was used, comprised by a layer concatenation of 2D-convolutional, maxpooling 2D and ReLU activations for the feature extraction process, followed by two dense layers with ReLU activations, Dropout and L2 regularization and a final classification layer with softmax activation. Two different models were trained and evaluated in order to investigate both the ability to handle more classes and the efficacy of transfer learning:
1. Model A: randomly initialized VGG-16.
2. Model B: VGG-16 initialized as the final model from [Reference Papanastasiou, Trommel, Harmanny and Yarovoy9].
Some hyper-parameters were shared between both models such as number of epochs, batch size, optimizer and loss functions. From the overall data 80% and 20% were used as train and test data from each target class, respectively.
Convolutional block attention module
In Fig. 1 the Grad-CAM [Reference Selvaraju, Das, Vedantam, Cogswell, Parikh and Batra11] visualization of model A is shown. The heat map produced highlights the regions of the image relevant for the classification of a random input class. The lower part of the image correctly highlights the μ-D oscillations related to the movement of the target's limbs. However, above the target's signature the background noise is highlighted revealing the background noise contributes towards the classification decision. This behaviour was observed for various target classes in both VGG-16 networks, independently from the parameters used or the training method. An attention algorithm is implemented as means to identify and highlight the relevant, salient regions of an image and suppress irrelevant clutter or background noise that could wrongly influence the classification decision. Furthermore, 2D convolution is a local operation performed in different regions of the image, where for instance in a 3 × 3 convolution only 9 pixels will determine the value of the output pixel, which means only local information will be used to determine the value of the destination pixel. This can add a bias since global structures such as temporal relationships are not taken into account. This effect can be minimized by using larger convolutional filters or deeper networks. Attention algorithms leverage this problem by introducing weighted channel attention.

Fig. 1. CBAM module. A spectrogram is fed into a 2D convolutional layer and outputs a {HxWxC} feature map, where both channel attention and spatial attention are performed. Lower left: Grad-CAM visualization [Reference Selvaraju, Das, Vedantam, Cogswell, Parikh and Batra11] of model I without CBAM.
Many variations of attention algorithms [Reference Vaswani, Shazeer, Parmar, Uszkoreit, Jones, Gomez, Kaiser and Polosukhin12] have been applied for Natural Language Processing and image captioning. This study implements the CBAM [Reference Woo, Park, Lee and Kweon10] into the VGG-16 network after each convolutional layer. CBAM has reportedly worked better than other attention mechanisms because it refines along both the channel (C) and spatial dimension (H and W). The CBAM module is depicted in Fig. 1. Each convolutional filter highlights different features of the image, for instance some filters will focus on the μ-D oscillation of the target's limbs while others will focus on the background noise, which is undesirable. Channel attention provides a weight for the convolutional filter that best captures the features present in the input spectrogram. Spatial attention performs the attention mechanism on the feature map dimension, therefore it will generate a mask that enhances the features of the spectrograms which are relevant to the features of a given class. Overall, the output of the CBAM will produce a weighted feature map tensor which will serve as input to the following convolutional layer, improving classification performance.
Experimental results
Training and classification results
Both models outlined above were trained with an NVIDIA GeForce GTX TITAN-X GPU. The total data collected is split into a training set and a test set. In the study of [Reference Papanastasiou, Trommel, Harmanny and Yarovoy9] 88% of the overall data was used for training and 12% was used for test. In this study a less favourable split was employed, using 80% of the data for training and 20% for testing. The classifier was trained for 300 epochs using Adam optimizer with initial learning rate of 10−5, learning rate decay equal to 10−6 and batches of 32 spectrograms.
Test results for models A and B are shown in Fig. 2, model A achieves 83.6% accuracy while model B achieves 88.4% accuracy on a total of 39 classes. Although classification accuracies obtained are slightly below the benchmark achieved in [Reference Papanastasiou, Trommel, Harmanny and Yarovoy9] where they reportedly obtained 93.5% classification accuracy for 22 persons, in this study competitive classification accuracies are obtained for 17 additional classes. Furthermore, this experiment employs a less favourable train and test split meaning the dataset employed for testing the network is larger than that employed in [Reference Papanastasiou, Trommel, Harmanny and Yarovoy9] and thus the network is more robust against spectrograms never seen before.

Fig. 2. Confusion matrices for model A (left) and model B (right).
Figure 2 reveals a slight area of misclassification contained in the upper and lower bounds parting from the predicted label 22. Targets 1–22 and 23–39 correspond to measurement campaigns one and two, respectively, it means it is more likely that the network will perform a misclassification on spectrograms from each measurement campaign due to differences in the pre-processing outlined in the next sub-section. The effect of the spectrogram background on the classification decision is mitigated with the CBAM module.
Feature visualization
The penultimate layer of the VGG-16 prior to the softmax activation contains all the relevant features for the classification task. Once the network was trained the features in this layer were visualized using t-SNE as depicted in Fig. 3 for both models A and B. As shown in Fig. 3 in model A the network fails to distinguish between certain classes, such as target features belonging to targets 24, 26, 28, 29, 30. However in model B classification accuracies significantly improve and the network achieves to correctly distinguish class features in separate clusters as seen in Fig. 3. Features belonging to targets that were unidentifiable in model A are now correctly classified in model B, proving that target classification with a VGG-16 network for a large number of individuals can be performed. The results obtained confirm that features from a given class of individuals can be employed to perform classification via transfer learning with a completely different set of individuals since the features extracted by the VGG-16 network are transferrable from one set of individuals to another.
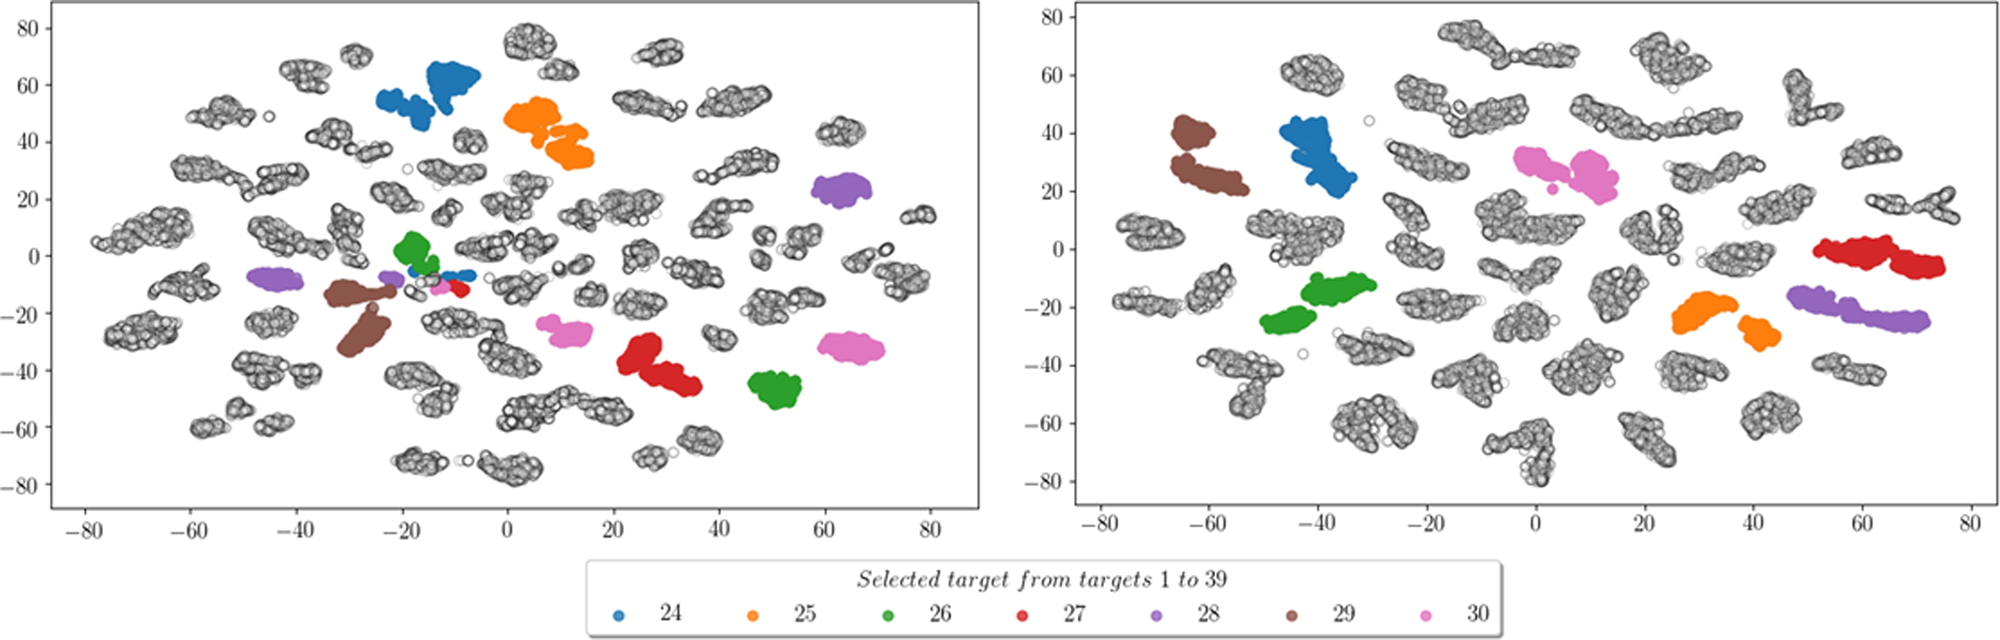
Fig. 3. 2D t-SNE visualization of model A (left) and model B (right).
CBAM results
The CBAM module was trained with an NVIDIA GeForce GTX TITAN-X GPU for 800 epochs using Adam optimizer with initial learning rate of 10−5. The effectiveness of the CBAM module is shown in Fig. 4 revealing how the VGG-16 network combined with the attention module outperforms the baseline models A and B. Higher classification accuracies were obtained for the network combined with the attention layer, providing a classification accuracy of 93%. Visualization of the internal layers are depicted in Fig. 5 showing a class saliency map. The network can capture the relevant features in the spectrogram and learns to solely focus on regions of the image containing μ-D signatures.
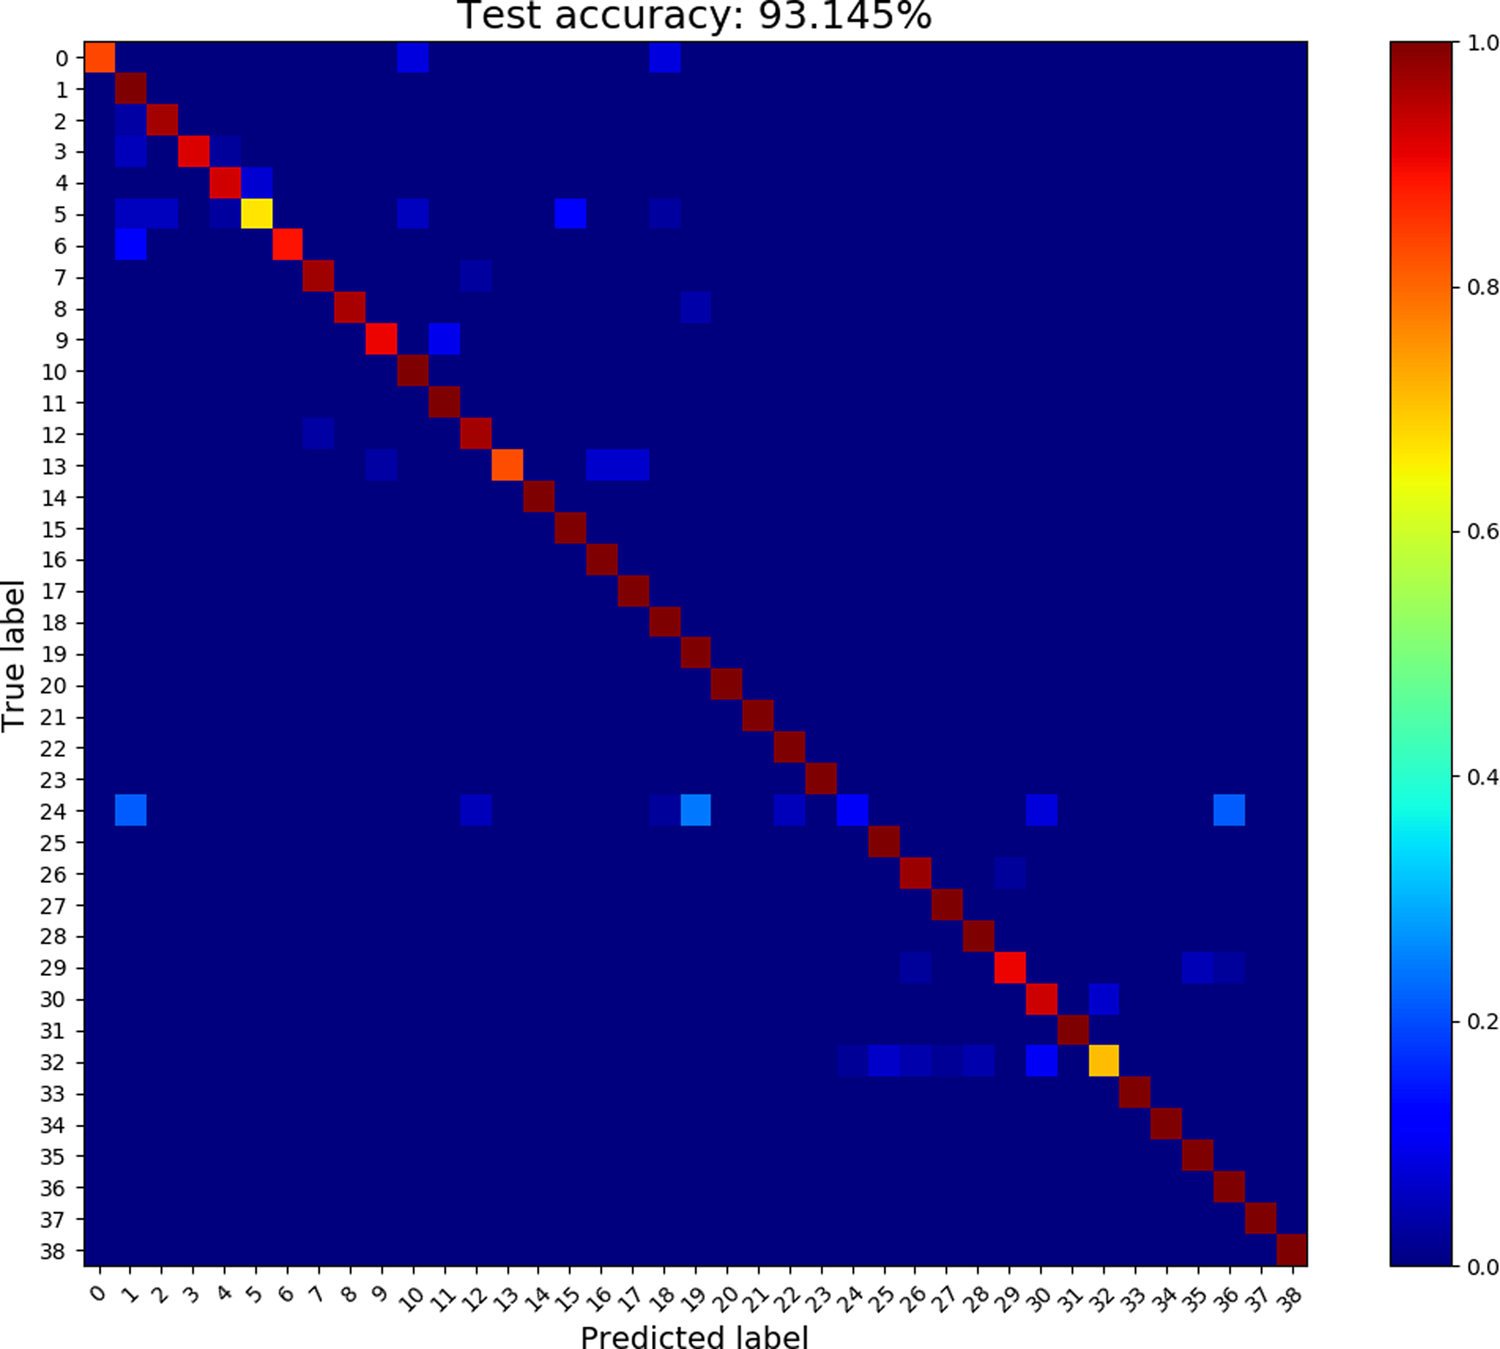
Fig. 4. CBAM confusion matrix.
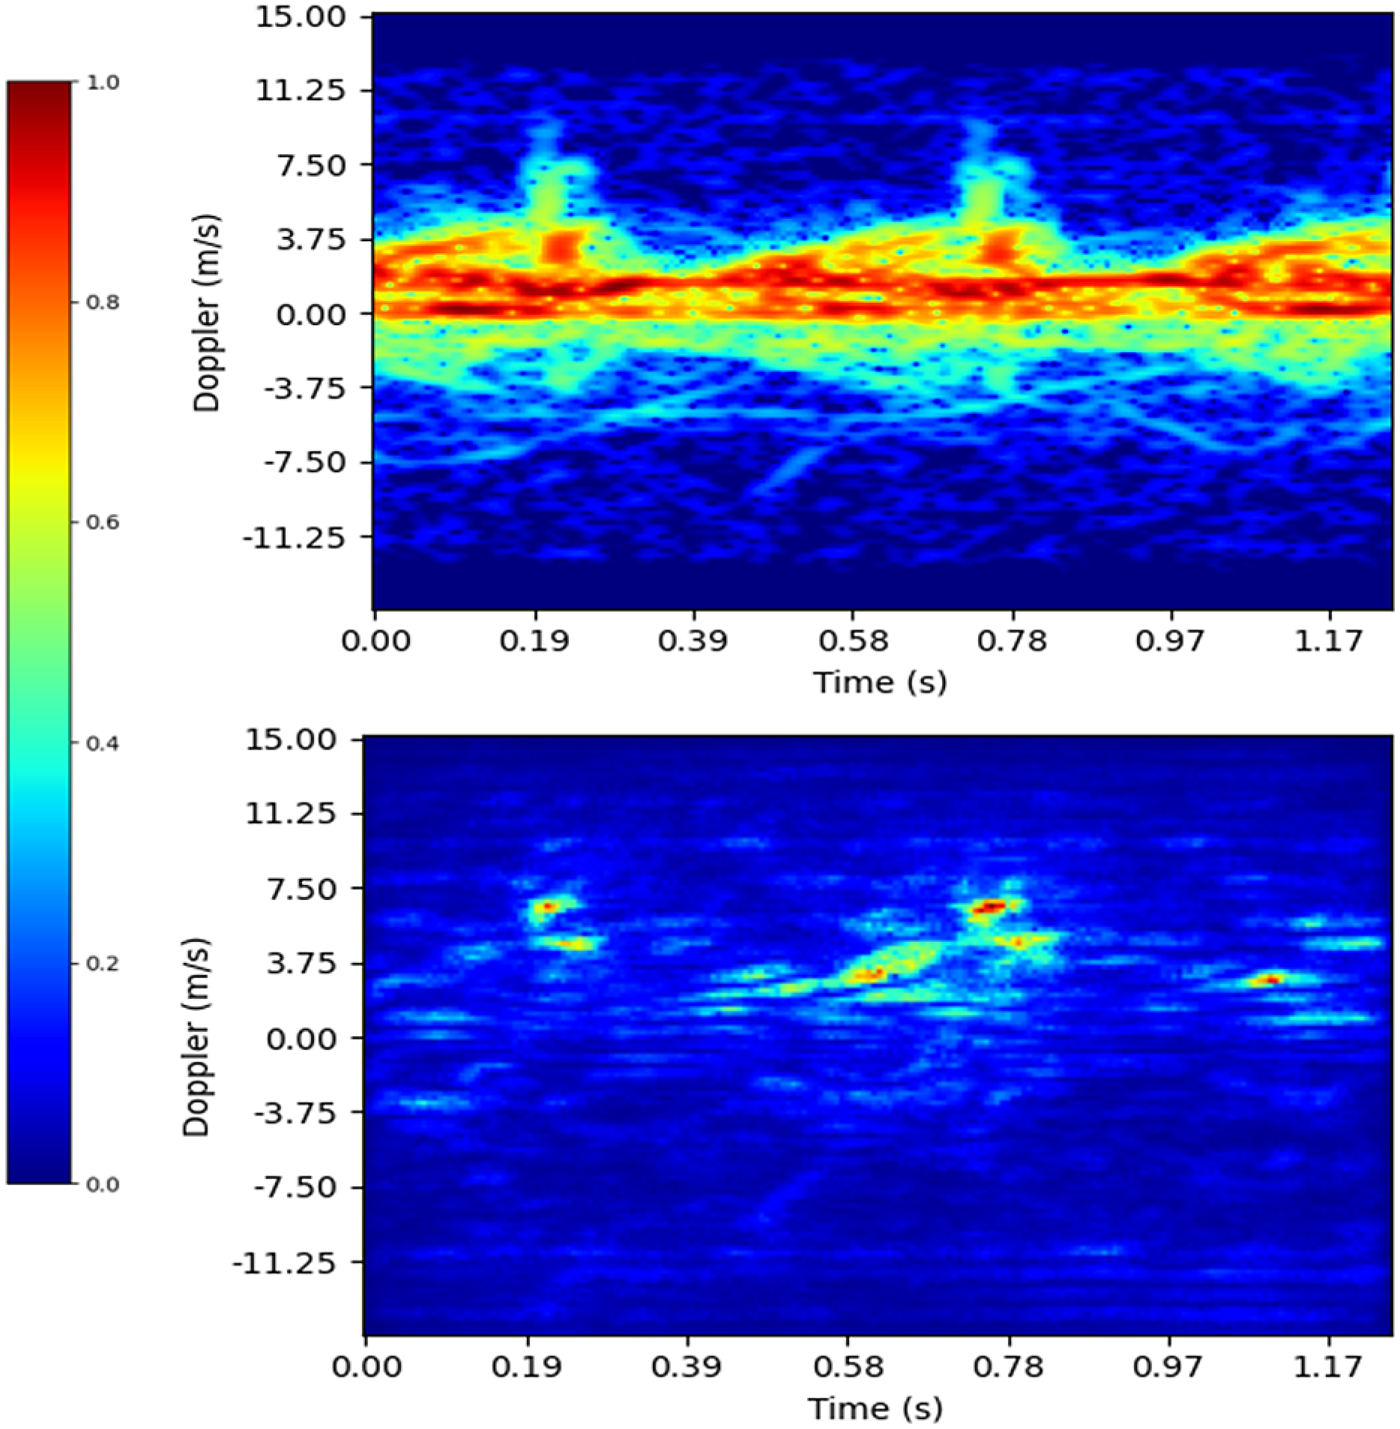
Fig. 5. Upper: Input spectrogram. Lower saliency map.
Attention algorithms are of particular interest for radar applications since they are extremely useful when applied to input images containing mostly noise, where the signature of interest is only present in a small region of the image. However, the addition of an attention layer increases the network complexity, number of parameters and requires a larger computational cost to reach convergence.
Conclusion
This study expands the work undertaken in [Reference Papanastasiou, Trommel, Harmanny and Yarovoy9] by using the VGG-16 network to identify a larger and more complex group of 39 individuals. We showed that these individuals can be identified with up to 88.4% accuracy. Transfer learning provides an important accuracy boost compared to training the network with random weight initialization however in both cases the networks tend to consider noise as an important part of the input. We demonstrated that CBAM [Reference Woo, Park, Lee and Kweon10] mitigate this tendency and increase the network performance achieving the same classification accuracy obtained in [Reference Papanastasiou, Trommel, Harmanny and Yarovoy9] with 17 additional classes.
 Hannah Garcia Doherty received her MEng (First Class Honours) degree in aeronautical engineering in 2019 from the University of Glasgow. She joined Thales Netherland BV in 2019 where she holds her current position as an advanced development engineer.
 Roberto Arnaiz Burgueño received his Bachelor's degree in industrial electronics and automation engineering from the University of Oviedo in 2019, where he is currently undertaking his Master's degree in automation engineering and industrial informatics. At present he is completing his master's thesis at Thales Nederland BV, investigating the applications of semi-supervised learning for radar applications. His main interests are signal processing and deep learning.
 Roeland P. Trommel received his MSc degree in electrical engineering from the Delft University of Technology in 2016. Since then he has been working at Thales Nederland BV as an advanced development engineer. His main research interests are machine learning, radar signal processing and classification.
 Vasileios Papanastasiou received his MEng in computer engineering and informatics from the University of Patras, Greece and his MSc in electrical engineering from the Delft University of Technology. His fields of interest include image and signal processing and artificial intelligence. Previously he worked as a research intern at Thales Netherland working on classification of micro-Doppler signals using deep learning, and as a software engineer for the Greek army. Currently he holds the position of Deep Learning Software Test Engineering at The MathWorks.
 Ronny I. A. Harmanny received his M.Sc. (Hons) in computer science in 2000 from the University of Twente. In that year he joined Thales Nederland BV as a radar system designer. After a few years of engineering, the work shifted towards R&D and since then he conducted several innovative radar projects and studies. He currently holds the position of team leader of the Advanced Development department in Delft.


 Open access