


INTRODUCTION
Background and importance
Within several Canadian jurisdictions there is a trend towards utilizing a primary pre-hospital triage system within emergency departments (EDs) during mass causality incidents (MCIs). The Centre for Excellence in Emergency Preparedness has reported on this trend,Reference Bezanson and Kollek 1 Footnote * and in the province of Alberta, the Simple Triage and Rapid Treatment (START) triage tool is commonly incorporated within the disaster plans of many hospitals. This approach is believed to create a common language and facilitate bidirectional communication between first responders, medical transport teams, and hospital staff.Reference Lerner, Schwartz and Coule 2 It has also been suggested by some disaster planners that the use of a primary pre-hospital triage system in the ED during an overwhelming MCI could more efficiently categorize patients compared to a computerized version of Canadian Triage and Acuity Scale (cCTAS).
Presently, it is unclear if using a primary triage tool in an ED setting is appropriate since no primary pre-hospital triage systems are universally accepted, well validated, or reliableReference Lerner, Schwartz and Coule 2 , Reference Jenkins, McCarthy and Sauer 3 for use in the pre-hospital setting, let alone in an ED environment. There is no formal research that examines the use of already institutionalized triage systems, such as the one that operates in our EDs, for the purpose of MCI triage. This lack of literature is surprising as ED triage systems, such as the CTAS, the Australian Triage Score, the Manchester Triage Score, or the Emergency Severity Index, are already highly integrated into ED culture throughout the world.Reference Farrohknia, Castrén and Ehrenberg 4 Given the well-established reliability,Reference Fernandes, McLeod and Krause 5 , Reference Dallaire, Poitras and Aubin 6 validity,Reference Gravel, Manzano and Arsenault 7 - Reference Lee, Oh and Peck 9 and universal subscribership to the CTAS triage instrument within Canadian EDs, it would be appropriate to examine its use as a MCI triage tool in the ED context.
Within Alberta, many hospitals will switch to START triage in the ED during a MCI. The focus for this pilot study was to conduct a preliminary examination of MCI triage in an ED setting by comparing the normal triage practice within an urban Canadian ED against the START primary pre-hospital triage tool.
Goals of this investigation
The outcomes of the study compared the time to triage and the accuracy of ED triage nurses using a computerized version of CTAS (cCTAS) versus START for a simulated MCI population in an ED setting. Given the substantial differences between CTAS and START, this experiment was also conducted to test the feasibility of such a study with particular focus on questionnaire development and methodology.
METHODS
Study design and setting
This was a prospective pilot study that used a convenience sample of nurses who were assigned on an alternating basis to either the cCTAS or the START arm. The study compared ED triage nurses’ time to triage and their accuracy when sorting a simulated MCI population in the ED when utilizing the cCTAS and START algorithms. The study was conducted in the teaching facility of the ED in Rockyview General Hospital (RGH) in Calgary, Alberta. Calgary is a city of ~1 million people, which has a Level 1 trauma center, a pediatric center, and three peripheral hospitals of which RGH is one.
Selection of participants
Participants were sampled by recruiting 20 active triage nurses from morning ED shifts on five non-consecutive days over a two-week period in the RGH ED. The participants were volunteer recruits and were asked to partake in the study by personal invitation that included a brief explanation of the study design and purpose. Twenty-two nurses were invited to participate in the study and two declined. The selection criteria included being CTAS trained and currently acting as a triage nurse. No incentives were offered to partake in the study and participant consent was obtained. Participants were instructed not to discuss the experiment with colleagues. By alternating, subsequent participants were funnelled into an arm of the study. The data collection process was conducted in an anonymous fashion whereby participants were assigned a non-identifying code to track data and no personal information was collected.
Methods and measurements
As there was no existing data in the literature detailing the mean and standard deviation of time required for nurses to assign triage scores using CTAS, no accurate power calculation could be performed, and the pilot sample size of 20 was selected for convenience.
The assessment tool was a questionnaire that contained four quantitative questions about the triage nurse’s prior experience with disaster events and training. In addition, there were nine vignettes that created the simulated patient population with a mixture of six MCI and three non-MCI patients (Appendix A: Assessment Tool). As the setting for this simulation was the ED, a combined MCI and non-MCI patient population was believed to represent the mixture of patients that could present to the ED during a true event. Each vignette included a brief history, vital signs, and physical examination findings that could be ascertained by observation of the patient. Vignettes were based upon real MCI patient cases found within the www.disastermed.ca database and constructed such that it was possible to arrive at a definitive triage score with either the cCTAS or START tools. The same questionnaire was administered to all 20 participants, 10 used the cCTAS triage tool and the other 10 used the paper-based START triage tool. All study participants were offered a period of time to review the instructions, to trial a practice case with their triage method, and to ask any questions before commencing with the administration of the questionnaire.
Three experts from the National CTAS Working Group and the Alberta Health Services Emergency/Disaster Management or Emergency Medical Services Teams were asked to assign triage scores to each vignette for the cCTAS and START systems, respectively. Paramedics, nurses, and physicians where included in the expert groups. An iterative, blinded method was used to arrive at consensus on the wording of the vignettes and to create a standard triage score from which to compare the study participants.
Participants assigned to the START arm of the study were given a standard paper version of the START algorithm (this version included both capillary refill and radial pulse). Individuals in the cCTAS arm of the study used the Sunrise Emergency Management software (SEMS), a computer guided tool that assists with the assignment of a CTAS designation. This software is utilized in the major urban EDs across Alberta. This software required a number of fields to be populated before a triage code could be assigned. This included highlighting fields using a computer mouse. In addition, the vital signs and two free-form typing fields—presenting and past medical histories—had to be populated using a keyboard. Neither arm of the trial received any formal training relating to the triage systems from the experimenter.
Outcomes
Two outcomes were measured: 1) the triage designation that was assigned by the study participants, and 2) the amount of time it took to arrive at these designations. The study participants recorded the triage designation directly underneath the vignette. The time it took for a participant to decide upon a triage designation was determined by monitoring the period of time from when the participant turned the page to start reading the vignette up to the point where the page was turned to start the next vignette. Participants were unable to return to a previously completed vignette. A single researcher (GC) collected all time measurements using an electronic watch.
Analysis
The Fleiss methodReference Fleiss 10 was used to examine the intra-rater correlation between the three experts assigning triage scores for each triage method. Twenty triage nurses partook in the study, each triaging nine simulated patients. Since the results for each triaged patient were not independent (each triage nurse triaged nine patients), the response variable of mean triage time per patient for each triage nurse (total triage nurse time divided by nine) was evaluated using linear regression with six predictors. These predictors included triage method used, whether participant partook in the practice session prior to testing, years of experience as a triage nurse, attendance at previous disaster events, previous disaster training, and previous START training. Accuracy of triage was assessed using Pearson chi-squared test with Yates continuity correction. The validity of using linear regression was assessed by examination of the normal quantile plot of residuals and by using the one-sample Kolmogorov-Smirnov test. Mean, median, range, and confidence interval where reported where applicable. All statistical calculations and graphics were prepared by a second researcher (JF) using R, which is a language and environment for statistical software version 2.15.0 (R Foundation for Statistical Computing, Vienna, Austria). Tables were prepared using Microsoft Excel version 12.3.6 for Mac (Microsoft Corporation WA, USA). The University of Calgary Conjoint Health Research Ethics Board granted approval for this study (REB13-0645).
RESULTS
Participant characteristics
The characteristics of the study participants are shown in Table 1.
Table 1 Study participant characteristics
CTAS=Canadian Triage and Acuity Score; START=Simple Treatment And Rapid Triage.
Expert consensus
The intra-rater reliability for the CTAS group was 0.80 and for the START group it was 0.89 as assessed by the Fleiss method.
Time to triage
The mean triage time for a cCTAS was 138 seconds/patient (median 138 seconds/patient, range 73-247 seconds/patient). For START the mean triage time was 33 seconds/patient (median 29 seconds/patient, range 10-95 seconds/patient) (Figure 1). START triage was significantly faster overall; the effect size in the linear regression due to triage method was 108 seconds/patient (95% CI 83-134 seconds/patient). None of the other predictors were found to be significant (Table 2). The normal quantile plot of residuals shows mild deviation from normality for three of the CTAS raters (Figure 2). However, as the one-sample Kolmogorov-Smirnov test showed no statistically significant variation of the errors from the normal distribution (D=0.11854, p=0.91), the normality of errors for the model was judged to be adequate for the present study.
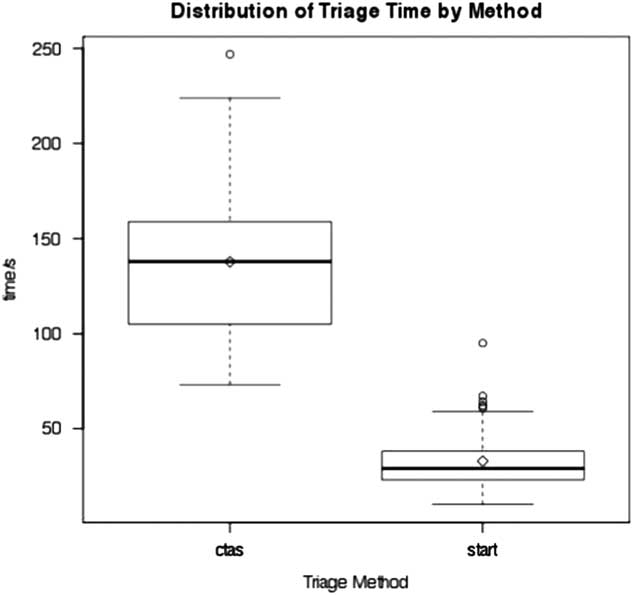
Figure 1 Box plot of triage time for CTAS and START groups; box, quartiles; horizontal line in box, median; whiskers, maximum and minimum; circles, outliers. CTAS = Canadian Triage and Acuity Score; START = Simple Treatment And Rapid Triage.
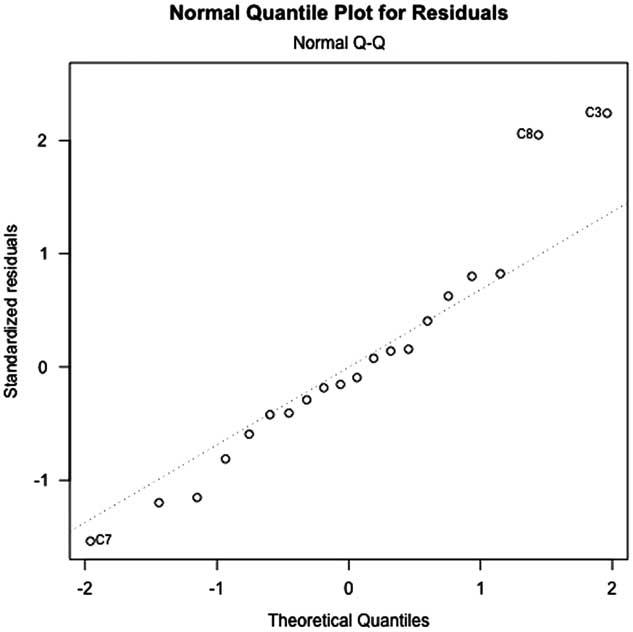
Figure 2 The normal quantile plot of residuals for mean triage time of CTAS and START participants. CTAS = Canadian Triage and Acuity Score; START = Simple Treatment And Rapid Triage.
Table 2 The effect size as a function of study predictors
CTAS=Canadian Triage and Acuity Score; START=Simple Treatment And Rapid Triage.
Triage accuracy
The triage accuracy for the cCTAS and START tools were 70/90 (77.8%) and 65/90 (72.2%), respectively (Table 3). A difference of 6% (95% CI −19-8%) was observed. The mean participant score was 7/9 (median 7, range 6-9) and 6.5/9 (median 7, range 4-8) for cCTAS and START, respectively. The over-triage rates where 16/90 (17.8%) and 15/90 (16.7%), while the under-triage rates where 4/90 (4.4%) and 10/90 (11.1%) for the CTAS and START algorithms, respectively (Table 4 and 5).
Table 3 Comparison of CTAS and START performance
CTAS=Canadian Triage and Acuity Score; START=Simple Treatment And Rapid Triage.
a Participant scores are out of 9.
Table 4 Expert consensus score versus triage nurse assigned score for CTAS (N=90)Footnote *
CTAS=Canadian Triage and Acuity Score.
* Triage nurse and expert scores are on the vertical and horizontal axes, respectively. The numbers inside the brackets indicate the number of cases that were classified as a particular CTAS level by the expert panel. The bold numbers are the correct triage scores as determined by expert consensus, where the numbers above represent under-triage and below over-triage. For example, the experts classified 2 of the 9 cases as CTAS 2. Ten triage nurses evaluated these two cases and 18 classified the cases as CTAS 2, while 2 classified as CTAS 3. Under-triage occurred in two triage scores.
Table 5 Expert consensus score versus triage nurse assigned score for START (N=90)Footnote *
START=Simple Triage and Rapid Treatment.
* Triage nurse and expert scores are on the vertical and horizontal axes, respectively. The numbers inside the brackets indicate the number of cases that were classified as a particular START level by the expert panel. The bold numbers are the correct triage scores as determined by expert consensus, where the numbers above represent under-triage and below over-triage. For example, the experts classified 3 of the 9 cases as yellow. Ten triage nurses evaluated these three cases and 17 classified the cases as yellow, while 11 classified as red and 2 as green. Over-triage occurred in 11 triage scores and under-triage 2 triage scores.
Typing Time
Post-hoc analysis indicated that the time taken for typing formed a significant part of the difference between the cCTAS and START methodology. The mean typing time for a CTAS case was 60 seconds/patient (median 57 seconds, range 0-139 seconds/patient).
DISCUSSION
The objective for this experiment was to compare the triage of a MCI population using normal triage practice within an urban ED in Alberta against the typical utilization of the START tool. This study was conducted during a time when many hospital disaster plans in Alberta are switching to the use of START in their ED during a MCI. To our knowledge, this is the first attempt to evaluate an established ED triage tool for the purposes of triaging MCI patients in the ED context or to use a primary pre-hospital triage tool in the ED setting.
There was no significant difference in the mean accuracy of cCTAS and START. The over-triage rates are almost identical, while the under-triage rates showed no statistically significant difference between the two tools. The over- and under-triage rates for START are in keeping with the results from Garner et al. (9%-14% and 15%-16%, respectively),Reference Garner, Lee and Harrison 11 , Reference Li and Baker 12 but different from those reported by Kahn et al, (53% and 2%, respectively).Reference Kahn, Schultz and Miller 13 It might be suggested that the under-triage rate for START is approximately double that of cCTAS and higher than the 5% benchmark quoted in the triage literature. 14 However, when one examines the difference between the under-triage rates of START and cCTAS, the 95% CI makes this assertion unlikely. The combination of these results implies that the cCTAS and START systems could adequately triage the causalities of a paper-based MCI simulation in the ED setting.
The mean triage time for cCTAS took significantly longer, as START was 105 seconds/patient faster. The cCTAS participants spent a significant portion of the triage time, 44% (60 seconds/137.8 seconds), typing clinically relevant information into the SEMS. This action was considered to be beneficial, as it would provide pertinent information (vitals, brief presenting, and past medical histories) to subsequent health care professionals who interact with these patients. It should be noted that even if the mean typing time were removed from the mean triage time for cCTAS this adjusted mean time to triage would still be approximately 45 seconds longer than the mean triage time for START.
No expectant (deceased or expected to die) patients were included in the simulated population as there is no pathway within the CTAS system to triage expectant patients aside from CTAS I. In reality, this would not be an acceptable classification for an expectant patient in a MCI setting when resources are already overburdened. The challenge becomes how to tease out expectant patients from this CTAS I category. At present there is no literature that provides guidance on how to identify expectant patients in an ED setting during a MCI. As such, if the CTAS system is to be adopted as an ED disaster triage tool it will likely need an alternate category in order to accommodate expectant patients. A CTAS “zero” category that would imply minimal chance of survival given injuries and scare resources.
There was an inherent bias as the study participants’ use the CTAS system on a daily basis and typically have not received any or regular START algorithm training. There was one notable exception, a study participant who received regular START training through their involvement with the Canadian Red Cross. However, the lack of familiarity with the START system is the norm for these health care professionals and it was felt that providing START training for the study participants was not necessary as this represents their reality and is believed to be true for Canadian ED triage nurses in general. If a primary pre-hospital triage tool were to be adopted for use in the ED setting, then regular training would become an ongoing education priority.
Given the results of this study, it is not clear if utilizing START as a secondary triage tool in an ED during a MCI is appropriate. The accuracy between the two tools appears similar, although this study may have been underpowered to detect small difference. The difference between the mean triage times is clear, however, there are notable differences for how the two systems arrived at their respective triage scores. This pilot study has provided the experimenters with valuable information and allowed for the development of a questionnaire that can easily be expanded and have cases with excellent agreement between the experts that devise the standard triage scores. In addition, improved methodological design, including randomization and generation of sample size, will be possible in future experiments. Further areas that warrant investigation could include: comparing START to a mobile version of CTAS (such as Canadian Triage and Acuity Scale—Pre-Hospital and Emergency Department Versions, prn Education and Consulting) that does not require any fields to be populated with typing and is available on smart phone or tablet devises; comparing the non-MCI to MCI cases within the simulated patient population to examine how the two triage tools compare to one another as this would provide some insight as to how a primary pre-hospital triage tool is at stratifying non-disaster patients; conducting prospective virtual or live simulations to compare these two systems; since triage nurses are in general unfamiliar with the START system one could imagine that with training the overall accuracy and time to triage could improveReference Fernandes, McLeod and Krause 5 - Reference Gravel, Manzano and Arsenault 7 when compared to CTAS; using a cross-over design when comparing the two systems could reduce the cofounding variable effects and decrease the sample size; or comparing a streamlined version of CTAS (as it is believed that in Ontario a pre-hospital CTAS version in under development) with START. Given that the goal of MCI triage remains the same when overtaxing of limited resources occurs, i.e., the greatest good for the greatest number, advocating for the use of either CTAS or START in the ED during a MCI may be reasonable, but choosing one over another is not justified from this investigation.
LIMITATIONS
There were several major limitations in the present study. This experiment used non-randomized assignment with a convenience sample of triage nurses from a single center who were not blinded to their allocation. Calculating a sample size or power calculation was not possible, but the data from this study will aid future experiments to conduct such calculations.
This simulation utilized a paper-based assessment tool and as such was an over simplification of the actual triage process. In practice, a triage nurse would have the ability to interact with a patient and use their clinical acumen in addition to the triage tool when arriving at a triage designation. In addition, the streamlined form of assessment did not capture the difficulty in performing clinical maneuvers in a real situation and instead captured the cognitive component of the triage process only. Ultimately, this study should be viewed as a guide for further studies that may incorporate virtual computer-based simulations, live simulations, or mass gatherings as a proxy for a MCIReference Lund, Butman and Turris 15 in order to corroborate these findings.
Adults were only included in the simulated patient population as the study participant’s familiarity with pediatric patients was limited given that the vast majority of pediatric cases are preferentially funnelled to that center. As the CTAS system has also been validated for use in a pediatric population it would be important to examine its accuracy and time to triage compared to a primary triage tool that is readily used in a pediatric population (JumpSTART, CareFlight, etc.) in a follow-up study.
CONCLUSION
The authors’ believe this is the first formal study to examine the utility of an established ED triage tool or primary pre-hospital triage system for the purposes of triaging MCI patients in the ED setting. The study used a simulated paper-based MCI population to explore the time to triage and accuracy for the cCTAS and START triage tools. The cCTAS took 105 seconds/patient longer to use than START and both tools had similar accuracy. However, when the typing time was taken into consideration, cCTAS took 45 seconds/patient longer. This study suggests that the use of either CTAS or START in the ED setting during a MCI may be reasonable but further investigation is required to determine if one tool should be use over another.
Competing Interests: None to declare.
SUPPLEMENTARY MATERIALS
For supplementary material/s referred to in this article, please visit http://dx.doi.org/10.1017/cem.2016.386


