


Bipolar disorder is a severe, chronic psychiatric disorder with a worldwide lifetime prevalence ranging from 0.5 to 1.5%. Reference Craddock and Jones1 Bipolar disorder is characterised by a variety of profound mood symptoms including episodes of mania, hypomania and depression, and is often accompanied by psychotic features and cognitive deficits. To date, there has been a fair amount of data from family and twin studies to highlight a strong genetic predisposition for bipolar disorder. Reference Craddock and Jones1 Nevertheless, bipolar disorder is a highly polygenic disorder that can vary substantially from population to population. Although linkage analysis and genetic association studies have yielded numerous candidate variants for bipolar disorder, only a few of these have been satisfactorily replicated across independent samples. Reference Etain, Dumaine, Mathieu, Chevalier, Henry and Kahn2,Reference Li, Luo, Rietschel, Lewis, Mattheisen and Müller-Myhsok3
With advances in knowledge of human genetic variations, such as data generated by the International HapMap and 1000 Human Genome projects and several subsequent genome-wide association studies (GWAS) by a number of international collaborators, a wealth of novel susceptible variants for bipolar disorder have been reported, particularly single nucleotide polymorphisms (SNPs), in the following genes: calcium channel, voltage-dependent, L type, alpha 1C subunit (CACNA1C); ankyrin 3, node of Ranvier (ankyrin G) (ANK3); teneurin transmembrane protein 4 (TENM4); neurocan (NCAN); and tetratricopeptide repeat and ankyrin repeat containing 1 (TRANK1). Reference Chen, Jiang, Akula, Shugart, Wendland and Steele4–Reference Mühleisen, Leber, Schulze, Strohmaier, Degenhardt and Treutlein8 These GWAS-identified risk SNPs unfortunately only account for a small portion of the genetic risk for bipolar disorder, which suggests there should be additional loci contributing to the genetic susceptibility. Previous aggregated analyses indicated there might be valid risk loci underlying genetic markers passing only nominal significance in the GWAS, Reference Purcell, Wray, Stone, Visscher, O'Donovan and Sullivan9 a possibility confirmed by several later studies. For example, a number of schizophrenia and bipolar disorder susceptibility SNPs did not reach genome-wide significance in initial GWAS samples, but showed consistent replications in subsequent independent samples, thus implying that these loci might reflect weak but true risk signals. Reference Steinberg, de Jong, Andreassen, Werge and Børglum10
Genetic loci associated with clinical diagnosis are also expected to be related to so-called intermediate phenotypes implicated in the biology of genetic risk for bipolar disorder. Previous studies have reported hippocampal dysfunction (e.g. memory impairment) in patients with bipolar disorder and their unaffected relatives, implying that variation in hippocampal biology is an intermediate phenotype related to the genetic risk of bipolar disorder. Reference Quraishi, Walshe, McDonald, Schulze, Kravariti and Bramon11 In addition, smaller hippocampal volume has been reported in patients with bipolar disorder. Reference Rimol, Hartberg, Nesvåg, Fennema-Notestine, Hagler and Pung12,Reference Haukvik, Westlye, Mørch-Johnsen, Jørgensen, Lange and Dale13 Meanwhile, functional neuroimaging studies have revealed that dysfunctions of the hippocampus and its closely related regions underpin abnormal affective responses and dysfunctional emotion regulation in bipolar disorder. Reference Phillips, Ladouceur and Drevets14 Finally, post-mortem studies further support the hypothesis that hippocampal abnormalities are relevant to the altered synaptic plasticity and diminished resilience in bipolar disorder. Reference Frey, Andreazza, Nery, Martins, Quevedo and Soares15 Therefore, analysis of bipolar disorder-associated SNPs on these hippocampus-related phenotypes may provide a plausible way to uncover their functions in neurodevelopment, and possibly, their involvement in disease susceptibility.
Recent successes in integrating disease GWAS and gene expression data for several other complex diseases have been promising, Reference Conde, Bracci, Richardson, Montgomery and Skibola16–Reference Zou, Chai, Younkin, Allen, Crook and Pankratz18 and we wondered whether such an approach may yield novel results for bipolar disorder. Predictably, several lines of evidence have suggested an enrichment of expression quantitative trait loci (eQTL) among bipolar disorder susceptibility SNPs in the brain, Reference Gamazon, Badner, Cheng, Zhang, Zhang and Cox19 further highlighting the importance of integrating the functional annotation of genetic variants for gene expression to advance our understanding of the biological bases of bipolar disorder. In light of these findings, we integrated bipolar disorder GWAS data from 16 731 individuals and genome-wide eQTL data from 193 human cortex samples from healthy individuals, followed by a set of independent replications on both eQTL and disease associations.
Method
Discovery brain eQTL and bipolar disorder GWAS data-sets
The brain eQTL data-set used in this study was reported previously. Reference Myers, Gibbs, Webster, Rohrer, Zhao and Marlowe20 In brief, after excluding ethnic outliers and samples that were possibly related, a total of 193 independent human cortex samples of European origin from healthy, older individuals (age>65) were included in the eQTL analysis. Detailed information about genotyping and expression profiling, as well as the statistical methods used, can be found in the online data supplement to this paper or the original publication. Reference Myers, Gibbs, Webster, Rohrer, Zhao and Marlowe20
For the bipolar disorder GWAS data, the working group of the Psychiatric Genomics Consortium (PGC) for bipolar disorder recently conducted a meta-analysis of large-scale genome-wide data on bipolar disorder among populations of European descent (PGC1 family GWAS). Reference Sklar, Ripke, Scott, Andreassen, Cichon and Craddock6 In this earlier study, the researchers opted to compare patients with bipolar disorder that had experienced pathologically relevant episodes of elevated mood (mania or hypomania) and control patients from the same geographical and ethnic populations. To summarise, we used 2 117 872 SNPs across the genome from the GWAS samples (7481 cases and 9250 controls), and the association significance (P-values) for these SNPs was downloaded from the PGC1 data-sharing website (www.med.unc.edu/pgc/downloads). Detailed descriptions of the samples, data quality, genotype imputation, genomic controls and statistical analyses can be found in the original study. Reference Sklar, Ripke, Scott, Andreassen, Cichon and Craddock6
Integrative analysis of eQTL and bipolar disorder GWAS data
We integrated the eQTL and bipolar disorder GWAS data using a Bayesian statistical framework. Statistical analyses for the eQTL and bipolar disorder GWAS were carried out with the Sherlock software tool (http://sherlock.ucsf.edu/submit.html), which has been described elsewhere. Reference He, Fuller, Song, Meng, Zhang and Yang17 In brief, Sherlock is based on the rationale that a risk gene for the disease may have at least one eQTL, and these eQTLs could alter gene expression, which in turn affects disease susceptibility. Given the probability that this might be true, there should be a significant overlap of the eQTL of a gene and the loci associated with the disorder, which would imply a likely functional role for the gene in that particular disease. At this juncture, Sherlock aligns the eQTL and bipolar disorder GWAS and considers only the shared SNPs in both data-sets. Sherlock's scoring rubric both increases the total gene score for overlapping SNPs and provides a penalty in the absence of an overlap, although associations found only in the bipolar disorder GWAS do not alter the score. Sherlock computes individual log Bayes factors (LBFs) for each SNP pair in the alignment, and the sum of these constitutes the final LBF score for each gene.
Brain eQTL data for replication analysis
Considering that bipolar disorder is a mental disorder that originates from abnormal brain function, brain samples are presumably appropriate for replication testing of the eQTL results. We first used a brain dorsolateral prefrontal cortex (DLPFC) sample (n = 320) consisting of White and African-American healthy controls (labelled as the ‘first replication sample’), in which the sample had been previously used to identify psychiatric risk mRNA transcripts. Reference Morita, Callicott, Testa, Mighdoll, Dickinson and Chen21–Reference Tao, Li, Newburn, Ye, Lipska and Herman23
We also used other well-characterised brain expression databases for replication analysis of the eQTL associations. A brief description of the gene expression resources is provided as follows, whereas more detailed information can be found in the original studies: Reference Zou, Chai, Younkin, Allen, Crook and Pankratz18,Reference Colantuoni, Lipska, Ye, Hyde, Tao and Leek24–Reference Heinzen, Ge, Cronin, Maia, Shianna and Gabriel26
-
(a) BrainCloud: BrainCloud contains genetic information and whole-transcriptome expression data from the post-mortem DLPFC of 261 healthy White and African-American individuals. The data in BrainCloud are aimed at exploring temporal dynamics and genetic control of transcription across the lifespan. Reference Colantuoni, Lipska, Ye, Hyde, Tao and Leek24 Of note, there is partial overlap between BrainCloud data and our ‘first replication sample’.
-
(b) Data from the study by Webster et al: Webster and colleagues studied the relationship between the human brain transcriptome and genome in a series of neuropathologically normal post-mortem samples and a confirmed pathological diagnosis of late-onset Alzheimer's disease (final n = 188 controls, 176 cases). They suggested that studying the transcriptome as a quantitative endophenotype has greater power for discovering risk SNPs that influence expression than the use of discrete diagnostic categories, such as disease presence or absence. Reference Webster, Gibbs, Clarke, Ray, Zhang and Holmans25 It should be noted that the control sample in this study was the same as our discovery brain eQTL sample. Reference Myers, Gibbs, Webster, Rohrer, Zhao and Marlowe20
-
(c) SNPExpress: The authors, using Affymetrix exon arrays, analysed genome-wide SNPs that are associated with gene expression in human primary cells at the exon level, and evaluated 93 autopsy-collected, cortical brain tissue samples with no defined neuropsychiatric conditions. Reference Heinzen, Ge, Cronin, Maia, Shianna and Gabriel26
-
(d) Data from the study by Zou et al: The authors of this study measured the expression levels of 24 526 transcripts in brain samples from the cerebellum and temporal cortex of autopsied individuals with Alzheimer's disease (cerebellar n = 197, temporal cortex n = 202), and conducted an expression GWAS using 213 528 cis-SNPs within 100 kb of the tested transcripts. Their results demonstrated the significant contributions of genetic factors to human brain gene expression, which are reliably detected across different brain regions; they also suggested that the combined assessment of expression and disease GWAS might provide complementary information in the discovery of human disease variants with functional implications. Reference Zou, Chai, Younkin, Allen, Crook and Pankratz18
Bipolar disorder samples for replication analysis
Replication analyses on bipolar disorder samples were conducted in two steps (replication-I and -II), examining a total of 6056 bipolar disorder cases and 46 614 controls from 10 different geographical locations. Detailed information on each sample, including diagnostic assessment, genotyping method and quality control, are shown in the online data supplement and online Table DS1.
Briefly, the bipolar disorder samples used in our replication-I analysis included: (a) Germany II (181 cases and 527 controls); Reference Cichon, Mühleisen, Degenhardt, Mattheisen, Miró and Strohmaier5 (b) Germany III (490 cases and 880 controls); Reference Cichon, Mühleisen, Degenhardt, Mattheisen, Miró and Strohmaier5 (c) Australia (330 cases and 1811 controls); Reference Cichon, Mühleisen, Degenhardt, Mattheisen, Miró and Strohmaier5 (d) France (451 cases and 1631 controls); Reference Etain, Dumaine, Mathieu, Chevalier, Henry and Kahn2 (e) Sweden I (836 cases and 2093 controls); Reference Sklar, Ripke, Scott, Andreassen, Cichon and Craddock6 (f) Sweden II sample (1415 cases and 1271 controls); Reference Sklar, Ripke, Scott, Andreassen, Cichon and Craddock6 (g) Iceland (541 cases and 34 546 controls); Reference Sklar, Ripke, Scott, Andreassen, Cichon and Craddock6 (h) Romania (244 cases and 174 controls), Reference Cichon, Mühleisen, Degenhardt, Mattheisen, Miró and Strohmaier5 and (i) China (350 cases and 888 controls). Reference Zhang, Zhang, Wu, Wang, Peng and Chen27 For our replication-II analysis, we used a UK sample (1218 cases and 2913 controls). Reference Green, Hamshere, Forty, Gordon-Smith, Fraser and Russell28 The 10 samples from the replication-I and II analyses showed no overlap with the PGC1 bipolar disorder samples. Reference Sklar, Ripke, Scott, Andreassen, Cichon and Craddock6 Each of the original studies was conducted under appropriate ethical approval. Written informed consent was obtained from all participants.
Samples for analysis of hippocampal volume and cognitive performance
For the analysis of hippocampal volume, we used the data from a recent GWAS conducted by the Enhancing Neuro Imaging Genetics through Meta Analysis (ENIGMA) consortium. Reference Stein, Medland, Vasquez, Hibar, Senstad and Winkler29 The GWAS includes a total of 5775 young and healthy individuals (mean age: 34.8 years). Detailed information on the samples, imaging procedures, genotyping methods and statistical analysis can be found in the original GWAS report. Reference Stein, Medland, Vasquez, Hibar, Senstad and Winkler29
For analysis of cognitive performance, we used a Chinese sample that included 342 healthy Chinese college students from Beijing Normal University who had self-reported no known history of any neurological or psychiatric disorders (197 women and 145 men, aged 18–23). Cognitive and behavioural measures (shown in online Table DS2) included working memory, executive functions (as assessed with the Attention Network Test, the Wisconsin Card Sorting Task and a reversal-learning test) and personality traits. The institutional review board of the State Key Laboratory of Cognitive Neuroscience and Learning at Beijing Normal University, China approved this experiment. Written informed consent was obtained from all participants following a full explanation of the study procedure.
Statistical analysis
For the replication analysis of bipolar disorder, genomic control was used to correct for relatedness and potential population stratification in each sample; Reference Devlin and Roeder30 association P-values and allele-specific odds ratios (ORs) for each individual sample were calculated with a logistic regression model with an additive effect using a lambda value (genomic control) as a covariate to adjust for potential population stratification. Meta-analyses were then conducted based on Z-scores by combining data from different samples in the R software package (www.r-project.org) (meta-module) using the Cochran–Mantel–Haenszel test under the fixed-effects model. As described in a previous GWAS meta-analysis, Reference Sklar, Ripke, Scott, Andreassen, Cichon and Craddock6 P-values for replication samples are reported as one-tailed tests, whereas P-values for all combined samples are shown as two-tailed tests. We used a forest plot to graphically present the individual ORs and their 95% confidence intervals (CIs), i.e. each sample was represented by a square in the forest plot. For the analyses on cognitive performance, two-tailed t-tests were conducted with SPSS version 16.0 (IBM Corporation, Armonk, New York, USA).
To explain the logic of the study design, a flow chart summarising the analytical methods and showing how variants were taken forward from one stage of analysis to the next is shown in Fig. 1. All protocols and methods used in this study were approved by the institutional review board of the Kunming Institute of Zoology, Chinese Academy of Sciences and adhere to all relevant national and international regulations.
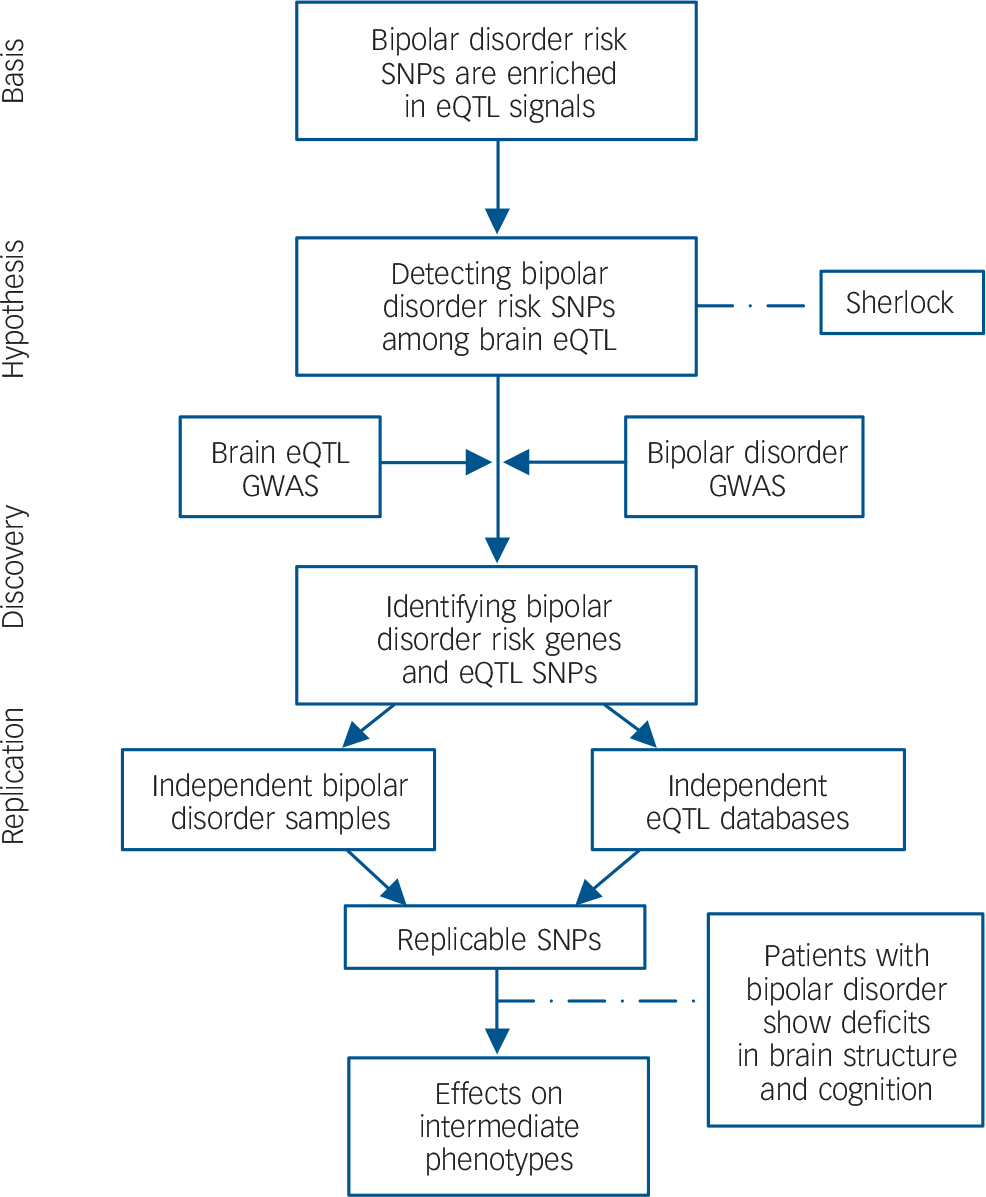
Fig. 1 Flow chart of the present study.
Based on the hypothesis that bipolar disorder risk variants are enriched among eQTL, we systematically integrated bipolar disorder GWAS and genome-wide brain eQTL data with the Sherlock software tool. The top genes identified by Sherlock were then replicated in independent bipolar disorder samples and eQTL data-sets. Finally, the successfully replicated SNP (rs6088662) was further tested for associations with bipolar disorder phenotypes including hippocampal volume and cognitive performance. SNP, single nucleotide polymorphism; eQTL, expression quantitative trait loci; GWAS, genome-wide association study.
Results
Integrative analysis of eQTL and bipolar disorder GWAS data
Sherlock identified a total 20 942 SNPs showing significant eQTL effects, and also having bipolar disorder data (e.g. P-values), and these SNPs were included for further analyses. Using a Bayesian statistical method to match the ‘signature’ of genes from the brain eQTL with patterns of association in the bipolar disorder GWAS, we ranked the top candidate genes for bipolar disorder risk according to their LBF scores and P-values. Only genes with LBF scores higher than 5.00 were shown and included for further analyses.
The integrative analysis yielded four candidate risk genes (online Table DS3). The first gene was glycosyltransferase 8 domain containing 1 (GLT8D1; LBF = 6.78), located on chromosome 3p21.1, which has been repeatedly reported for association with bipolar disorder. Reference Scott, Muglia, Kong, Guan, Flickinger and Upmanyu31,Reference McMahon, Akula, Schulze, Muglia, Tozzi and Detera-Wadleigh32 Detailed analysis revealed that the significant association with this gene was mainly driven by a cis-associated SNP (rs2251219). This SNP had already been reported in an earlier GWAS of bipolar disorder, Reference McMahon, Akula, Schulze, Muglia, Tozzi and Detera-Wadleigh32 and was replicated in independent bipolar disorder samples. (Their samples overlapped with our replication samples. Reference Breen, Lewis, Vassos, Pergadia, Blackwood and Boomsma33–Reference Vassos, Steinberg, Cichon, Breen, Sigurdsson and Andreassen35 ) The second top-ranked gene was chemokine (C-X-C motif) ligand 16 (CXCL16; LBF = 6.16), which is located on chromosome 17p13. To the best of our knowledge, this gene has never been reported in genetic association studies on bipolar disorder, and we observed two trans-associated SNPs showing moderate associations with bipolar disorder. The third top-ranked gene was transient receptor potential cation channel, subfamily C, member 4 associated protein (TRPC4AP; LBF = 5.57) located on chromosome 20q11.22, with the significance mainly driven by a cis-associated SNP (rs6088662, P = 5.85×10⁻⁵ with bipolar disorder). The last top-ranked gene was TAF11 RNA polymerase II, TATA box binding protein (TBP)-associated factor, 28 kDa (TAF11; LBF = 5.52) located on chromosome 6p21.31, with a trans-associated SNP (rs4482754), which also showed significant association with bipolar disorder.
Replication of eQTL effects in diverse samples
Given the many confounders in a single eQTL database, it is important and necessary to validate the eQTL associations in independent samples. The previously mentioned four candidate genes and their cis- or trans-associated SNPs were followed up in independent eQTL data-sets.
For the cis-associated SNP rs2251219 and GLT8D1, we observed significant association in one replication sample of Alzheimer's disease source (online Table DS4), Reference Webster, Gibbs, Clarke, Ray, Zhang and Holmans25 and a marginally significant association in the BrainCloud sample. Reference Colantuoni, Lipska, Ye, Hyde, Tao and Leek24 However, as demonstrated by a previous study, Reference McMahon, Akula, Schulze, Muglia, Tozzi and Detera-Wadleigh32 the association of rs2251219 with GLT8D1 expression in our discovery eQTL sample (Myers et al study) Reference Myers, Gibbs, Webster, Rohrer, Zhao and Marlowe20 may be an artifact, since the probes overlapped with other common SNPs and it could not be replicated in the original cDNA samples of our discovery eQTL data-set by quantitative polymerase chain reaction using probes not overlapping with known SNPs. In addition to GLT8D1, we also analysed the expression of other nearby genes around rs2251219; however, no promising findings were observed (Table DS4). For the significant trans-eQTL associations in our discovery sample, neither CXCL16 nor TAF11 could be validated in any of the replication samples (online Table DS5), implying they might have been generated by chance.
For the cis-association between rs6088662 and TRPC4AP expression, in the discovery eQTL brain sample, Reference Myers, Gibbs, Webster, Rohrer, Zhao and Marlowe20 the risk allele G of rs6088662 showed significantly decreased gene expression (P<1.0×10⁻⁸, Fig. 2(a)). This pattern was validated in one of the replication samples (P<1.0×10⁻⁸), Reference Webster, Gibbs, Clarke, Ray, Zhang and Holmans25 but it should be noted that these replication data include our discovery sample. We therefore re-analysed the result using the non-overlapped Alzheimer's disease patients, and it showed a nominally significant association (P = 0.023, Fig. 2(b)). However, rs6088662 showed an opposite effect on TRPC4AP expression in our ‘first replication sample’. (The risk allele G of rs6088662 showed increased gene expression.) In other replication samples, no significant association between rs6088662 and TRPC4AP was observed (online Table DS6). Reference Zou, Chai, Younkin, Allen, Crook and Pankratz18,Reference Heinzen, Ge, Cronin, Maia, Shianna and Gabriel26 These inconsistencies may not be surprising, given a prior report of low-to-moderate overlap between eQTL loci across eQTL studies. (The percentage of over-lapped eQTL is from 0 to approximately 35.4% between pairwise brain studies, as shown in Table 4 of the study by McKenzie et al Reference McKenzie, Henders, Caracella, Wray and Powell36 ). In addition, with the use of several non-brain tissue eQTL databases, Reference Dimas, Deutsch, Stranger, Montgomery, Borel and Attar-Cohen37–Reference Stranger, Montgomery, Dimas, Parts, Stegle and Ingle39 we also observed significant and consistent associations between rs6088662 and TRPC4AP expression. (The P-values range from 0.047 to 3.60×10⁻⁷; online Figs DS1–DS3.)

Fig. 2 The risk SNP rs6088662 is significantly associated with TRPC4AP mRNA expression. (a) Results in 193 neuropathologically normal human brain (cortical) samples from European individuals. (b) Results in 176 Alzheimer's disease human brain (cortical) samples from European individuals. SNP, single nucleotide polymorphism.
To further examine whether rs6088662 is also associated with the expression of other nearby genes, we screened 14 genes in the 20q11.22 region in both discovery and replication eQTL samples (Table DS6). Intriguingly, we observed another gene, gamma-glutamyltransferase 7 (GGT7) showing significant association in the discovery sample (P<1.0×10⁻⁷; Fig. 3(a)), and it remained significant in the ‘first replication sample’ with the same direction of effect (P<1.0×10⁻⁸; Fig. 3(b)). In other replication samples, the association has also been significant (Webster et al Reference Webster, Gibbs, Clarke, Ray, Zhang and Holmans25 and Zou et al Reference Zou, Chai, Younkin, Allen, Crook and Pankratz18 studies; Fig. 3(c) and Table DS6) or marginally significant (BrainCloud), Reference Colantuoni, Lipska, Ye, Hyde, Tao and Leek24 except for the study by Heinzen et al Reference Heinzen, Ge, Cronin, Maia, Shianna and Gabriel26 (P = 0.13); however, in the sample analysed by Heinzen et al, rs6088662 still showed one of the strongest associations with GGT7 among the genes located on chromosome 20q11.22, and the SNP showed significant or marginally significant associations with the expression of several exons in GGT7 (online Table DS7), which was not observed in the majority of other nearby genes.

Fig. 3 The risk SNP rs6088662 is significantly associated with GGT7 mRNA expression. (a) Results in 193 neuropathologically normal human brain (cortical) samples from European individuals. (b) Results in 320 healthy human brain DLPFC samples from White and African-American individuals. (c) Results in 176 Alzheimer's disease human brain (cortical) samples from European individuals. DLPFC, dorsolateral prefrontal cortex.
The other genes located on chromosome 20q11.22, ACSS2, MYH7B and EDEM2i, also showed associations in some of the eQTL samples, but the associations were not consistent and these genes are unlikely to be the associated genes (Table DS6). To summarise, from the eQTL analyses in both discovery and replication samples, we have been able to show that rs6088662 is likely to be an authentic eQTL SNP, and we found two potential genes (GGT7 and TRPC4AP) showing an association with this risk SNP.
rs6088662 is associated with bipolar disorder across cohorts
Given the replication of significant associations between rs6088662 and TRPC4AP expression, we opted to further analyse this SNP with regard to bipolar disorder risk. In the stage I replication analysis, we analysed rs6088662 in nine independent case–control samples. Although the association between rs6088662 and bipolar disorder did not achieve even nominal significance (P = 0.05) in any single cohort, it did show a trend of association in the Germany II and Sweden II samples (P = 0.08 and P = 0.07 respectively). In the Chinese sample, there was no difference in allele frequencies of this SNP between Han Chinese and Europeans (0.165 v. 0.171 for the risk allele G), and the effect size (OR) in the Chinese sample was even higher than in our discovery sample (1.17 v. 1.12), the non-significant result being likely due to the limited sample size. When all the replication-I samples were combined, the association P-value reached nominal significance level (P = 4.95×10⁻²), with the OR being 1.06 (95% CI = 0.99–1.13), consistent with the discovery PGC1 GWAS. There was no significant heterogeneity among the replication-I samples (P = 0.77). Detailed results for each individual sample are shown in Table 1. The forest plot of the meta-analysis of all replication-I samples is shown in Fig. 4.
Table 1 Summary of logistic regression results for rs6088662 across cohorts

| Sample | Ethnicity | Cases | Controls | Effect allele | Additive P a | Odds ratio | 95% CI | Data source |
|---|---|---|---|---|---|---|---|---|
| Discovery | ||||||||
| PGC1 | European | 7481 | 9250 | G | 5.85×10⁻⁵ | 1.12 | 1.06–1.19 | Sklar et al Reference Sklar, Ripke, Scott, Andreassen, Cichon and Craddock6 |
| Replication-I | ||||||||
| Germany II | German | 181 | 527 | G | 0.08 | 1.23 | 0.91–1.65 | This study |
| Germany III | German | 490 | 880 | G | 0.16 | 1.09 | 0.90–1.33 | This study |
| Australia | Australian | 330 | 1811 | G | 0.29 | 1.07 | 0.85–1.33 | This study |
| France | French | 451 | 1631 | G | 0.42 | 1.02 | 0.85–1.22 | This study |
| Sweden I | Swedish | 836 | 2093 | G | 0.37 | 1.02 | 0.89–1.18 | This study |
| Sweden II | Swedish | 1415 | 1271 | G | 0.07 | 1.12 | 0.97–1.29 | This study |
| Iceland | Icelandic | 541 | 34 426 | G | 0.19 | 0.93 | 0.79–1.10 | This study |
| Romania | Romanian | 244 | 174 | G | 0.42 | 1.04 | 0.74–1.46 | This study |
| China | Han Chinese | 350 | 888 | G | 0.11 | 1.17 | 0.91–1.50 | This study |
| Total b | 4838 | 43 701 | G | 4.95×10⁻² | 1.06 | 0.99–1.13 | ||
| Replication-II | ||||||||
| UK | British | 1218 | 2913 | G | 1.06×10⁻⁶ | 1.34 | 1.19–1.51 | Green et al Reference Green, Hamshere, Forty, Gordon-Smith, Fraser and Russell28 |
| Discovery + replication samples c |
13 537 | 55 864 | G | 3.54×10⁻⁸ | 1.12 | 1.07–1.16 | ||
CI, confidence interval; PGC, Psychiatric Genomics Consortium.
a. P-values are two-sided for the discovery cohort and combined analysis; one-sided P-values are listed for the replication-I samples.
b. Heterogeneity test: all replication-I cohorts: P = 0.77, I 2 = 0%; meta-analysis was conducted under a fixed-effects model.
c. Heterogeneity test: discovery + replication samples: P = 0.07, I 2 = 41.8%; meta-analysis was conducted under a fixed-effects model.

Fig. 4 Forest plot of odds ratios (ORs) with a 95% confidence interval (CI) for total replication-I bipolar disorder samples included in the meta-analysis of rs6088662.
The risk allele G of rs6088662 is overrepresented in bipolar disorder cases in all of the tested cohorts (except for the Icelandic sample).
Notably, a previous study Reference Green, Hamshere, Forty, Gordon-Smith, Fraser and Russell28 reported a significant association of a proxy SNP of rs6088662 (rs13041792, r 2 = 1.00 with rs6088662 in Europeans) with bipolar disorder in an independent UK sample (1218 cases and 2913 controls), which is in agreement with our results and was also included in our analysis, denoted as the ‘replication-II’ sample. Meta-analysis by combining PGC1 GWAS, replication-I and replication-II samples yielded a genome-wide significant association of rs6088662 with bipolar disorder (P = 3.54×10⁻⁸, OR = 1.12, 95% CI = 1.07–1.16, Table 1). We used the fixed-effects model for meta-analysis because there was no significant heterogeneity among the samples (P>0.05).
Considering the genetic overlap between bipolar disorder and other psychiatric disorders, Reference Craddock and Jones1 we also tested the association of rs6088662 with two other mental disorders, schizophrenia and major depressive disorder. It showed a nominally significant association with schizophrenia in the latest PGC2 GWAS (P = 0.0037, OR = 1.04, 95% CI = 1.00–1.08, n = 35 476/46 839); Reference Ripke, Neale, Corvin, Walters, Farh and Holmans40 however, it did not show any significant associations with major depressive disorder when using data from the PGC1 major depressive disorder GWAS plus the PsyCoLaus study samples (10 541/11 208) (online Table DS8), Reference Ripke, Wray, Lewis, Hamilton, Weissman and Breen41,Reference Preisig, Waeber, Vollenweider, Bovet, Rothen and Vandeleur42 implying that rs6088662 is likely a psychosis risk SNP rather than a risk SNP for a broader spectrum of mood disorders.
A proxy search for SNPs in high linkage disequilibrium with rs6088662 was performed on the SNP Annotation and Proxy Search (SNAP) database, version 2.2 (www.broadinstitute.org/mpg/snap/ldsearch.php) with the European panel from the 1000 Human Genome project (pilot 1) data-set. This identified 43 SNPs in high linkage disequilibrium (r 2>0.8) with rs6088662, all of which are located within the MYH7B and TRPC4AP regions (Fig. 5). Among these, there are one non-synonymous SNP, three synonymous SNPs, one SNP in the 3′ untranslated region (3′ UTR) and one SNP located in the non-coding RNA (ncRNA) region (online Table DS9). However, to identify causal variants for bipolar disorder, further studies are needed.

Fig. 5 Plot of chromosome region showing a genomic area of high linkage disequilibrium with rs6088662 in European populations. CEU, Northwestern Europe.
rs6088662 is associated with hippocampal volume and cognitive performance
To move beyond statistical association with clinical diagnosis and to obtain convergent evidence for an association between rs6088662 and bipolar disorder-related biology, we also performed a series of convergent experiments testing risk-associated SNPs on several intermediate biological phenotypes. The hippocampus is located under the cerebral cortex and it is a region frequently reported to show dysfunction among patients with bipolar disorder. Reference Zou, Chai, Younkin, Allen, Crook and Pankratz18,Reference Tao, Li, Newburn, Ye, Lipska and Herman23 We therefore hypothesised that if the identified risk-associated SNP (e.g. rs6088662) affects the anatomy or function of this brain region, then related cognitive deficits, regardless of illness status, should be associated with it. In an exploratory manner, we tested the effects of rs6088662 on the biological phenotypes related to the hippocampus (hippocampal volume and cognitive performance) in healthy individuals.
In the ENIGMA sample, rs6088662 was significantly associated with hippocampal volume across multiple cohorts (P = 0.00063, β = 27.29 mm3; online Table DS10), supporting the prior hypothesis that bipolar disorder-associated SNPs will likely affect hippocampal structure, although detailed analysis found that the risk allele G led to larger hippocampal volume. As a post hoc exploratory test, we then investigated the potential impact of rs6088662 on cognitive performance and found that rs6088662 showed a nominally significant association with executive functions (the alert attention task) (P = 0.0094; online Table DS11) and language abilities (visual/auditory) (P = 0.012; online Table DS11). Again, the risk allele G indicated a better cognitive performance.
Analysis of bipolar disorder-related phenotypes further confirmed the role of the risk SNPs in bipolar disorder susceptibility and implied it may be functional in the brain. However, as the association results on these intermediate phenotypes (especially for cognitive performance) may not survive multiple correction, further validation in larger samples is needed. In addition, the discrepancy of allelic directionality between clinical diagnosis and intermediate phenotypes suggests that the molecular mechanism at work may be more complicated than we had initially expected when undertaking this study.
Discussion
Findings relating to the 20q11.22 region
In this study, using an integrative analysis that involved both expression and bipolar disorder data, we identified a potential risk locus on chromosome 20q11.22 for bipolar disorder, although it remains unclear which SNPs are actually responsible. This genomic region contains an extensive area of high linkage disequilibrium spanning approximately 276 kb, including at least five protein coding genes (Fig. 5). Of the 43 common SNPs in high linkage disequilibrium (r 2>0.8) with rs6088662, there is one non-synonymous SNP, three synonymous SNPs, one SNP in the 3′ UTR area and one SNP located in the ncRNA region, all of which are potentially functional but have, as of yet, unknown roles (online Table DS9).
We found a nominally significant association of bipolar disorder risk SNPs with hippocampal volume and cognitive performance, which is consistent with the prevalent perspective that many bipolar disorder-related genes also affect brain structures and cognitive functions. Rather perplexingly though, the rs6088662 risk allele actually seemed to be associated with larger hippocampal volume and better cognition, running entirely opposite to the conventional view that risk alleles generally lead to smaller hippocampal volume and worse cognition. One potential speculative explanation is that the risk genes (GGT7 or TRPC4AP) may play diverse roles in neural development, and the SNP has pleiotropic effects – some detrimental and some beneficial. Another possible explanation is that gene–behaviour association differs by diagnosis status, as previous studies also reported other similar situations: for example, the psychosis risk allele rs1344706 in ZNF804A is associated with better cognitive performance in patients with schizophrenia as seen in two independent samples. Reference Walters, Corvin, Owen, Williams, Dragovic and Quinn43,Reference Chen, Xu, Zhai, Bao, Zhang and Gu44 Likewise, another psychosis risk SNP (rs1006737) in CACNA1C was shown to be associated with larger grey matter volume for those with the risk allele. Reference Wang, McIntosh, He, Gelernter and Blumberg45,Reference Perrier, Pompei, Ruberto, Vassos, Collier and Frangou46
Additional evidence of GGT7 and TRPC4AP in bipolar disorder
TRPC4AP is known to be a substrate-specific adapter of a double-cortin (DCX; DDB1-CUL4-X-box) E3 ubiquitin ligase complex required for cell-cycle control, and GGT7 is a member of a gene family that encodes enzymes involved in the metabolism of glutathione and in the transpeptidation of amino acids; however, their roles in bipolar disorder susceptibility are still unclear. Here we studied the spatial expression profiling of GGT7 and TRPC4AP in multiple human tissues to see whether their expression was enriched in brain tissues, as bipolar disorder is a mental disorder that mainly originates from abnormal brain function, and if these genes are preferentially expressed in the brain, which would make more sense when considering them as potential risk genes for bipolar disorder. We used the expression data from the Genotype-Tissue Expression project, Reference Lonsdale, Thomas, Salvatore, Phillips, Lo and Shad47 in which 3797 tissues from 150 post-mortem donors have been collected and subsequently analysed using an RNA sequencing-based gene expression approach. Notably, we found that GGT7 is abundantly expressed in human brain tissues, such as the cerebellum (online Fig. DS4(a)), whereas the expression level of GGT7 is generally low in non-neural tissues. However, the expression of TRPC4AP in brain tissue is relatively lower than in other tissues (online Fig. DS4(b)), but this gene has been previously reported in association with Alzheimer's disease, Reference Poduslo, Huang and Huang48,Reference Poduslo, Huang, Huang and Smith49 a neurological disorder showing a high comorbidity with affective disorders, such as bipolar disorder and major depressive disorder, in geriatric populations. Reference Teipel, Walter, Likitjaroen, Schönknecht and Gruber50
Implications
Alongside our specific findings for genetic susceptibility to bipolar disorder, our results highlight several advantages of convergent analysis using bipolar disorder and eQTL GWAS data-sets (Fig. 1) over conventional analytical strategies aimed at uncovering susceptibility genes. First, analyses such as ours may identify genes that may be missed by traditional univariate analytical approaches, because these genes tend to be authentic risk genes but with small effects. Second, the identification of eQTL effects of the risk SNPs could provide insights for future focused studies, since conventional analyses often observe a large linkage disequilibrium region containing numerous genes showing association with the illness, but actually determining which one is the susceptibility gene is, at best, difficult. Third, significant association between eQTL and illness has been consistently replicated across independent data-sets, providing convergent validity for findings and suggesting potentially higher reproducibility for this kind of system level analysis. Given these advantages, it is likely that further studies using similar methods will strengthen the case for such studies in trying to uncover genetic risk factors for psychiatric diseases.
Study limitations
Although this study offers some interesting observations, it should be noted that the present evidence is limited, and we are therefore cautious in interpreting these results:
-
(a) In the integrative analysis of bipolar disorder and eQTL GWAS data, we arbitrarily selected genes that were scored higher than 5.0 (LBF score). As such, it is possible that some genes that may contribute to bipolar disorder risk but did not meet our selection criteria could have been missed.
-
(b) Similarly, although we used GWAS data in our analysis, SNP coverage is still relatively low and other true risk SNPs may have been missed. Due to the dearth of functional data, it is difficult to identify the causative variant(s).
-
(c) Likewise, we cannot exclude the possibility that the positive association signal was actually caused by the hitchhiking effect of rare missense mutations, copy number variations or variants in a distant region. Further focused studies may provide a more complete survey.
-
(d) The SNPs in the discovery eQTL sample were not imputed, thus reducing the overlap between eQTL and GWAS data-sets and the power of our method, although we believe the obtained results are valuable.
-
(e) The gene expression coverage in the discovery eQTL data-set is relatively low, and we cannot exclude the possibility of other missing risk genes during the integrative analyses, although we conducted a comprehensive replication and fine mapping analyses to localise the actual risk genes. Further studies using a high coverage array or RNA sequencing are warranted.
-
(f) It also should be acknowledged that the eQTL databases we used are highly variable, in terms of expression platforms and tissue quality, age and diagnoses. It is highly likely that biological factors mediating eQTL associations, such as epigenetic regulation, transcription factor binding and microRNA dynamics will vary across age and diagnosis.
-
(g) We would also like to note that our results reached genome-wide significance in the final meta-analysis of our ten new samples added to the public bipolar disorder data-set. Our understanding of the association of rs6088662 with bipolar disorder and with gene expression and hippocampal biology might have started first with the combined GWAS result, but this was not our strategy.
In conclusion, our data from large-scale samples support that SNPs located on chromosome 20q11.22 are significantly associated with bipolar disorder. We observed associations with GGT7 and TRPC4AP mRNA expression, hippocampal volume and cognitive performance. Although the actual risk gene(s) for bipolar disorder in this genomic region are yet to be determined, future studies may give a more compelling picture on the association between these potential risk factors and genetic susceptibility to bipolar disorder.
Acknowledgements
We would like to acknowledge the efforts of the Psychiatric Genomics Consortium Bipolar Disorder Working Group for their contribution to this study. We are deeply grateful to Stacy Steinberg, Hreinn Stefansson, Kari Stefansson, Thorgeir Thorgeirsson (deCODE Genetics, Reykjavík, Iceland) and Engilbert Sigurdsson (Landspitali University Hospital, Reykjavík, Iceland) for their results from the Icelandic samples. We are also grateful to Andrew Willden (Kunming Institute of Zoology, Kunming, Yunnan, China) for the language editing of the manuscript.


eLetters
No eLetters have been published for this article.