


A major public health and policy challenge in low-income countries (LIC) is the unique epidemiological phenomenon of growing obesity concurrent with a substantial prevalence of underweight, commonly referred to as the double nutritional burden, which can occur within individuals, households and populations, and across the life course( 1 ). Obesity rates are rising globally, with higher prevalence among women, which raises serious concerns for prevention of the consequent health and economic burdens( Reference Popkin and Slining 2 , Reference Kanter and Caballero 3 ). Although obesity is more prevalent than underweight in many regions( 1 , Reference Popkin and Slining 2 ), underweight remains a serious public health problem in South Asia and Central and East Africa, since chronic energy deficiency is also a risk factor for adult morbidity, mortality and low productivity( 1 ). Moreover, obesity and underweight among women present transgenerational concerns for prevention, as both have adverse consequences among their offspring in terms of multiple chronic conditions( Reference Subramanian and Smith 4 ). Tackling the challenge of this double nutritional burden requires a better understanding of the broader determinants of underweight and obesity among adult women in LIC( Reference Subramanian and Smith 4 ).
It is well known that economic resources are a critical determinant of women’s weight status, but most of the evidence is concentrated at the individual level in terms of income, education, class and material deprivation( Reference Braveman, Egerter and Williams 5 , Reference McLaren 6 ). Despite reviews advocating for more research on policy-level determinants, very few international studies have examined how increases in national wage levels might influence weight outcomes. Individual-level research indicates that people reporting greater economic insecurity show higher levels of obesity and weight gain( Reference Conklin, Forouhi and Brunner 7 , Reference Smith 8 ). Whereas higher gross domestic product improves a country’s level of wealth, minimum wage is a policy lever that affects an individual’s experience of economic (in)security by providing an economic environment with a secure income floor that may be especially important for women, who are disproportionately affected by low-wage employment globally. Longitudinal evidence from the USA reveals a relationship between minimum wage levels and women’s body weight( Reference McCarrier 9 , Reference Meltzer and Chen 10 ). By providing more material resources, higher minimum wage could improve a person’s weight status through multiple pathways including lowering physiological stress responses and improving dietary intakes( Reference Conklin 11 ).
There have been few longitudinal or quasi-experimental studies of the relationship between minimum wage and health in low- and middle-income countries. One longitudinal multi-country study reported mixed associations of minimum wage with early-life health outcomes measured by height-for-age Z-scores( Reference Majid, Mendoza Rodríguez and Harper 12 ), while another showed protective effects against child stunting and a composite measure of anthropometric failure( Reference Ponce, Shimkhada and Raub 13 ). In a cross-sectional multi-country study of adult non-pregnant women, the relationship between minimum wage and excess weight varied by country income level( Reference Conklin, Ponce and Frank 14 ). The unknown question that we therefore aimed to address is whether there is a relationship between minimum wage and weight status among adult women over time. We therefore used longitudinal data on national minimum wages and individual anthropometric measures in women, to examine longitudinally whether a country’s legally mandated minimum wage level is associated with the rate of change in underweight or obesity in LIC. We hypothesized that a modest rise in minimum wage ($10 per month) would alter the trend in women’s weight status outcomes.
Methods
Data sources and study sample
We used data on legally mandated minimum wage linked to individual anthropometry and sociodemographic characteristics over the period 2000–2014. National minimum wages (per month, adjusted for purchasing power parity (PPP)) for twenty-five LIC were year-specific, applied to private-sector workers and were constructed mainly from the International Labour Organization (ILO) Global Wage database, as detailed elsewhere( Reference Conklin, Ponce and Frank 14 ). Additional country-level statistics came from the World Bank (World Development Indicators), Heritage Foundation (Economic Freedom Index) and ILO (Global Employment Trends) databases.
Individual-level anthropometric and control variables came from the population-based Demographic and Health Survey (DHS), which collects nationally representative health and well-being data from young and adult women (13–49 years) approximately every 5 years in countries receiving US development funds. As only seven middle-income countries with policy data had multiple DHS surveys collecting anthropometry, we examined LIC only (defined based on World Bank income thresholds). There were twenty-four LIC with at least two cross-sectional DHS surveys conducted between 2000 and 2014, with varying intervals between measurements (mean 9 (sd 3) years) and providing sociodemographic information on 723 817 young and adult women. Of these, 521 155 were measured objectively for BMI over the study period. We excluded 187 216 young females (15–23 years) and 29 327 adult women who reported being pregnant, to examine non-pregnant adult women of working age with completed education and physiological development. The final sample included women with complete information for multivariable analysis (see online supplementary material, Supplemental Fig. 1). All participants provided informed consent and the DHS survey procedures were approved by the ICF International Institutional Review Board. Details of the sample are given in Supplemental Tables 1, 2 and 3 available online.
Measures
Exposure variable
National data on PPP-adjusted monthly minimum wage between 1999 and 2013 were used to examine minimum wages 12 months before the interview year when DHS surveys were conducted (2000–2014). The one-year time lag between minimum wage and weight status was used to allow for the non-instantaneous biological response to a policy-level factor on an individual’s weight status, and to ensure that the policy exposure occurred before the outcome. National minimum wage values were expressed in 2011 constant US dollars (constant$) to adjust for inflation, and were rescaled (dividing by 10) to interpret a 1-unit change in the predictor as an increase of $10 per month (country means in Supplemental Table 2).
Anthropometric outcomes
BMI (kg/m2) was calculated from objective measures of women’s body weight and height. BMI was examined as a dichotomous rather than a continuous outcome because the implications of a change in BMI depend on where a given value is located in the distribution; that is, differences in BMI at the threshold of a desirable outcome (between 18 kg/m2 and 19 kg/m2) cannot be compared with differences in BMI at the threshold of an undesirable outcome (between 29 kg/m2 and 31 kg/m2). Thus, underweight and obesity were examined as separate dichotomous outcome variables. Underweight was coded as 1=less than 18·5 kg/m2 and 0=18·5–29·9 kg/m2 (thus excluding obese women); and obese was coded as 1=30·0 kg/m2 or more and 0=18·5–29·9 kg/m2 (thus excluding underweight women). Sample sizes were n 150 796 and n 145 622, respectively.
Sociodemographic and country control variables
The underweight and obese outcomes were analysed with different concurrent sociodemographic variables to control for distinct risk factors because underweight and obesity are each generated by distinct sociobiological processes. Individual-level covariates for the underweight outcome included: age (years); marital status (single, currently/previously married (reference)); parity (having no children, 1–2 children, 3–5 children, 6 or more children (reference)); anaemia level (severe (reference), moderate, mild, not anaemic, unknown/missing); agriculture labour (yes (reference), no); education (no education (reference), primary, secondary, higher); geographic location (rural (reference), urban); employer type (someone else, family member, self-employed (reference)); and employment tenure (all year, occasional, seasonal (reference)). The underweight model included agriculture since women working as farmers are three times more likely to be underweight and are disproportionately more exposed to multiple risk factors for underweight, including physical stress, infections and toxic chemicals( Reference Vir 15 – Reference Kane and Dennerstein 17 ). Anaemia serves as a limited proxy for poor availability of nutrients which is not measured directly in the DHS but is another major risk factor of underweight in women in LIC; and, since Fe deficiency is aggravated by infections, the anaemia variable might also capture potential infections that could cause underweight. Models for the obesity outcome included the same covariates except for anaemia and agriculture, and had different reference groups (i.e. single, no children, higher education, urban location, work for someone else, work all year).
All models included the same macroeconomic control variables and were informed by the literature as previously reported( Reference Conklin, Ponce and Frank 14 ): market size (per capita gross domestic product, PPP-adjusted, 2011 constant$); public-sector health spending (as a percentage of total health expenditure); market-liberal regulatory structure (Economic Freedom Index); and waged/salaried workers (as percentage of adult female labour force). Country statistics were for one year (or closest available) prior to the year when DHS surveys were fielded in a given country.
Statistical methods
We first characterized the sample of countries and sample of women using summary statistics. We then fit multilevel mixed-effects logistic regression models using the statistical software package Stata version 14.2, with QR decomposition of the variance-components matrix (command ‘meqrlogit’). Specifically, we used a two-level model, with women nested within countries, that assumed a linear trend in the log odds of the outcome, underweight or obese status, over the study period. The data would not support a quadratic or other higher-order time trend because anthropometry was measured at only two (70 % of countries) or three (30 % of countries) time points per country. Country-specific random intercept and slope models were tested and indicated that a random slope for time was not needed as its variance was close to zero. Thus, we used a longitudinal multilevel model for change with random intercepts for country and common slope, which had several advantages, namely: estimating the initial level and conditional rate of change in the outcome; incorporating time-varying predictors and variably spaced measurement time points; treating time more flexibly; and enabling each estimate to borrow strength from the others in the small sample of countries( Reference Singer and Willett 18 ).
We fit a series of models beginning with the unconditional means model to estimate the variance components. The unconditional growth model served as the base model with random intercepts for country and a fixed effect for time. Next, to determine whether the time trend in the outcome depended on the value of the minimum wage, we added minimum wage and the interaction between minimum wage and time. Minimum wage was lagged by one year as previously described. Finally, we added the control variables for each outcome to determine whether results held up after conditioning on potential confounders. Models were fit centring time at 2013 so that the OR for minimum wage could be interpreted as the association of a $10 increase in the minimum wage with the outcome at the endpoint of the study period. To aide interpretation of our models, we graphed the predicted mean probability of being underweight, or obese, across the sample’s range of minimum wage values. The interaction between minimum wage and time was illustrated by graphing the associations for the start (2000) and endpoint of the study (2013). Predictions of average marginal effects were obtained by post-estimation calculation from the multilevel logistic regression coefficients at observed values of covariates (coefficients in the online supplementary material, Supplemental Tables 4 and 5). We also used post-estimation to calculate and graph the population-averaged adjusted prevalence difference (PD) for a $10 increase in minimum wage across the whole study period, with covariate values as observed.
As sensitivity analyses, we further adjusted the main models by adding an indicator for childbirth in the past year to check whether results were robust to recent gestational weight change. We also checked whether findings remained after including tobacco consumption (non-user (reference), user, unknown/missing (i.e. Armenia, Bangladesh, Ethiopia, Mali)); and separately after excluding countries identified as outliers based on Cook’s D influence statistic (Ethiopia and Madagascar for underweight; Lesotho for obesity). Finally, we recoded BMI to study overweight/obesity v. normal weight as an alternative outcome (1=25 kg/m2 and above, 0=18·5–24·9 kg/m2).
Results
On average, we found lower mean obesity prevalence with less variation (7·5 (sd 5·2) %) than overall levels of underweight in women in LIC (12·3 (sd 7·1) %). Obesity prevalence increased over time in most of these LIC (n 19, 79 %), while underweight prevalence typically decreased (n 14, 58 %; Supplemental Table 1). The proportions of underweight or obese women were unevenly distributed across categories of different socio-economic status variables (Fig. 1). Generally, the proportions of underweight women were largest among women who were uneducated, employed seasonally and by family, and from rural areas. By contrast, the proportions of obese women were largest among those who were urban, higher educated, employed all year and by someone else.
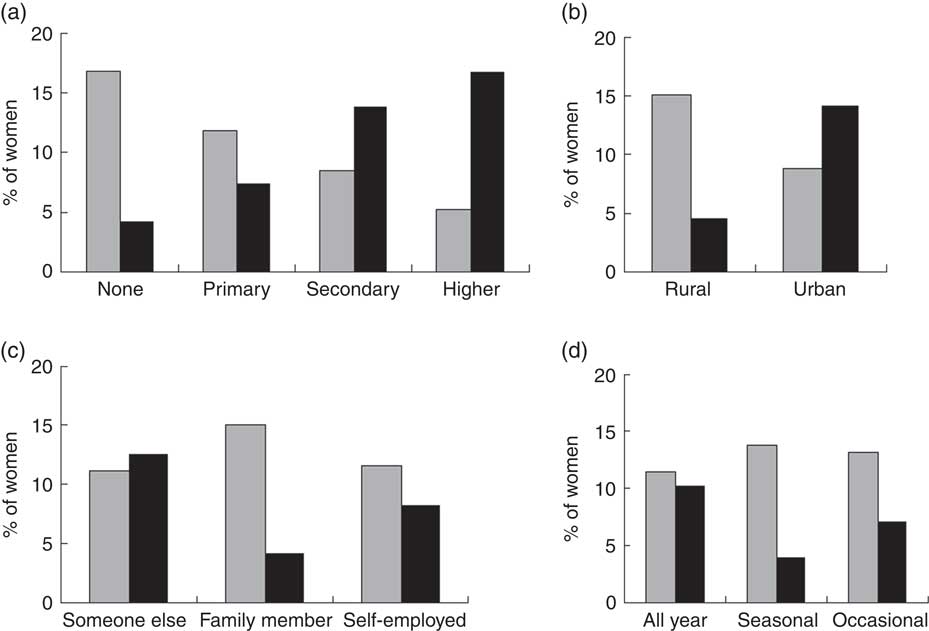
Fig. 1 Distribution of weight status outcomes (![]() , underweight;
, underweight; ![]() , obesity) across categories of women’s socio-economic status: (a) education, (b) geographic location, (c) employer type and (d) employment tenure, among 150 796 adult non-pregnant women in twenty-four low-income countries
, obesity) across categories of women’s socio-economic status: (a) education, (b) geographic location, (c) employer type and (d) employment tenure, among 150 796 adult non-pregnant women in twenty-four low-income countries
Table 1 OR (95 % CI) of underweight associated with change in minimum wage at study endpoint among 150 796 adult non-pregnant women in twenty-four low-income countries
Minimum wage was converted to 2011 constant US dollar values and adjusted for purchasing power parity. Time was centred at 2013; thus, the OR associated with minimum wage is interpreted as the effect of a $10 increase in minimum wage at the study endpoint. Significant results are shown in bold font.
Women in the sample were 35 years old on average and were predominantly married, had multiple children and limited or no education, lived in rural areas, were not anaemic or unknown status, were employed all year and for themselves, and came from countries with an overall mean minimum wage of $154·3 (sd 76; interquartile range 91·3; per month, PPP-adjusted, 2011 constant$). Countries varied widely in the amount of increase seen in the monthly minimum wage across 14 years (median $34·61), with 80 % of countries showing increases above $10 over the study period (range $6–117). In addition, the share of the female workforce that was subject to wages varied widely across countries from less than 5 % (Mozambique) to over 50 % (Armenia); and nearly 60 % of countries (14/24) had more than 10 % of the female working population receiving a wage/salary.
Rising minimum wage and change in underweight prevalence
The unconditional growth model showed that the annual rate of change in underweight was negative (OR=0·976; 95 % CI 0·972, 0·980), indicating a decrease in prevalence over time (Table 1). In multivariable mixed models, we found a weak interaction between minimum wage and time, indicating that with each additional year, a minimum wage increase was associated with an increasingly more negative impact on the prevalence of underweight (OR=0·999; 95 % CI 0·998, 0·999; P-interaction=0·02). We also found that the main association between minimum wage and underweight was significant at the end of the study (OR=0·984; 95 % CI 0·975, 0·993; Table 1).
Figure 2 shows the simple main association between higher wages and predicted mean probability of being underweight. It illustrates that there is more decrease in women’s underweight at higher wages and that the time trend in underweight depended on the value of the minimum wage. In other words, there was a more pronounced difference in underweight prevalence between low and high levels of minimum wage at study end (2013) than at the start (2000).
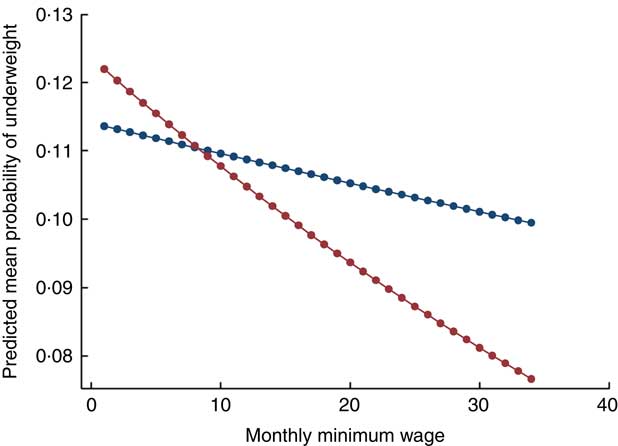
Fig. 2 (colour online) Main association of monthly minimum wage and predicted probability of underweight among 150 796 adult non-pregnant women in twenty-four low-income countries in 2000 (![]() ) and 2013 (
) and 2013 (![]() ). Minimum wage was converted to 2011 constant US dollar values and adjusted for purchasing power parity
). Minimum wage was converted to 2011 constant US dollar values and adjusted for purchasing power parity
In further post-estimation of the final model, we also found that a $10 increase in monthly minimum wage was associated with an average decrease of about 0·04 and 0·14 percentage points in the predicted probability of underweight in 2000 (PD=−0·04; 95 % CI −0·15, 0·06; P=0·41) and in 2013 (PD=−0·14; 95 % CI −0·23, −0·05; P=0·002), respectively.
Rising minimum wage and change in obesity prevalence
From the unconditional growth model, we found that the annual rate of change in obesity was positive (OR=1·03; 95 % CI 1·02, 1·03), indicating a time trend of increasing prevalence of obesity. There was no significant interaction between time and minimum wage, but there was a weak positive main association between minimum wage and likelihood of obesity (OR=1·02; 95 % CI 1·01, 1·03 in adjusted model; Table 2). Figure 3 illustrates how higher values of minimum wage are associated with higher obesity prevalence and that minimum wage does not alter the trend over time. Additional post-estimation revealed that a $10 increase in minimum wage was associated with an average increase of about 0·1 percentage points in the predicted probability of being obese in both 2000 and 2013 (PD=0·11; 95 % CI 0·03, 0·19 and PD=0·12; 95 % CI 0·04, 0·20, respectively).
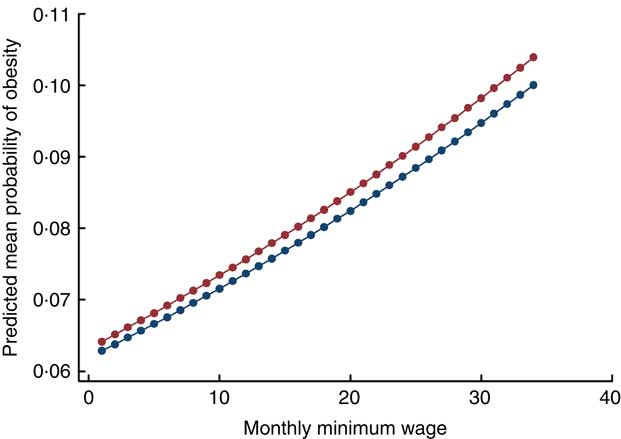
Fig. 3 (colour online) Main association of monthly minimum wage and predicted probability of obesity among 145 622 adult non-pregnant women in twenty-four low-income countries in 2000 (![]() ) and 2013 (
) and 2013 (![]() ). Minimum wage was converted to 2011 constant US dollar values and adjusted for purchasing power parity
). Minimum wage was converted to 2011 constant US dollar values and adjusted for purchasing power parity
Table 2 OR (95 % CI) of obesity associated with change in minimum wage at study endpoint among 145 622 adult non-pregnant women in twenty-four low-income countries
Minimum wage was converted to 2011 constant US dollar values and adjusted for purchasing power parity. Time was centred at 2013; thus, the OR associated with minimum wage is interpreted as the effect of a $10 increase in minimum wage at the study endpoint. Significant results are shown in bold font.
Sensitivity analyses showed that results for both underweight and obesity persisted after including additional potential confounders and removing outlier countries with high Cook’s D. Two covariates (age and percentage waged) became non-significant in the underweight model after removing outlier countries, while the interaction of minimum wage with time showed stronger significance levels. Results for overweight and obesity showed similar associations to main findings for obesity (data not shown).
Discussion
The present longitudinal study contributes novel evidence on the association between minimum wage and both obesity and underweight among adult women in LIC. A $10 rise in monthly minimum wage was associated with a greater rate of change in the decline in underweight levels in women, but was not associated with the rising trend in obesity. In other words, results supported only part of our hypothesis that minimum wage would alter the slope of declining underweight in low-income settings.
To put these findings in context, we considered Cambodia as an example LIC with a mean gross domestic product closest to the sample’s mean and a common LIC pattern of high underweight (>15 %) and low obesity (<5 %). Based on the population size of adult women aged 25–49 years (2 550 043), a $10 rise in monthly minimum wage would result in fifty more obese women (41 311×0·0012), counterbalanced by 610 fewer underweight women (436 057×(−0·0014)). While the associated lessening in undernutrition rates was small, it was significant even when the changes in minimum wage over time were quite modest. Greater improvements in minimum wage could have a more substantial effect so long as they are not so large as to cause changes in availability of employment. These findings with respect to minimum wage suggest how this policy lever might contribute to addressing underweight in key regions where there remains a substantial prevalence. Our findings further indicate that improving minimum wages may need to be paired with parallel policies that address obesogenic environments.
The role of labour market policy as a social determinant of health is only beginning to be studied( Reference Braveman, Egerter and Williams 5 ) and evidence on employment conditions affecting weight is particularly limited( Reference Meltzer and Chen 10 , Reference Friel, Chopra and Satcher 19 ). Only one recent cross-sectional study of twenty-seven low- and middle-income countries examined minimum wage and weight status among women, while accounting for several individual socio-economic variables( Reference Goryakin, Lobstein and James 20 ). That study reported an average increase of 0·03 percentage points in women’s obesity associated with a 1 % increase in minimum wage in sixteen LIC, which is similar to our finding of 0·1 percentage points greater obesity prevalence associated with a $10 rise in monthly minimum wage in twenty-four LIC. Importantly, this relationship is unlikely to be sustained as LIC develop economically because minimum wage was inversely associated with women’s obesity among middle-income countries. Indeed, the change in direction from an increase in overweight to a decrease across economic development was observed in another study of economic globalization and weight status in young and adult women. Moreover, although findings are mixed with regard to obesity( Reference Fernald, Gertler and Hou 21 , Reference Leroy, Gadsden and González de Cossío 22 ), other research on selected middle-income countries further points to the potential for improved weight, nutritional and health outcomes when economic policies are amended to better support citizens financially( Reference Case 23 – Reference Galicia, de Romaña and Harding 26 ). Additional longitudinal data on middle-income countries are needed to examine whether raising minimum wage slows the growth in obesity among women as countries develop economically.
Our study revealed a relationship between minimum wage and underweight in women in a development context. More specifically, we showed that a $10 rise in monthly minimum wage was associated with lower prevalence of underweight among adult women that strengthened over time and remained after several robustness checks. Previous work has examined minimum wage in low- and middle-income countries in relation to child malnutrition within a household resource allocation framework. One longitudinal study found an overall harmful association with child stunting from gestational exposure to minimum wage, but underweight and overweight were grouped on a continuous Z score and there were regional differences in results, with adverse outcomes found in South Asia and improved outcomes in Latin America( Reference Majid, Mendoza Rodríguez and Harper 12 ). In another multi-country longitudinal study, countries with a 10 % or more increase in PPP-adjusted minimum wage showed a significant decline in stunting, and anthropometric failure (and a non-significant decline in underweight and wasting), compared to countries without a policy change( Reference Ponce, Shimkhada and Raub 13 ). Future research should assess whether our findings for underweight persist in middle-income countries.
Our results have several potential explanations. The decrease in underweight prevalence is likely due to a reduction in food penury and extreme poverty. Additional dollars from raised minimum wage would enable women in a poor and malnourished context to purchase more kilojoules, thereby providing adequate energy to increase body weight( Reference Deaton 27 ). A rise in minimum wage would directly affect women if they or other household members are working at minimum wage, but also indirectly affect households with earners earning just above the minimum wage who would also receive raises as a ‘ripple effect’( Reference Leigh 28 ). Moreover, there are studies indicating that shadow minimum wages in the informal economy increase after national minimum wages rise( Reference Maloney and Nunez Mendez 29 , Reference Boeri, Garibaldi and Ribeiro 30 ). In addition, an increase in wages could affect body weight through improved psychosocial well-being and reduced income inequality( Reference Leigh 28 ). In terms of obesity prevalence, the observed increase from higher minimum wage might be explained by rising wages contributing to increased energy consumption, to changes in physical activity levels, or to broad external factors (e.g. technological change, infrastructure availability and others) that could each affect both changes in minimum wage and changes in obesity( Reference Goryakin, Lobstein and James 20 , Reference Lakdawalla and Philipson 31 ).
Limitations
Our measure of national minimum wage is not without limitations since we lacked information on policy enforcement and implementation reach. Moreover, minimum wage may not be binding for large parts of the female working population who are not salaried, particularly women who are self-employed or employed in the informal sector. The smaller size of the impact, relative to the magnitude of the problem, is likely indicative of the fact that many of the poorest in LIC remain out of reach of the formal-sector minimum wage. Nevertheless, we included ILO information on the share of a country’s female workforce that is waged or salaried to account for between-group differences in the proportion of women who might be unaffected by a minimum wage protection. It was also not possible to interrogate gender differences because DHS surveys rarely measure BMI in men; nor could we assess differences between mandated minimum and prevailing market wage. The observational nature of our longitudinal study means that we also cannot conclude causality, although reverse causality was diminished by using a lagged predictor.
Our modeling approach was able to detect an association of minimum wage with adult women’s anthropometric outcomes, which had an underlying global trend of rising obesity and declining underweight. Although our models controlled for micro-level and macro-level background socio-economic conditions in each country that might affect weight status, our models do not account for other potential external influences. In particular, we lacked data on coincident changes in social safety interventions, such as cash transfer, agriculture and microfinance programmes, that could affect weight outcomes. Thus, there is potential for residual confounding from individual income not measured in the DHS, as well as from unobserved country factors (e.g. technology change, infrastructure availability, etc.) that change over time. It is possible that within each country the change in minimum wage may be a repercussion of changes in the ruling political party or vice versa. However, we have addressed some important confounding by including four economic development factors that may explain some unmeasured labour market features.
Loss of adult women from the eligible sample who were dropped from analyses due to missing anthropometry and covariate data could have induced non-response/selection bias. The anthropometric data, available for only two or three time points for each country, were relatively sparse to support our conclusions about time trends and hence our results should be interpreted with caution. Finally, the sample of non-pregnant women aged 24 years or more in LIC limits generalizability of findings to similar sub-populations in similar development settings.
Strengths
Our study has several strengths favouring the validity of our findings, including: nationwide probabilistic samples and the large number of individual observations; comparability of measured outcomes; range of country economic development level and geographical regions; highly standardized data collection procedures; multiple potential confounders; and multilevel one-year time-lagged analyses. Multilevel statistical techniques provide a technically robust framework to address some unobserved natural heterogeneity across countries and are pertinent when predictor variables are measured simultaneously at different levels. Moreover, results were robust to alternative model specifications.
Conclusion
The present longitudinal study revealed that a modest increase in minimum wage appeared to accelerate the reduction in underweight, but did not alter obesity trends, among adult women in twenty-four LIC examined over 14 years. Findings suggest that this policy lever might help reduce underweight among LIC where this health outcome is of particular concern. Future natural experiments such as from a phased implementation design could better establish a causal relationship of the potential role of this labour market policy on a key Sustainable Development Goal.
Acknowledgements
Acknowledgements: The authors wish to thank José M. Mendoza Rodríguez for preparing and linking the data files for analysis. They also appreciate statistical support and expertise from the UCLA IDRE Statistical Consulting Group. Financial support: This work was supported by the Canadian Institute for Health Research Postdoctoral Fellowship Award (MFE-135520); the Canadian Institutes of Health Research Operating Grant, ‘Examining the impact of social policies on health equity’ (ROH-115209); and the Hilton postdoctoral scholars programme at the WORLD Policy Analysis Center of UCLA. No sponsors participated in the study design, data analysis, interpretation of results or manuscript submission. Conflict of interest: The authors declare no conflict of interest. Authorship: Contributed essential policy database: A.N., J.H. and J.F. Acquired necessary funding: A.I.C. and J.H. Conceived and designed the project: A.I.C., J.H. and N.A.P. Conceived and designed the analysis: A.I.C. and C.M.C. Conducted the research and performed statistical analysis: A.I.C. Analysed and interpreted the data: A.I.C., N.A.P. and C.M.C. Drafted original manuscript: A.I.C. Edited and revised the paper: A.I.C., N.A.P., C.M.C., J.F. and J.H. Ethics of human subject participation: Not applicable.
Supplementary material
To view supplementary material for this article, please visit https://doi.org/10.1017/S1368980017003433


