


1. Introduction
A nautical chart is one of the most essential tools available to the mariner, being the key to safe navigation. It provides a visual representation of information that is vital to mariners for safe navigation. Nautical charts are available in analog form as paper charts or digitally as electronic charts. Traditional nautical charts are constructed on large paper sheets at different scales. Paper charts have been used continuously over many centuries (Hudson, Reference Hudson2000). However, with technological advancement, paper charts have been replaced by ENCs with all the benefits of the digital world in the storage, manipulation, and retrieval of data (Pais, Reference Pais1998). Electronic Chart Display and Information System (ECDIS) converts the ENC into its native system ENC format and within it, the features and their attributes can be selectively displayed and queried. ECDIS is designed to replace traditional nautical charts, with significant benefits in navigation safety and improved operational efficiency (Weintrit, Reference Weintrit2009).
1.1 The need for standards
The need for standards in hydrographic data becomes more and more important because of the increasing costs, difficult fieldwork, and time-consuming manual work in the collection of data. It also requires exchange between hydrographic offices (HOs) and government departments to minimise repetition and redundancy of efforts and costs and to preserve the latest version of the information on all HO products. The use of digital data was initially introduced into paper chart production and it became necessary to exchange digital data between HOs. In 1977, the idea for the international hydrographic community to address digital data formats began, based on a proposal made by the Australian Hydrographic Office. The International Hydrographic Organization (IHO) Committee on the Exchange of Digital Data (CEDD) was created in 1983, and in 1986 it introduced a format for the exchange of digital hydrographic data which was originally known as the CEDD format. Later, it was designated as the IHO DX 87 format. After considering the need for electronic charts, the Committee on ECDIS (COE) and CEDD held joint meetings and developed an entirely new format which was known as IHO DX 90 in 1989. Version 2 was released by the IHO in March 1994 and the product specification requirements were confirmed at the sixth meeting of the COE in November 1994. Edition 3.0 of the IHO Transfer Standard for Digital Data (S-57 Publication) was published in March 1996 after some alterations. It is the primary standard for digital hydrographic data which is used for ENC production. The S-57 standard was immutable for four years from 1996. During this freeze period, additional attribute values that are required for ENC purposes were recognised, which were not specified in edition 3.0. Therefore, the new edition of S-57, edition 3.1, was published in 2000 (IHO S-57, 2000).
1.2 International Maritime Organization requirements for the carriage of nautical charts
More than 80% of world trade is distributed by global shipping to people and countries around the globe. Shipping is the most efficient and cost-effective method of transportation, and the world relies on it as a safe, secure, and efficient industry. The regulatory framework developed and maintained by the International Maritime Organization (IMO) confirms its reliability. Measures of IMO provide comprehensive concepts for worldwide shipping aspects, such as ship design, construction, equipment, manning, operation, and disposal. In 1974, the Member States of the IMO adopted the Convention for the Safety of Life at Sea (SOLAS) together with successive amendments. SOLAS Chapter V specifies the requirements for the navigational equipment to be used onboard ships. It is important as it mandates that all vessels must be equipped with the most up-to-date nautical charts and publications (IHO S-66, 2018).
SOLAS Chapter V includes 35 regulations. The relevant regulations for the carriage of nautical charts are as follows.
• Regulation 2: Defines the nautical chart.
• Regulation 19: Defines the equipment (including charts) to be carried on various types of vessels.
• Regulation 27: Defines the requirement of maintaining updated charts and publications.
Those regulations indicate that, based on the class of vessel, the requirement to carry charts can be achieved by:
• Carriage of official and updated paper charts; or
• Carriage of a type-approved ECDIS which follows the requirements of the IMO ECDIS Performance Standards supplemented by an appropriate backup arrangement, and up-to-date ENCs.
After certain amendments, SOLAS Chapter V, Regulation 19, paragraph 2.10 defines the ‘Carriage requirements for shipborne navigational systems and equipment’, and the obligation to adopt ECDIS as the primary method of navigation by ships according to their types and sizes. The period for adoption of ECDIS was finalised in July 2018 (IHO, 2020).
The need for a backup arrangement is specified under paragraph 2.1.5 of Regulation 19. It specifies that an adequate set of paper nautical charts can be utilised as a backup for ECDIS and that other backup arrangements for ECDIS are acceptable. In addition, IMO Resolution MSC.232(82), ‘Revised Performance Standards for ECDIS’, specifies the backup requirements in case of an ECDIS failure. As Figure 1 illustrates, according to a survey conducted by the IHO Nautical Cartography Working Group to analyse the backup carriage requirement for commercial vessels on domestic voyages, paper charts are still placed at the top by mariners (IHO, 2020).

Figure 1. Backup carriage requirement (Source: IHO (2020), p. 11)
It has been assumed that interest in paper charts will decrease as the mandatory utilisation of ECDIS expands. This was examined in the paper ‘Future Interest for Paper Nautical Charts’ (HSSC5-INF7), submitted to the IHO Hydrographic Services and Standards Committee by the Australian Hydrographic Service in 2013, immediately after the requirement to be equipped with ECDIS technology was applied to the first vessel types. Indeed, the decline began even earlier. Between 2008 and 2018, the marketing and utilisation of paper nautical charts dropped by nearly half, whereas the utilisation of ENCs increased about sevenfold in the same time period (Figure 2).

Figure 2. Sales of ENCs and paper charts, 2008–2018 (Source: IHO (2020), p. 32)
The demand for paper charts today tends to be for use as ECDIS backup charts and from leisure cruisers and other merchant vessels for which ECDIS is not required, and also for interior wall decoration, such as in seaside cottages and hotels. It is unknown whether these customers will continue to buy paper charts and for how long. As the cost of chart plotters and other ENC display equipment diminishes and the usability of ENCs increases, even more mariners might move to electronic charts. Some of the factors that make ENCs so engaging to the user are also contributing to the obsolescence of paper charts, such as the convenience of distributing updates. It is expected that ENCs will increase in popularity with the ability to interoperate with other navigationally important datasets, such as S-100-based products. In addition, ENCs will be a core component of the evolving e-Navigation concept, and also part of applications required by different hydrographic communities. Therefore, ENC production must be accurate, quick, and frequent.
One remaining advantage of paper nautical charts is their comprehensive coverage of waterways, whereas ENCs have inadequate coverage. As a result, the availability of ENCs to cover the entire globe's water and the feasibility of using ECDIS in practice are still limited. However, paper charts can be used to produce ENCs as a reliable compilation source (Hudson, Reference Hudson2000).
1.3 Responsibility for producing ENCs
The HO of each country (IHO, 2023) provides the ENC service that includes the provision of ENCs, their production, distribution, and updates. This service should meet the needs of international shipping while adhering to applicable IMO resolutions and IHO standards (Leder, Reference Leder2005). The national HO and government are directly responsible for the quality and accuracy of their products. The principles of the Worldwide Electronic Navigational Chart Database (WEND) specify the responsibility of HOs for the production and distribution of ENCs.
The responsibilities of HOs are as follows (IHO S-65, 2017).
• The preparation and provision of digital data and its subsequent updating for waters of national jurisdiction.
• Ensuring that mariners, anywhere in the world, can obtain fully updated ENCs for all shipping routes and ports across the world and that their ENC data are available to users through integrated services.
• Assuring the high quality of ENC services through the use of a quality management system that is certified by a relevant body as conforming to a suitable recognised standard, typically ISO 9001.
• Ensuring compliance with all relevant IHO and IMO standards and criteria (including IHO S-57, IHO S-52, or their replacements).
• Providing timely updates to the ENC for the mariner; these should be at least as frequent and timely as those provided by the contracting government for the correction of paper charts.
1.4 ENC production
Many studies have been published on ENC production. Pais (Reference Pais1998) studied the production of ENCs with the tools from Universal Systems Limited (USL) CARIS and OBMAN. Tsoulos and Stefanakis (Reference Tsoulos and Stefanakis2015) investigated a possible approach to addressing the chart design and composition process. An expert system (Elements Environment) interfaced with GIS has been used to accomplish that approach. Manteigas (Reference Manteigas2004) evaluated the CARIS Hydrographic Production Database in the production of paper charts, ENC, and additional military layers (AML).
There are also some studies on the problems related to ENCs. Socha (Reference Socha2012) experimented with specifying requirements for the automatic generalisation of ENC. As the outcome of that research, complex structures were built in ArcGIS to satisfy the chart generalisation criteria. Hippmann (Reference Hippmann2012) studied the production and validation solutions for improving ENC consistency and production guidelines that result in greater consistency of ENC data have been proposed.
A variety of software packages to produce ENCs are available, such as ArcGIS Maritime: Charting, OceanWise Maritime Toolbar ENC Writer Extension, SevenCS ENC Designer, CARIS S-57 Composer, etc. There are some differences in performance and available operations among them. However, the technology has been evolving and the ENC production processes are being continuously updated. CARIS S-57 Composer software has been used to compile the ENC in this study.
1.5 Difference of symbology between ENCs and paper charts
The various ENC production softwares all use the same symbology. However, ENC symbology is different from paper chart symbology. The difference is that a paper chart is static and all the information relevant to safe navigation must be compiled and portrayed at the time the chart is published. Thus, paper charts use more different types of symbols (and text labels) to differentiate differences in similar features. In contrast, ENCs are quarriable databases. ECDIS systems that display ENCs use the IHO S-52 symbology specification to portray the data, which has fewer symbols. The expectation is that a mariner may interrogate the ENC data with a mouse click to gain more information about an anchorage, restricted area, etc., if necessary. Therefore, unique ENC symbols do not exist for all paper chart symbols.
Most of the world's ENCs were digitised from paper charts and S-57 ENC attributes were encoded using information present on the raster charts. Those are presented in the resulting ENC data, even if it is not presented graphically on a display screen. For example, paper charts show a rock that ‘covers and uncovers’ and a rock ‘awash at chart datum’ with different symbols, but ECDIS will show both with the same symbol. However, the S-57 WATLEV (water level) attribute provides more information on the nature of the rock within the ENC database, specifically whether it ‘covers and uncovers’ or is ‘awash’.
When an ENC is viewed in ECDIS, some mariner-defined settings can alter the view of the ENC chart. Safety depth and safety contour are both user-defined values that can generate a different display of the ENC object based on its value of sounding. If the mariner inputs under keel clearance (UKC) of 12 m for the safety depth and safety contour, all rocks, wrecks, and obstructions in the safe water will have the value of sounding checked, and if it is shallower than 12 m, it will be displayed as an isolated danger mark (Figure 3). But if the depths are deeper than the safety depth, the objects will be displayed as non-dangerous objects. Figure 4 demonstrates how the ECDIS display looks with Isolated Danger of depths less than the safety contour.

Figure 3. Symbol for isolated danger of depths less than the safety contour

Figure 4. ECDIS display with isolated danger of depths less than the safety contour
The different attributes of objects in the same ENC display can be found when doing a ‘pick’ report in ECDIS. A listing of all objects at that position and a sub-list of all the attributes that apply to each object can be acquired by clicking an object on the ENC (a cursor pick). The format of the report and how it displays on the screen depends on the electronic charting system and ECDIS in use. To obtain a pick report with correct attribute values, those values should be filled correctly in the ENC. When utilising paper charts for ENC production this should be a matter of concern.
The content of an ENC is mainly an object-oriented database, consisting of 200 classes of spatial objects and 185 classes of feature objects that are used for the location and description of real-world entities (Palikaris and Mavraeidopoulos, Reference Palikaris and Mavraeidopoulos2020). The appropriate object class, attribute, and attribute values are given by CARIS S-57 Composer to define a real-world object. The Admiralty Guide for ENC symbols (UKHO, 2012) is an essential publication produced by the United Kingdom Hydrographic Office (UKHO). It provides descriptions and graphics of traditional and simplified symbols. Therefore, it guides producers to identify the correct symbol according to the requirement. After that, this symbol must be taken onto the ENC display, and to do that the relevant object and attributes of the corresponding symbol should be filled correctly under the Select Object/Attribute Dialog Box. Sometimes, there is the same ENC symbol for different paper chart symbols. Therefore, the ENC designer should be very careful about filling in object and attribute values. If there is any mistake in the object or attributes of any symbol, an incorrect symbol will appear. This makes it a very time-consuming and exhausting process. Therefore, this study aims to develop a new tool to supplement the efficient compilation of ENCs utilising paper charts.
2. Methodology
In this study, a paper chart is primarily used to produce an ENC utilising CARIS S-57 Composer. The flowchart depicted in Figure 5 illustrates the steps of the methodology used in the research. First, an ENC product for the harbour of Galle, Sri Lanka, was produced using CARIS S-57 Composer. Typically, there are five main steps to the procedure, as described in the following sub-sections.

Figure 5. Conceptual methodology
2.1 Create a new product
The new ENC product was created with the assistance of the product creation wizard in Composer S-57 (Figure 6). Product type (ENC, AML, MIO, Inland ENC, etc.), product name, issue date, purpose, datum, scale, extent, and export details were defined under the series of dialog boxes.

Figure 6. Product creation wizard
2.2 Import external data
The digital data were then selected and imported into the newly created Composer product by digitising on the georeferenced raster (TIFF) image of the paper chart for Galle Harbour (Figure 7). First, the required S-57 object and attribute values were selected, and then the features were positioned as point or line or polygon by digitising on the screen (Figures 8 and 9), snapping to other features, or typing known coordinates.

Figure 7. Paper chart of Galle Harbour (Source: NHO Sri Lanka)

Figure 8. Create new features as point, line, area or sounding

Figure 9. Digitising
2.3 Add/modify product-specific features
The next step is to add any required product-specific features or edit attributes or spatial values as needed. Therefore, all the required metadata objects were digitised and minimum display scale attribute values were assigned. In addition, all the unwanted features were deleted. Depth contour, coastline, shoreline construction, depth area, land area, building, road, bridge, seabed area, wreck, underwater rock, and sounding were some of the product-specific features added to this Composer product. When adding features to the product, relevant attribute values for the specific feature should be assigned in the Select Object/Attribute dialog box (Figure 10). In this step, difficulties in assigning symbols were identified and, to overcome these and verify symbol identification, a new web application named SYMO EXPERT was developed. This is further explained below in section 2.6.
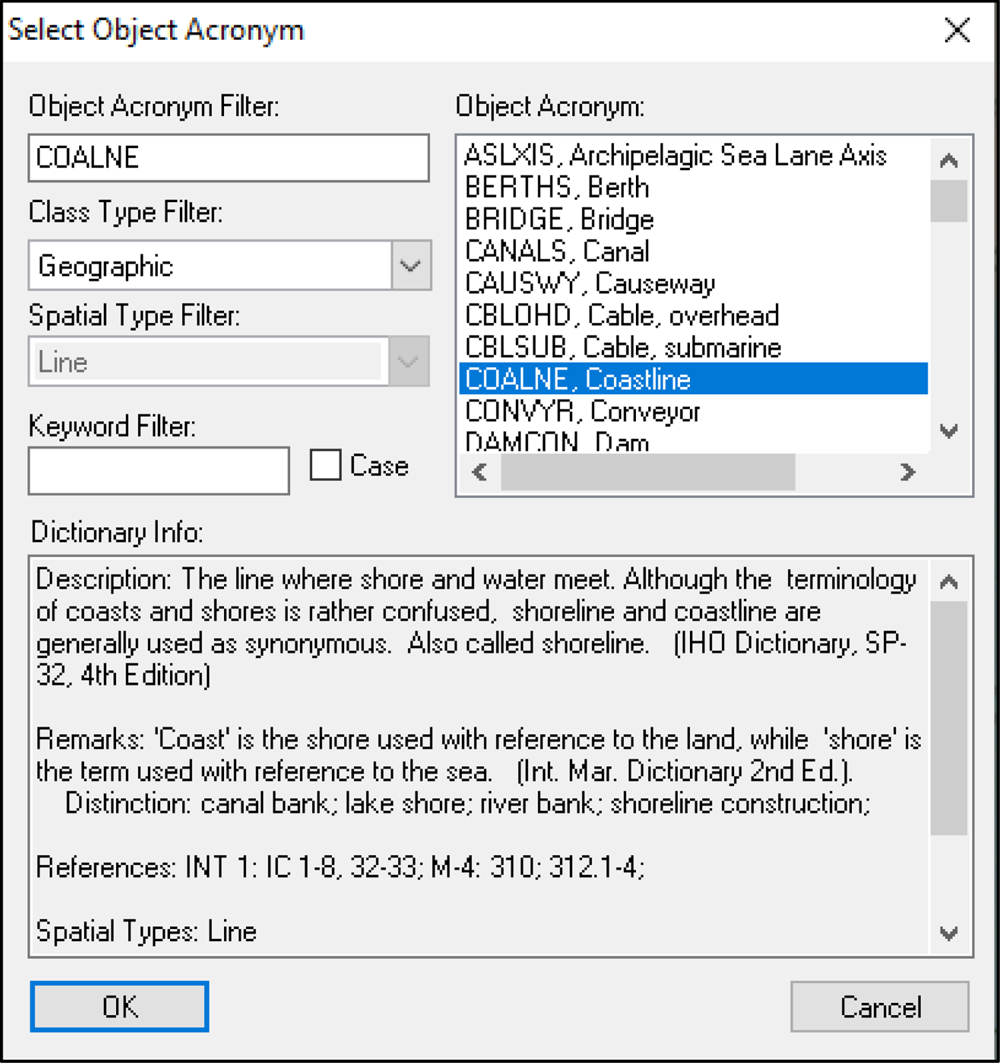
Figure 10. ‘Select Object Acronym’ dialog box
2.4 Run validation checks
Validation checks were performed on positions and attribute values, S-57 data structure, the logical consistency of features, and feature geometry (Figure 11). A list of warnings and errors was generated with hyperlinks to the reported features. Errors must be corrected and warnings must be examined. Optionally, customised tests were also executed. In this production, all the errors became zero at the end of the validation checks.

Figure 11. Running validation checks
2.5 Create exchange set
Finally, the validated product was exported to create an S-57 exchange set (Figure 12). This is the official product version which is ready for distribution to end-users for electronic navigational purposes.

Figure 12. Product exported to IHO S-57 format
2.6 Developing a new web application
The new web application named, SYMO EXPERT, was developed with the Firebase Realtime Database and React app. The database for the app was created using Firebase Realtime Database by adding paper chart symbols, attribute values, and ENC symbols (Figure 13). All the paper chart symbols and ENC symbols were uploaded to the Firebase storage at the initial stage (Figure 14). Codes were written to connect all the components and for the functioning of the app. As mentioned in the activity diagram (Figure 15), the web application was facilitated with the Search option. Therefore, letters or keywords can be searched and the results will pop up on the screen (Figure 16). The layout of the interface then appeared as shown in Figure 17.

Figure 13. Firebase database – entering data to the database

Figure 14. Firebase storage – uploading images of symbols to the database

Figure 15. Activity diagram for SYMO EXPERT

Figure 16. ‘Search’ option in the web application

Figure 17. Layout of the interface
The codes for showing the paper chart symbols, attribute values, and ENC symbols were encoded to pop up after clicking on the selected paper chart symbol. The pop-up window of the SYMO EXPERT is represented in Figure 18.

Figure 18. Pop-up window showing paper chart symbol, ENC symbol, and attribute values in the web application
2.7 Verification and validation of final product
The ENC product was sent to the UKHO for further clarification, and a questionnaire was prepared to collect data about the time factor and accuracy of using Admiralty Guides (UKHO, 2012, 2020) and SYMO EXPERT. The questionnaire was tested with cartographic experts at the national HO of Sri Lanka and a group of undergraduate students who are following the Surveying Sciences degree programme specialising in Hydrographic Surveying at Sabaragamuwa University of Sri Lanka. It was distributed in an electronic version, enabling all participants to submit the completed questionnaire online.
3. Results analysis and discussion
Figure 19 depicts the official product version prepared for distribution to end-users for the purpose of electronic navigation. It adheres to the IHO S-57 standard, which specifies the precise format for manufactured data.

Figure 19. Final ENC product for Galle Harbour
The product was run through the S-58 validation software at the UKHO to see how the cell conforms to the S-57 ENC product specification. The execution of S-58 validation checks is shown in Figure 20.

Figure 20. Running S-58 validation on the final product
According to the Producer Feedback Report, there were two issues (Figure 21).
• There was a missing attribute for the category of bridge. (This would only need to be encoded if a bridge is over navigable waters.)
• The agency codes must be the same throughout the whole cell. The code in the DSID.AGEN field did not match that of the FOID.AGEN fields of many objects.

Figure 21. Errors found from validation – no attribute value for category of bridge
All of the other features were encoded correctly. After referring to the above two issues and taking necessary actions to correct them, the ENC production was successful.
Figure 22 shows the SYMO EXPERT that has been introduced through this study to ease the symbol identification process. For SYMO EXPERT, frequently used symbols have been selected and categorised alphabetically, according to the UKHO categorisation. Under each letter, it shows paper chart symbols and for each paper chart symbol, there are correct object acronyms and attribute acronyms which are to be assigned under CARIS Select Object/Attribute dialog box to display the correct ENC symbol. Furthermore, it displays the relevant ENC symbol (Figure 23).

Figure 22. Interface of the web application – SYMO EXPERT

Figure 23. After clicking on the relevant paper chart symbol – pop-up window
Since there are pictures of paper chart symbols, it will be easy for users to match with the symbols that there are on the paper chart which is utilised for ENC production. There is a Search option in SYMO EXPERT that justifies the user-friendliness of the application.
The questionnaire results were examined using Microsoft Excel to analyse the differences visually and statistically. The results of the questionnaire are presented in Figures 24–26.

Figure 24. Comparison of average time for using SYMO EXPERT and Admiralty Guides

Figure 25. Accuracy – Admiralty Guides

Figure 26. Accuracy – SYMO EXPERT
The calculated average time component is shown in Figure 24. Statistical analysis indicates that approximately 3 min can be saved by using SYMO EXPERT. The accuracy of selected symbols from Admiralty Guides and SYMO EXPERT were also calculated. Figure 25 represents the accuracy of selected symbols from Admiralty Guides and Figure 26 represents the results of accuracy for SYMO EXPERT. As Figures 25 and 26 illustrate, the accuracy of the selected symbols from Admiralty Guides is 95% and from SYMO EXPERT it is 98%. Therefore, it reveals that both methods are accurate. But, when considering the average time component (Figure 24), SYMO EXPERT takes about 1 min and Admiralty Guides take about 4 min for the identification process.
4. Conclusion
Paper nautical charts are the most readily available data source that can be used to produce ENCs. A new ENC for Galle Harbour was one of the main results of this research, which we produced utilising the paper chart by following IHO standards with CARIS S-57 Composer. The final product, LK5GLHBR, was obtained by following seven steps: scanning, geo-referencing, creating a new product, importing external data, adding/modifying product-specific features, running validation checks, and exporting the product to S-57 format. Validation checks were made to confirm the validity of the ENC by controlling the quality. The zero error at the end of the executed quality control tests was the certification to export the product to S-57 format. Sixty-four isolated nodes, 543 connected nodes, 596 edges, four meta-features, 474 geographic features, and one collection feature were successfully exported to the IHO S-57 format. Ultimately, the LK5GLHBR.000 file was created under the ENC_ROOT folder which is inside the Exports folder. The exported ENC was updated by adding more product-specific features, again exported and the LK5GLHBR.001 file was created.
A new web application, SYMO EXPERT, was the final main result of this study. It is created as an external application that can be used to identify symbols easily. Symbols that are often used in charts have been selected and categorised alphabetically, according to UKHO categorisation. Thus 319 symbols were selected and imported into the web application. Paper chart symbols are displayed under each letter, and for each symbol, there are correct object and attribute acronyms that must be assigned in the Select Object/Attribute dialog box. To display the relevant ENC symbol, users will find it easy to match the symbols on the paper chart that is used for ENC production because there are pictures of paper chart symbols. When producing ENCs utilising paper charts, symbols must be correctly assigned to give the correct meaning. Paper chart symbols are different from ENC symbols. After identifying the paper chart symbol, it should be taken on to the ENC display by filling in the relevant object and attributes of the corresponding symbol under the Select Object/Attribute dialog box. However, the software uses the same symbol for different purposes. Therefore, a supportive tool named SYMO EXPERT was developed for assigning symbols in ENC to make the compiling procedure more effective and efficient.
Based on the questionnaire results, using SYMO EXPERT takes around 1 min to find the relevant symbol, while using Admiralty Guides it takes around 4 min. Therefore, the research has justified that the web application is an easy, digital, time-saving manual for ENC production.
This research was limited to 319 symbols. Therefore, some symbols cannot be found in this web application. The web application can be further developed for scanning the paper chart symbols and obtaining the corresponding ENC symbols and attribute values.
Acknowledgements
The authors would like to acknowledge the support given by the National Hydrographic Office, NARA in providing the necessary data and guidance in conducting the study successfully, and UKHO for the great support for ENC production and providing a feedback report after validating the production.


