


1 Introduction
A majority of U.S. households owns pets: 48 % own dogs and 37 % own cats (APPA, 2018). People spend substantial amounts of money on pets, which they often view as beloved companions or even family members (Schwarz et al., Reference Schwarz, Troyer and Walker2007; Kirk, Reference Kirk2019). In 2017, households in the USA spent over $69 billion dollars on pets, including over $17 billion on veterinary care (APPA, 2018). These expenditures suggest that Americans place substantial value on their pets. But, what monetary value do they implicitly place on the lives of their pets when making decisions that affect the mortality risks that their pets face? We seek to answer this question for pet dogs.
The value of statistical life (VSL), an estimate of the average dollar value people in some population appear to place on their own lives when making decisions that involve mortality risk, plays an important role in U.S. health and safety regulation as the shadow price for avoided fatalities. Numerous estimates of the VSL have been made based on revealed preferences, especially wage premiums demanded for riskier jobs, and on stated preferences, such as expressed willingness-to-pay for safety devices (Viscusi & Aldy, Reference Viscusi and Aldy2003, Robinson, Reference Robinson2007). Current estimates of the VSL for the U.S. general population are on the order of $10 million (Viscusi, Reference Viscusi2018). That is, on average, Americans appear to be making decisions involving small changes in mortality risks as if they were valuing their own lives at $10 million, which in turn serves as a willingness-to-pay based shadow price for avoided fatalities in cost-benefit analyses of proposed regulations. However, some regulations also affect the mortality risk of pets. Assessing the efficiency of regulations affecting pets requires an estimate of the dollar value pet keepers place on their pets’ lives. With respect to pet dogs, such analyses require an estimate of the value of statistical dog life (VSDL).
Pets face mortality risk from a variety of sources. For example, contaminated or adulterated pet food poses a substantial mortality risk to dogs and cats. In 2007, thousands of dogs and cats died in the USA because their food was contaminated with melamine, a cheap adulterant that makes flour appear to be gluten, a more valuable protein-rich wheat (Nestle, Reference Nestle2008). Concerns about the adulteration of food additives in both pet and human food contributed to a strengthening of regulatory authority for the Food and Drug Administration (FDA) through the FDA Food Safety Modernization Act (P.L. 111-353) in 2010. In its subsequent rulemaking, the FDA set higher standards for animal food manufacturing (FDA, 2015). Although the primary benefit in the Regulatory Impact Analysis supporting the rule was the reduction in human salmonellosis from handling pet food, the analysts monetized reductions in illness risks to pet dogs and cats at $2434 based on responses to a survey submitted to the regulatory docket that asked people about their willingness-to-pay for veterinary visits. The analysts recognized the monetization as questionable because the survey did not employ an explicit stated preference format, but rather asked about making a payment for veterinary care for an already sick dog and thus not an appropriate basis for valuing changes in mortality risk. A VSDL derived using appropriate stated preference methods would allow the FDA to conduct more confident cost-benefit analyses of future rules affecting pet mortality. One can also imagine the assessment of rules by the Environmental Protection Agency affecting pet mortality, such as those regulating pesticide use, or by the Federal Aviation Administration (FAA) with regard to air transport as also benefiting from a reliable estimate of the VSDL.
A reliable estimate of the VSDL could potentially have utility beyond the regulation of the health and safety of pets, although we acknowledge that some caution is required in its use beyond the regulation of mortality risks. Like the VSL, it does not necessarily capture what, on average, people are willing to pay to avoid certain deaths of identifiable individuals. Just as one may have limits on the amount of money one may be willing to spend on house modifications to reduce grandma’s risk of a deadly fall but willing to spend all available resources to keep her alive once she has fallen, one may be willing to spend less on reducing the mortality risk of one’s pet than providing veterinary care once the pet is ill. That said, the human capital approach favored by courts in making awards in wrongful death cases has no direct analog for pets, at least those not used as breeders, which means the VSDL may be the only approach available for many applications.
With these considerations in mind, the first potential use of VSDL is as a starting point for valuations of companionship with dogs. Such valuations are directly relevant to cost-benefit analyses of programs to aid the disabled and promote human health through zooeyia (Hodgson et al., Reference Hodgson, Barton, Darling, Antao, Kim and Monavvari2015). Combining the VSDL with information about the expected longevity of the dog allows estimation of the value of a dog life-year (VDLY). The VDLY would be a useful shadow price for integrating companionship into estimates of the net benefits of zooeyia programs involving dogs.
Second, the VSDL would provide a basis for valuing loss of companionship with pet dogs in tort cases. Courts generally restrict recovery of damages for the wrongful death of dogs to their market value. Some have argued that an approach more consistent with the common law would award damages based on emotional distress and loss of companionship (Martin, Reference Martin2011). However, establishing the appropriate magnitude of such awards on an individual basis has been generally deemed by the courts as impractical. A population-based estimate of mean VSDL could serve as a default value to promote appropriate deterrence, if not achieve perfect compensation.
Third, the VSDL would provide a sounder basis for public investment in veterinary science and medicine. Research that reduces dog mortality clearly has a value to dog keepers. The availability of the VSDL would allow a better assessment of alternative research programs or treatments that offer different combinations of changes in morbidity and mortality.
Fourth, divorce settlements involving only marketable property can be easily resolved by allocating each party the appropriate fraction of total assets. In cases involving custody of children, the allocations are more complicated because one party cannot be financially compensated for loss of custody. As dogs can be legally and morally bought and sold, in cases where joint custody of pet dogs is not practical, say for geographic reasons, the VSDL could provide a basis for determining the financial payment that the party gaining custody should pay as compensation to the party losing custody. As with torts involving wrongful death, courts have difficulty placing a value on companionship. A population-based mean VSDL would thus provide a starting point for negotiations over custody.
To develop an estimate of the VSDL, we conducted a survey of a sample of U.S. households with pet dogs that allows us to apply the contingent valuation method (CVM). Specifically, we elicited willingness-to-pay for a vaccine that would reduce the mortality risk to pet dogs from a newly emergent virus.
2 Experimental design
Our experiments are motivated by the H3N2 canine influenza, which first appeared in the USA in 2015 and can now be found in 30 states (Centers for Disease Control and Prevention, 2019). Canine influenza H3N2 is highly contagious and so far appears to have a mortality rate of less than 10 % (American Veterinary Medical Association, 2019). Vaccines against it and the H3N8 strain are currently available.
Table 1 summarizes the five CVM experiments we conducted. Each experiment involved a hypothetical threat such that over the next year the respondent’s pet would face a 12 % morality risk from canine influenza. Each respondent only received one of the five elicitations. The base case (Experiment 1) employed the following script where name is the name of the pet provided by the respondent and X is the randomly assigned bid amount drawn from a uniform distribution ranging from $5 to $3000.
Table 1 Contingent valuation method experiments: 12 % risk without vaccination.

Imagine that scientists have identified a new strain of canine influenza that will threaten dogs in your area during the coming year. Most dogs that contract the influenza over the next year will only show mild symptoms, but some dogs will die suddenly from the virus. Veterinarians estimate that a dog in your area will have a 12 % chance of contracting the new influenza strain and dying from it over the next year. Fortunately, it is not expected that this strain of influenza will remain a threat beyond the next year.
The squares in the diagram [ Figure 1] represent the risk a dog in your area has of dying from the influenza virus over the next year. Each square represents one dog. Green squares represent dogs that do not die from the influenza; red squares represent dogs that do die from the influenza. Assume that the mortality risk for your dog is represented by the chance of randomly drawing a red square.

Figure 1 Survey representation of risk of dog death due to virus.
Now imagine that a vaccine is available to provide some protection against the influenza. The vaccine would reduce the risk that (name) would contract the new influenza strain. Specifically, the vaccine would reduce the chance of (name) dying from the influenza during the next year from 12 to 2 %.
The diagram on the left [ Figure 2] represents the risk a dog in your area has of dying from the influenza virus over the next year if the dog receives the vaccine. For comparison, the diagram on the right represents the risk of dying from the influenza virus over the next year if the dog does not receive the vaccine.
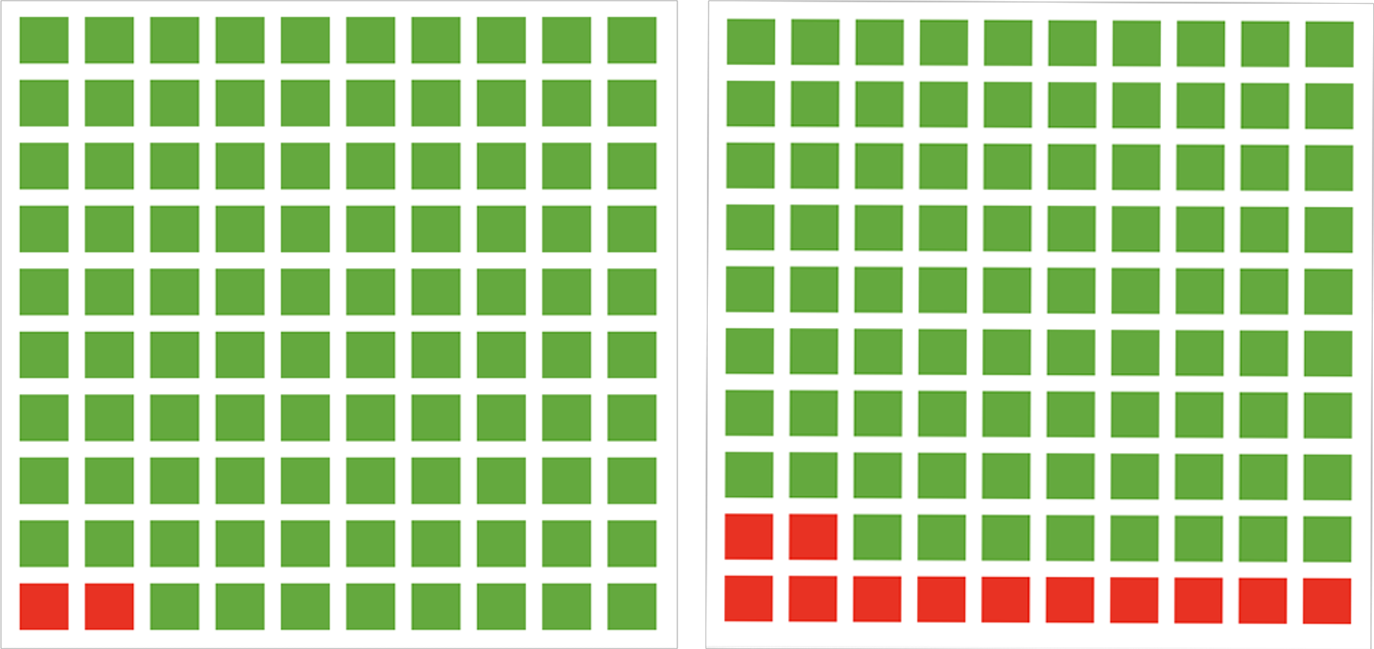
Figure 2 Survey representation of comparison of risk of dog death due to virus with and without the vaccine.
Table 2 Estimation of willingness-to-pay: logistic coefficients and standard errors.

Abbreviation: FPL, Federal Poverty Line.
* Statistically significant at the 5 % level.
Table 3 Sensitivity of value of statistical dog life (dollars) to limits of integration and recoding for certainty.
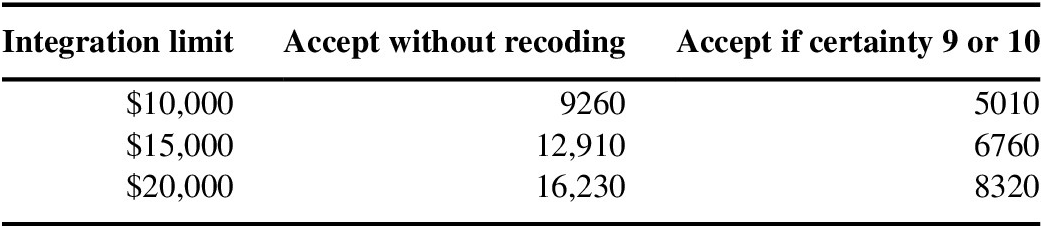
Table 4 Value of statistical dog life (VSDL) and value of a dog life-year (VDLY) for receptiveness and companionship (dollars).
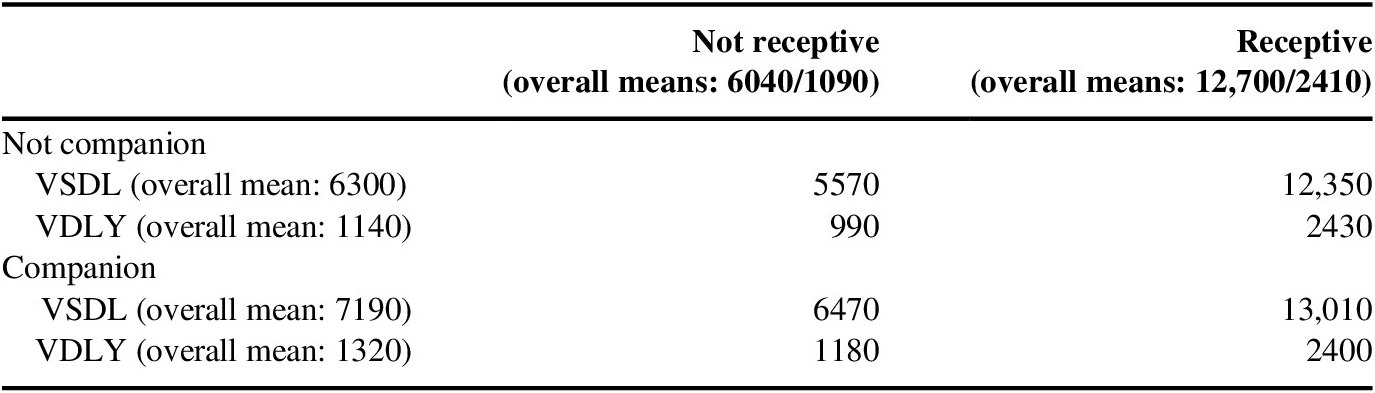
Table 5 Descriptive value of statistical dog life (VSDL) and value of a dog life-year (VDLY) regressions based on companionship, dog age, dog expected life, and respondent receptivity.
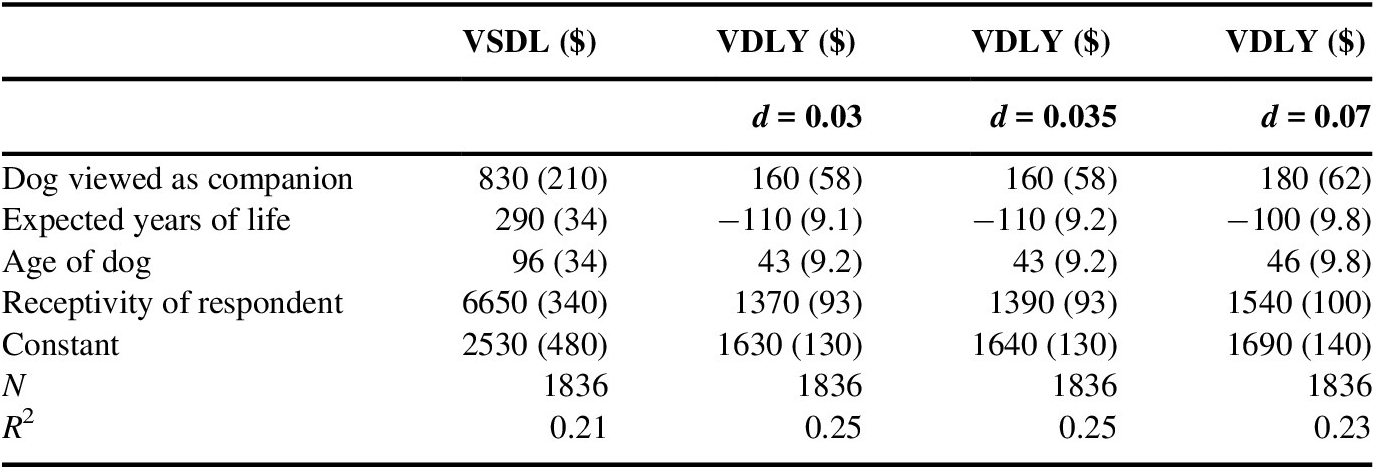
Note: Standard errors in parentheses adjacent to coefficient estimate.
Imagine that your out-of-pocket costs to have (name) vaccinated against the new strain of influenza would be $(X). This is the amount you would have to pay whether or not you have either pet insurance or a prepaid plan with a veterinarian. Remember that this amount of money would not be available to you to use for other expenses such as grocery bills, utilities, recreation, or savings. Would you pay $(X) to purchase the vaccine for name?
In addition to the base case (Experiment 1), we also conducted four other experiments that allow us to conduct several sensitivity analyses and robustness checks. Experiment 2 primed the respondent with a question about disposable income prior to the elicitation. Experiment 3 served as the quantitative scope test by offering a less effective vaccine. Experiment 4 served as a qualitative scope test, replacing the statement of sudden death with “Dogs that contract the influenza in the next year are expected to suffer severe and painful respiratory symptoms including coughing and choking prior to death.” Lastly, Experiment 5 introduced external effects through the following addition: “The vaccine would also greatly reduce the risk that name would spread the influenza to other dogs. On average, for each dog that gets the vaccination, one additional dog will be saved from dying from the influenza.” In all the experiments, respondents who stated a willingness-to-purchase the vaccine were asked how certain they were about making a purchase. Follow-up questions also asked about how likely they thought a new strain of canine influenza would put their dog at risk, and how plausible they thought it was that a vaccine could protect their dog from the influenza.
In the analyses to follow, our primary results are based on combined data from Experiments 1 and 2. Our choice to combine the data from these two experiments was driven by the fact that analysis indicated no effect of disposable income priming – the larger sample size also provides us with greater statistical power. Along with our primary results, we also present results from both the quantitative and qualitative scope tests – Experiments 3 and 4, respectively – as well as from the scenario that introduced the notion of external effects (Experiment 5).
3 Survey data
The University of Oklahoma’s Center for Risk and Crisis Management administered a survey to a national sample of dog keepers drawn from a Qualtrics panel of willing respondents. The survey was fielded from May 18 to 23, 2018, and completed by 4975 adults who kept dogs in their households. This analysis focuses on the 4682 respondents who considered their dogs to be primarily pets, excluding those for whom dogs were primarily guides, breeders, guards, or used in agriculture. As almost half of U.S. households keep dogs, it is reasonable to assume that the Qualtrics panel produces a representative national sample of dog owners. As a further assessment of representativeness, we compared the most common male and female dog names in our sample to those reported by Rover.com, the largest network of dog sitters and walkers, and the most common male and female names of dogs in our sample in households with pet insurance or prepaid veterinary plans to those reported by Embrace Pet Insurance (Appendix). The overlap between the dog names in the sample and on Rover.com is remarkable, increasing our confidence in the representativeness of the sample.
In addition to the questions directly related to the elicitation of the willingness to pay, the survey also contained standard demographic questions, including income and family situation. A question was also asked about whether or not the respondent viewed the dog as a companion – see Kirk (Reference Kirk2019) for an analysis of the importance of value attachment through a sense of “psychological ownership” for companion dogs. There were also a number of questions about the dog. The most important of these questions was the number of additional years that respondents expected their dogs to live, which is required to convert VSDLs into VDLYs. Because of concern that respondents would have difficulty answering this question, we asked about the weight and current age of their dogs. Based on dogs’ weights and current ages, we looked up an estimate of expected number of years of additional life in a life table for dogs (Inoue et al., Reference Inoue, Hasegawa, Hosoi and Sugiura2015). If the number of expected years in the life table (expected_life) were greater than zero, we asked the following question:
On average, a dog with (name’s) weight and age would be expected to live (expected_life) more years. Note that this is only an average, so that (name) could live more or fewer years. Barring an accident, and given your knowledge of (name’s) health, what is your best guess about how many more years (name) will live?
If the number of expected years in the life table were zero, then we asked the following:
Based on published studies of the life spans of dogs by age and weight, (name) has lived longer than average. Barring an accident, and given your knowledge of (name’s) health, what is your best guess about how many more years (name) will live?
The answers to these questions provided an estimate of how long respondents expected their dogs to live. Overall, the correlation between the life table and the respondents’ estimates was 0.63 with 54 % expecting their dogs to outlive the life table.
4 Estimation methods
A major concern in the use of CVM is that the hypothetical nature of the choice leads some respondents to accept bids when, if faced with actual choices, they would reject them. To guard against this sort of bias, researchers usually include a follow-up question asking about how certain respondents are of their acceptance of the bid (Champ et al., Reference Champ, R. C., T. C. and D. W1997). “Don’t know” responses and acceptances without a high level of certainty are converted to rejections. Especially with respect to private goods, where comparisons can be made between the stated preferences in the CVM and observed market behavior, this procedure appears to eliminate bias resulting from the hypothetical nature of the choice (Blumenschein et al., Reference Blumenschein, Blomquist, Johannesson, Horn and Freeman2007). Following this approach, we estimate the mean WTP after recoding acceptances as rejections if respondents expressed a certainty of less than 8, on a scale from 0 to 10 in which 0 corresponds to “Not at all confident” and 10 corresponds to “Extremely confident.”
We assume an underlying random utility model in which WTP is an exponential function of the bid price (Hanemann & Kanninen, Reference Hanemann, Kanninen, Bateman and Wells1999; Haab & McConnell, Reference Haab and McConnell2002). A standard logistic regression with the natural log of the bid price can be used to estimate the mean and standard deviation of WTP using formulas derived by Buckland et al. (Reference Buckland, MacMillan, Duff and Hanley1999). Specifically, we estimate the following model:
 $$ E\left[{y}_i\right]=\frac{1}{1+{e}^{-\beta \left[\ln \left({p}_i\right)-{\mu}_i\right]}}, $$
where yi is an indicator of bid acceptance, β is the coefficient of the natural log of the bid, pi , and μi is the WTP for the ith respondent, which is a function of the covariates other than pi. This equation implies the following probability density function over p:
 $$ f\left({p}_i\right)=\frac{-\beta {e}^{-\beta \left[\ln \left({p}_i\right)-{\mu}_i\right]}}{p_i{\left\{1+{e}^{-\beta \left[\ln \left({p}_i\right)-{\mu}_i\right]}\right\}}^2}, $$
which can be implemented with the empirical estimate b of β and mi of μi. We use numerical integration (from 0 to $15,000, an amount five times the upper bid price of $3000) to estimate the mean WTP for the ith respondent using
 $$ {\overline{\mu}}_i={\int}_0^{\infty} pf(p)\mathrm{d}p. $$
To derive an estimate of the variance of mean WTP, let mi
be the predicted value of μi
, b the estimated value of β, and ui $ ={e}^{-b\left[\ln (p)-{m}_i\right]} $
. The variance of mi
is given by
$ ={e}^{-b\left[\ln (p)-{m}_i\right]} $
. The variance of mi
is given by
 $$ \mathit{\operatorname{var}}\left({m}_i\right)\cong \mathit{\operatorname{var}}(b){\left({\int}_0^{\infty}\frac{u_i\left[ bln(p)-1-\left\{ bln(p)+1\right\}{u}_i\right]}{{\left(1+{u}_i\right)}^3}\mathrm{d}p\right)}^2+\mathit{\operatorname{var}}\left({m}_i\right){\left({\int}_0^{\infty}\frac{b^2{u}_i\left({u}_i-1\right)}{{\left(1+{u}_i\right)}^3}\mathrm{d}p\right)}^2+2\mathit{\operatorname{cov}}\left(b,{m}_i\right)\left({\int}_0^{\infty}\frac{u_i\left[ bln(p)-1-\left\{ bln(p)+1\right\}{u}_i\right]}{{\left(1+{u}_i\right)}^3}\mathrm{d}p\right)\left({\int}_0^{\infty}\frac{b^2{u}_i\left({u}_i-1\right)}{{\left(1+{u}_i\right)}^3}\mathrm{d}p\right), $$
where the integrals are evaluated numerically. The mean and variance of WTP average over the values for the i respondents in the sample.
The analysis assumes that μi is a function of two types of variables, those directly affecting utility and those affecting perception of the hypothetical elicitation. As an economic choice and assuming respondents view vaccination as a private good, we expect income to contribute to a greater willingness-to-pay for the vaccine. To take account of different household sizes, we divided reported income by the Federal Poverty Line (FPL) that takes account of the number of people in the household (U.S. Department of Health and Human Services, 2019). We expect a greater WTP for dogs with expected longer future lives. We also expect a greater WTP for dogs that keepers explicitly view as companions; furthermore, we hypothesize that, because the length of the relationship likely contributes to a stronger sense of companionship, willingness-to-pay should be larger for older dogs. Although the elicitation clearly specifies that the bid price is an additional out-of-pocket cost, and the standard budget reminder reinforces this by noting that accepting it would reduce money available for other expenditures, we hypothesize that those who have either pet insurance or a prepaid veterinary plan may be more risk-averse. Consequently, we include a variable in the estimation that indicates whether or not the respondent has either an insurance policy or a prepaid plan for the dog. Keeping more than one dog may have competing effects. On the one hand, we might hypothesize that respondents with more than one dog might have a lower WTP if they anticipate purchasing the vaccination for all their dogs. On the other hand, we could hypothesize that the additional dog or dogs would make the marginal loss of companionship from the death of the dog smaller than it would be if the respondent only keeps one dog. We also hypothesize respondents living alone will have a higher WTP as companionship with their dogs may substitute for family companionship.
In addition, we hypothesize that three variables will potentially influence how respondents perceive the hypothetical elicitation. First, respondents who see the threat of canine influenza as more likely should be more likely to view their response to the elicitation as consequential. Therefore, we created an indicator to identify respondents who reported that they thought it was either somewhat or extremely likely that their dogs would be exposed to a new strain of canine influenza. Second, respondents who see a protective vaccine as plausible would also be more likely to see the elicitation as consequential. We identified these respondents with an indicator. In the analysis that follows, we expect that respondents who both see the influenza risk likely and a vaccine as plausible will be more likely to take the elicitation seriously. In that sense, we expect the respondents identified by these indicators to be more receptive to the elicitation, and therefore to provide particularly revealing responses. Third, respondents who support local governments mandating vaccination of dogs against communicable diseases like canine influenza are more likely to see their own voluntary acceptance of vaccination as more desirable, so we expect them to have a larger WTP.
To obtain estimates of the VSDL, we divided the estimated mean WTP in each experiment by the stated change in mortality risk. That is, for all the experiments except the quantitative scope test, we obtain the VSDL by dividing the mean WTP by 0.10, the reduction in mortality risk offered by the vaccine (0.12 reduced to 0.02). For the quantitative scope test, we obtain the VSDL by dividing the mean WTP by 0.06, the reduction in mortality risk offered by the vaccine (0.12 reduced to 0.06).
To obtain the mean VDLY, we calculated an annuity factor, $ {a}_d^n=\left[1-{\left(1+d\right)}^{-n}\right]/d $
, for a discount rate of d = 0.035 (Boardman et al., Reference Boardman, Greenberg, Vining and Weimer2018) and n equal to the respondent’s expected number of additional years of life for his or her dog. We then divided each respondent’s predicted WTP from the estimated model by his or her annuity factor to obtain the VDLY from an individual’s perspective. We then average over the relevant sample to obtain a mean VDLY.
$ {a}_d^n=\left[1-{\left(1+d\right)}^{-n}\right]/d $
, for a discount rate of d = 0.035 (Boardman et al., Reference Boardman, Greenberg, Vining and Weimer2018) and n equal to the respondent’s expected number of additional years of life for his or her dog. We then divided each respondent’s predicted WTP from the estimated model by his or her annuity factor to obtain the VDLY from an individual’s perspective. We then average over the relevant sample to obtain a mean VDLY.
5 Estimation
Table 2 displays the logistic regression estimates and the associated estimates of the mean WTPs and their standard deviations. The first column presents results for pooled data from the first and second experiments, which differ only in terms of discretionary income priming. The second and third columns present results for the quantitative and qualitative scope tests, respectively. The last column presents results for the experiment with an external benefit, the saving of an additional dog from vaccination of one’s own dog. Looking across the experiments, all show a strong price effect – the coefficients of the natural log of the bid prices are negative and statistically significant, consistent with respondents treating the elicitations as economic decisions. The ratio of income to the FPL does not appear to affect the probability of bid acceptance, which, if we treat the vaccination as a purely private good, raises some concern about the elicitation being seen by respondents as an economic choice. We note that a similar pattern appears when income rather than the ratio of income to the FPL is included in the model. A “surprisingly large” number of CVM studies report small income effects (Schläpfer, Reference Schläpfer2006, p. 423). To the extent that respondents perceive the welfare of their dogs altruistically so that they do not view them as pure public goods, following Flores and Carson (Reference Flores and Carson1997), we do not necessarily expect a positive income elasticity of demand to translate into a positive income elasticity for WTP.
As with income, the variable in the first column indicating discretionary income priming does not have a statistically significant coefficient. To further allay these concerns about the absence of a measurable income effect, the pattern of the mean WTPs across the experiments is consistent with expectations. Most importantly for assessing the validity of the elicitation, the quantitative and qualitative scope tests show the expected pattern of relative magnitudes. The quantity scope test entails, relative to the base case, the vaccine generating a smaller reduction in the probability of mortality – the vaccine reduces the probability of mortality by 10 percentage points in the base case but only 6 percentage points in the quantity scope test. This smaller reduction in the probability of mortality should be accompanied by a lower WTP and that is indeed what the results in Table 2 demonstrate. Estimated WTP for the base case is $676 but only $603 in the quantity scope test. The qualitative scope test informs the respondent that dogs contracting canine influenza often experience significant pain and suffering prior to death, including coughing and choking. The base case, in contrast, informed respondents that death from canine influenza was sudden and painless. In theory, respondents should be willing to pay more to reduce the probability of a painful death than a painless one. And that is what the results in Table 2 illustrate, with a mean WTP of $715 in the qualitative scope test, which is higher than the base case estimate of $676. The experiment with the external benefit (one additional dog saved) also shows a mean WTP larger than in the base case.
Dog age and the dog viewed as a companion showed the hypothesized positive relationship in only two of the four models; expected years of life had the expected positive relationship in all four models. Having insurance or a prepaid plan has statistically significant positive coefficients in three of the four models. Although consistently positive, the coefficient of living alone was only statistically significant in one model. Turning to the perceptional variables, all the coefficients are positive and statistically significant as expected. That is, viewing the influenza risk as likely, seeing a vaccine as plausible, and believing that local governments should mandate dog vaccinations all positively affect mean WTP.
The standard errors of mean WTP vary across the models. The larger sample size accounts for the substantially smaller standard error for the base case model presented in the first column. Adding or subtracting two standard errors yields a range of mean WTP in the base case from about $500 to about $900, which translate into a range for VSDL of between $5000 and $9000.
6 Dogs that did not bark
Having more than one dog does not appear to affect WTP. Although not shown, we investigated the robustness of the models to additional variables. In general, their coefficients were not statistically significant, and more importantly, their inclusion did not substantially change the estimate of mean WTP. The additional variables were: keeping other pets or cats; respondent age and the square of respondent age; retired or student status; respondent gender; whether the dog was obtained from a breeder; location of household in an urban or rural area; number of children in the household; presence of a child under three or under five years of age; an estimate of risk aversion based on a response to question about the willingness-to-purchase a gamble; and an indicator of the attention of the respondent to questions.
The relative absence of demographic effects on mean WTP suggests that valuations of mortality risks to dogs depend on unobserved rather than the commonly observed respondent characteristics. On the one hand, these unobserved characteristics contribute to larger standard errors in the estimates of WTP. On the other hand, they allow the estimates of mean WTP to be applied broadly, that is, without adjustments for the demographic characteristics of dog keepers.
7 Valuation
The last two rows of Table 2 show the mean VSDLs and mean VDLYs for all models. The base case yields a mean VSDL of $6700 and a mean VDLY of $1230. The quantitative scope test, which involves a smaller reduction in mortality risk than the base case, yields a mean VSDL of $10,050 and a mean VDYL of $1880.
These valuations depend on two crucial assumptions. First, the upper bound of the integration to determine the mean WTP is theoretically infinite, but for both practical reasons and concern that it is unrealistic to assume that individuals would actually be willing to pay very large sums for the mortality reduction, we limited the integration to $15,000. Nonetheless, in the base case analysis with recoding for certainty, about 14 % of respondents offered a bid of between $2500 and $3000 were willing to purchase the vaccine. Consequently, the logistic model puts some probability on the acceptance of bids much higher than $3000. We cannot determine if this “fat tail” is an artifact of our model or true reflection that some respondents indeed have very high WTP to avoid mortality risk for their dogs. We note that Kirk (Reference Kirk2019) found respondents (10 out of 190) who claimed that they would pay very large amounts (over $100,000) for surgery to save a pet dog, which, although not directly comparable to WTP for risk reductions, suggests that some people may actually be in the tail of the distribution.
Second, as described above, we made the now common assumption that in the valuation of private goods, only very certain bid acceptances should be counted as such. In our base case analysis, we recoded acceptances as rejections if the respondent did not express an 8 or higher on 0- to 10-point certainty scale. It is reasonable to consider the possibility that the recoding is incorrect and acceptances should be taken at face value.
Table 3 assesses the implications of these two assumptions. The rows show the mean VSDLs resulting from both higher and lower upper limits of integration in the calculation of mean WTP, and the columns show the difference between our recoding for certainty and no recoding for certainty. Comparing rows, we see that mean VSDL increases as the upper limit of integration increases, but at a decreasing rate. Comparing columns, it is clear that not recoding for certainty results in mean VSDLs that are almost double those based on recoded data.
As noted, respondents who viewed exposure to the influenza risk as likely and vaccination against it plausible were more likely to accept bids and therefore had higher mean WTPs. We created an indicator variable that takes the value 1 if the respondent saw the influenza exposure as likely and the vaccine as plausible and 0 otherwise. We interpret this variable as indicating receptivity to the elicitation. That is, we hypothesize that receptive respondents are more likely to be interpreting the elicitation as if it were an actual choice than non-receptive respondents.
Table 4 explores the implications of receptivity and viewing the dog as a companion on mean VSDL and VDLY in the base case model. The row comparisons show that companionship modestly increases the mean VSDL and VDLY. The column comparisons show that receptive respondents had mean VSDLs and VDLYs more than double the magnitudes of those who were not responsive. These much larger values would be more appropriate shadow prices if receptive respondents do indeed interpret the elicitation more as if it were a real choice.
Our survey experiments do not provide us with a way to determine if more weight should be placed on the mean VSDLs and VSLYs of receptive respondents. To facilitate use of our results by those who wish to make different assumptions and value dogs with different characteristics, we estimated the descriptive regressions shown in Table 5. The dependent variables are the VSDLs and VSLYs of the combined base case and income-primed respondents (column 1 of Table 2). The explanatory variables are whether or not the dog is viewed as a companion, the expected number of remaining years of life of the dog, the age of the dog, and whether or not the respondent is receptive to the elicitation. To facilitate use of our estimates in regulatory analysis, we estimate the regressions for the mean VDLY with discount rates of 3 and 7 %, as well as the preferred 3.5 %.
To illustrate how the results of these descriptive regressions could be used in practice, consider a case where an analyst would like an estimate of the VSDL under two scenarios, one where the dog is viewed as a companion and a second where it is not. For purposes of this exercise, assume that the analyst is using our results to estimate a VSDL for a newborn puppy with a life expectancy of 13 years and where the survey respondent was receptive to the valuation scenario. To estimate the VSDL of a companion animal in this case, the analyst would simply add the relevant coefficients from the descriptive regressions. In particular, the analyst would add the coefficients on:
-
(i) the constant term ($2530);
-
(ii) the receptivity indicator ($6650);
-
(iii) the expected years of life measure multiplied by 13 ($290 × 13 = $3770); and
-
(iv) the companion indicator ($830).
This exercise produces a VSDL estimate for a companion dog of $13,780. The estimate for a non-companion dog would be $830 lower, or $12,950. To recover an estimate of VDLY, the analyst would apply a similar procedure to the regression results in the column with their preferred discount rate. More generally, the results in Table 5 can be used to generate estimates of either the VSDL or VDLY under alternative assumptions about any of the covariates included in the regressions.
8 Conclusion
Ample evidence – ranging from purchases of pet supplies to veterinary bills – demonstrates that Americans value their pet dogs. But, how much are they valued? That is, what is an appropriate shadow price for the life of a pet dog? As far as we know, no studies have attempted to answer this question using appropriate revealed or stated preference methods. In this study, we apply the latter to provide a plausible VSDL for use in cost-benefit analysis, tort cases, and divorce proceedings. Our direct estimate of the VSDL is $6760. However, taking account of the receptivity of respondents to the risks presented in the elicitation and the possibility that recoding for certainty is not appropriate in this context, as well as the result of the quantitative scope test, our direct estimate is likely too low. Therefore, we recommend setting the VSDL to $10,000, a very round number that both reflects our overall interpretation of the results of our analysis and conveys that we are providing only a first estimate.
Although there remain critics of the use of the VSL, most economists and regulatory analysts have come to accept its use as appropriate and necessary for comprehensively assessing impacts in cost-benefit analyses. An important factor in the acceptance of the VSL is its basis in the willingness of people to pay to avoid mortality risks that they themselves face. As our estimate of the VSDL is based on the willingness-to-pay of dog keepers – as opposed to the dogs themselves – to avoid mortality risks, we anticipate that, ironically, some who accept the VSL may reject the VSDL! We note, however, that our estimate is three or four times larger than the value of dog life used by the FDA in its rulemaking regarding requirements for animal food manufacturing under the Food Safety Modernization Act (FDA, 2015). We also note that this objection would apply to using a VSL for children because they do not participate in the labor markets that provide the most common basis for estimating the VSL, or contingent valuation surveys to estimate the value of species preservation. Indeed, contingent valuations typically find that parents are willing to pay substantially more to reduce mortality risks for their children than they are for reductions in mortality risks for themselves (see, for example, Hammitt & Haninger, Reference Hammitt and Haninger2010).
Although we have confidence in our estimate, both because it is based on a representative national sample of dog owners and because it employs conventional CVMs, it is only a first estimate. It demonstrates the feasibility of using contingent valuation surveys to estimate the VSDL. As with stated preference studies in general, replications are desirable to strengthen confidence in results. We hope to see others provide those replications. It would also be valuable to work toward estimating VSDL using revealed preference data, with information on households’ veterinary expenditures representing a possible avenue for doing so. And, of course, we are sure cat keepers would be interested in the VSCL!
Appendix
Table A1 Representativeness of sample in terms of frequency of dog names.
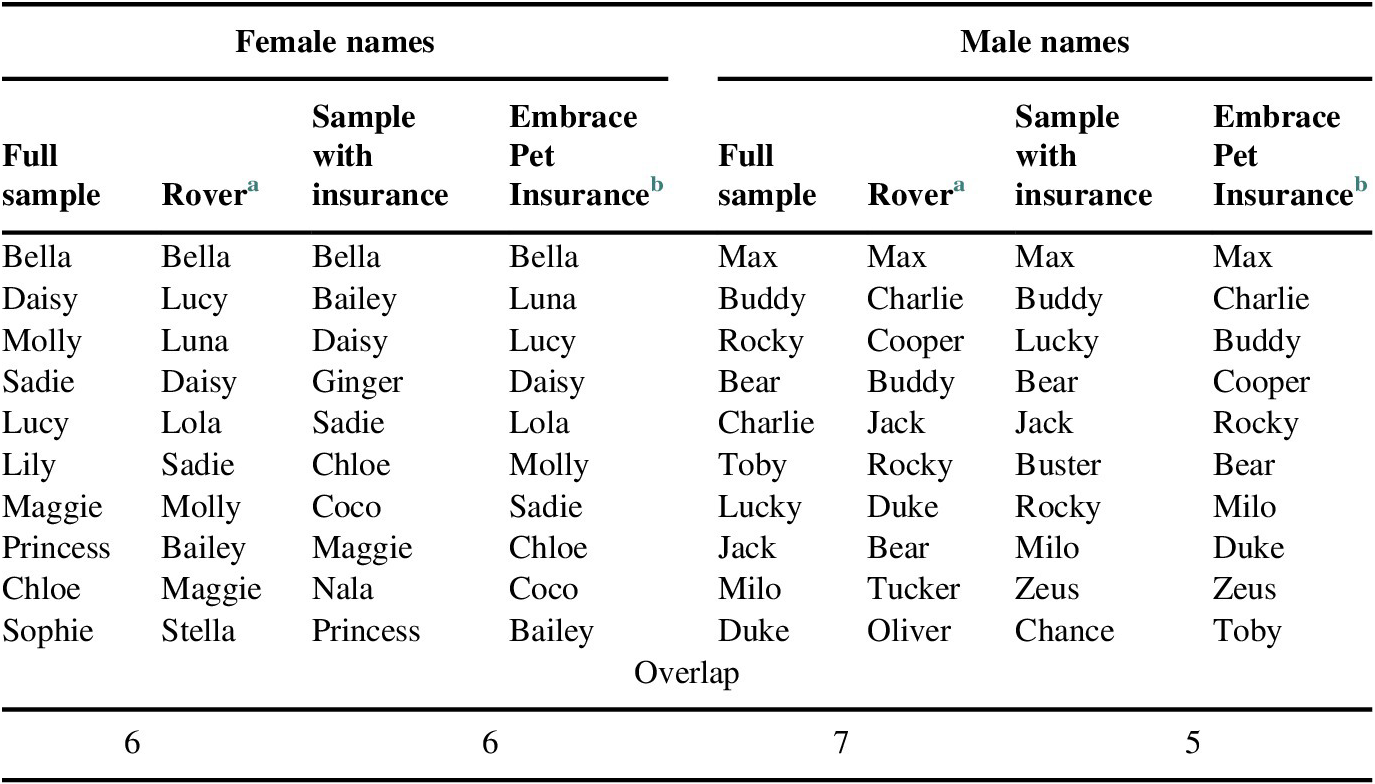
Table A2 Sample summary statistics.
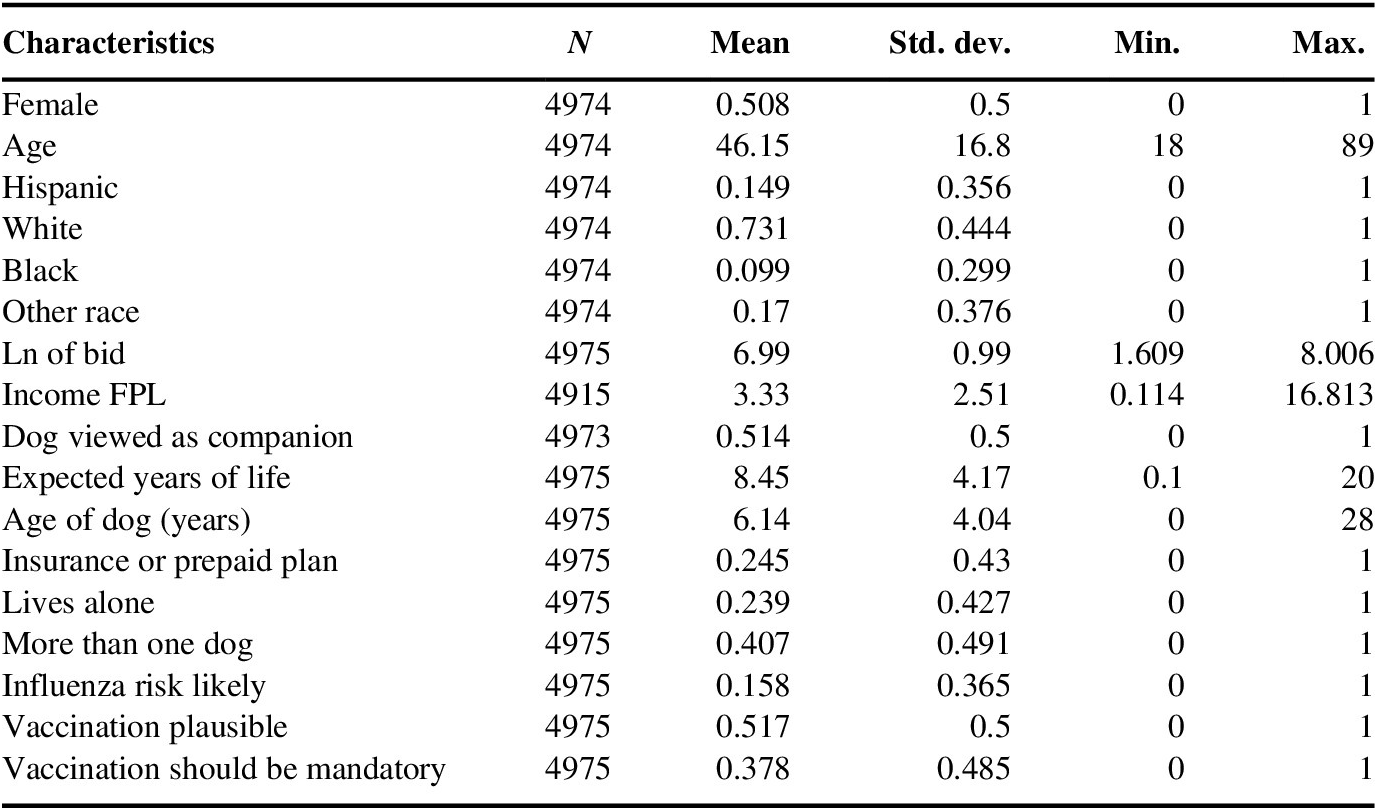
Abbreviation: FPL, Federal Poverty Line.
Table A3 Sample summary statistics for respondents’ recoded to “no” based on: WTP vote = yes, uncertainty (certainty <8).
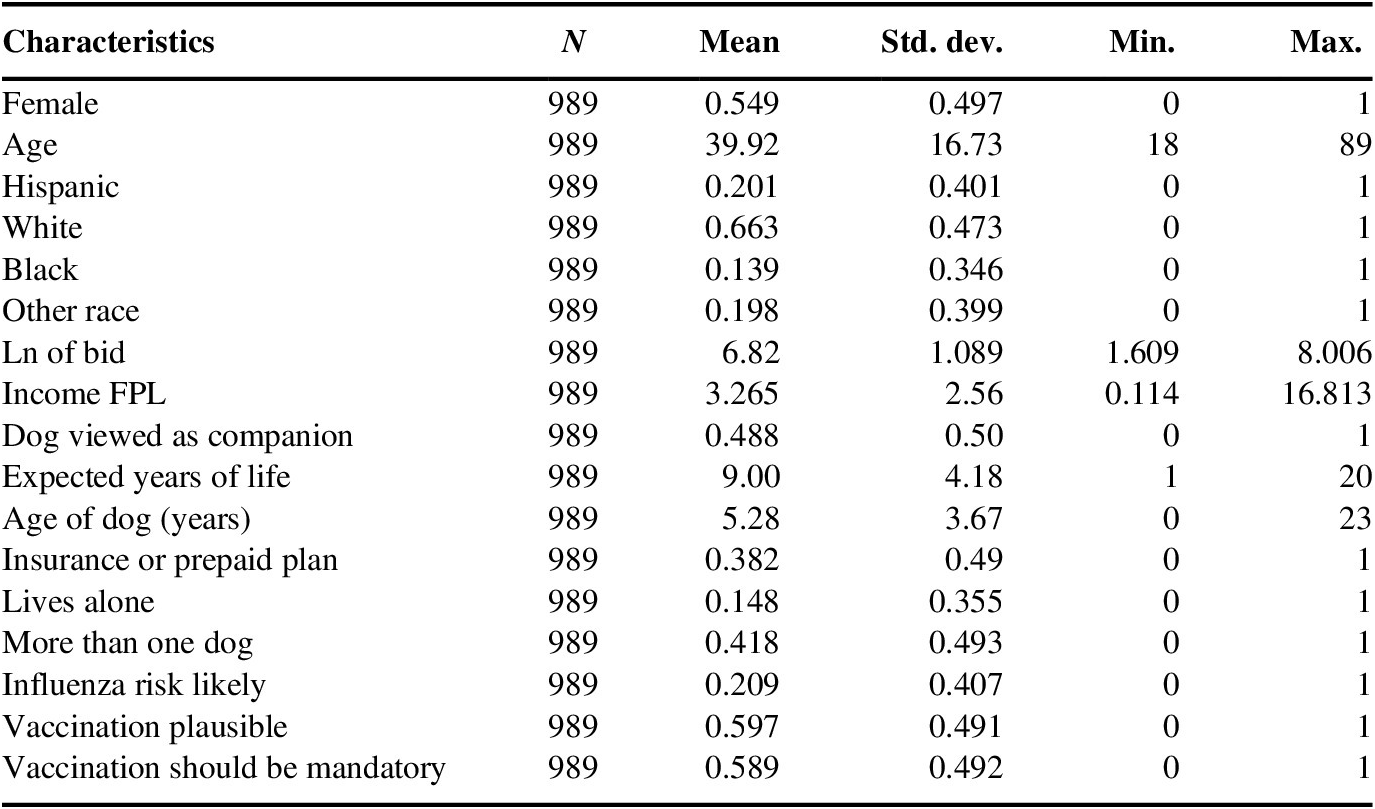
Abbreviation: FPL, Federal Poverty Line.


 Open access