


Fruit and vegetable (FaV) consumption has been related to the prevention of cancer(Reference Steinmetz and Potter1–2), heart disease(Reference Veer van’t, Jansen, Klerk and Kok3), obesity(Reference Rolls, Ello-Martin and Tohill4) and other health problems(5). FaV intake is one of the key dietary behaviours for health promotion(Reference Heimendinger and Van Duyn6).
Accurate measurement of children’s intake is necessary for research on intake and health outcomes(Reference Bensley, Van Eenkwyk and Bruemmer7), long-term surveillance of population status(Reference Murphy8) and evaluating change programme outcomes(Reference Mushi-Brunt, Haire-Joshu and Elliot9). While there are several methods for measuring FaV intake(Reference Eldridge, Smith-Warner, Lytle and Murray10), accurately measuring it remains a challenge(Reference Buzzard, Faucett, Jeffrey and McBane11). The 24 h dietary recall (hdr) is considered the preferred method of diet assessment(Reference Hoelscher, Day, Kelder and Ward12), but problems with self-reports are well documented(Reference Buzzard, Faucett, Jeffrey and McBane11) and it can be cost-prohibitive for large studies. A prototype computerised 24 hdr (called the Food Intake Recording Software System or FIRSSt) for children was developed to minimise these costs; however, it was somewhat less accurate than a dietitian-conducted 24 hdr, and Hispanic children more commonly reported problems using FIRSSt(Reference Baranowski, Islam, Baranowski, Cullen, Myres, Marsh and deMoor13). A problem in FIRSSt was the food search strategy. The food categories enabling the search were designed by professionals, but categories representative of children’s organisation of foods may have enhanced speed and accuracy of search.
The age at which children reach a level of cognitive maturity sufficient to reasonably accurately report dietary intake is not clear(Reference Michela and Contento14). Children’s cognitive limitations may determine how they categorise foods, e.g. concrete groups instead of abstract ideas(Reference Zeinstra, Koelen, Kok and de Graaf15). The cognitive maturity of primary-school children varied from pre-operational to concrete-operational and formal thought, with corresponding differences in knowledge and concepts(Reference Contento16). Recent studies have obtained reasonable 24 hdr from 8-year-old girls(Reference Cullen, Watson and Himes17), whereas food frequencies only from 13 years and older children had data similar to that from adults(Reference Field, Peterson, Gortmaker, Cheung, Rockett, Fox and Colditz18). Girls may be more consistent than boys(Reference Prochaska, Sallis and Rupp19); obesity has been associated with under-reporting(Reference Briefel, Sempos, McDowell, Chien and Alaimo20) and emotional responses to food(Reference Braet and Grombez21), and differences might be associated with ethnic groups(Reference Reynolds, Baranowski, Bishop, Farris, Binkley, Nicklas and Elmer22).
An understanding of how children categorise and label FaV should clarify how to hierarchically group and name the food categories in a computerised 24 hdr, thereby facilitating a child’s rapid and accurate search. Since the perception of a bitter taste of some foods, particularly vegetables, e.g. 6-n-propylthiouracil (PROP)(Reference Keller and Tepper23), may influence the way children categorise them, it would be important to distinguish food categories by the children’s ability to taste PROP. Food preferences(Reference Drewnowski24) and frequency of food consumption(Reference Wansink25) may also influence food categorisation.
The present exploratory study assessed how 8–13-year-olds categorised and labelled FaV, and how these categories and category labels were influenced by gender, age, BMI, ethnicity, socio-economic status, PROP taster status, preference for and frequency of consumption of the food items.
Methods
This research was approved by the Baylor College of Medicine Institutional Review Board. The sample consisted of 152 8–13-year-old children, recruited via telephone from the Children’s Nutrition Research Center (CNRC) volunteer participant database, during the summer of 2006. Attempts were made to recruit a sample with equivalent numbers in each age and ethnic (White, Hispanic and African-American) category. A special effort was made to recruit a cohort of primarily Spanish-speaking children in anticipation of a Spanish language version of FIRSSt. Written informed consent was previously mailed or brought in person when attending the research centre. Children were asked to perform five different card sorts each taking about 30 min. To minimise possible sequence and fatigue effects, the sequence of card sort tasks was randomly assigned. Card sort 1 was composed of diverse single food items(Reference Beltran, Knight Sepulveda, Watson, Baranowski, Baranowski, Islam and Missaghian26), card sort 2 contained mixed food items(Reference Beltran, Knight Sepulveda, Watson, Baranowski, Baranowski, Islam and Missaghian27), card sort 3 included only fruit, card sort 4 included only vegetables, which were analysed for this manuscript and card sort 5 contained diverse grains and cereals(Reference Beltran, Knight Sepulveda and Watson28).
Children were scheduled to perform the card sort activities across two days, except for those with an early morning appointment who had time to finish all the activities in one day. Parents reported the participant’s demographic data (gender, age, ethnicity, parents’ highest educational attainment and family income). On the first day, height and weight were measured to estimate BMI. Height was measured using a stadiometer (PE-AIM-101 from Perspective Enterprises), while weight was measured using an electric scale (SECA Alpha 882 from SECA Corporation), both according to standardised protocol. BMI was calculated as weight (kg)/height (m2). Age- and gender-specific percentiles were obtained from the CDC website(Reference Kuczmarski, Ogden and Guo29).
PROP sensitivity was measured using the impregnated tissue paper procedure(Reference Zhao, Kirkmeyer and Tepper30). Each child was given two paper discs. The first one, labelled with an odd number, contained NaCl (1·0 mol/l), and a second disc, labelled with an even number, contained PROP (0·280 (sd 0·002) mg, with a coefficient of variation in concentration across discs of ±2·2 %). First, each child was asked to rinse their mouth with bottled water, place the paper disk on the tip of their tongue and eject it after 30 s. Next, they drew a line on a log scale, which ranged from 0 to 100 mm, with labels as ‘barely taste it’, ‘weak’, ‘strong’, ‘very strong’ or ‘strongest imaginable’, demarcating the intensity of taste(Reference Zhao, Kirkmeyer and Tepper30). This line intersection was measured with a ruler and the children were classified as ‘non-tasters’, ‘medium tasters’ or ‘super tasters’ following standardised protocol(Reference Zhao, Kirkmeyer and Tepper30). The administration of both paper discs were conducted in the same manner. All research staff were trained on the protocols of every task.
Card sorting
The FaV food items were selected from ten professionally identified food categories (see Table 1) that were intended to be used with adults(Reference Subar, Thompson and Potischman31). The selection of items within categories was based upon those most commonly consumed by 8–13-year-old children from different ethnic groups, and reflecting a consensus among a group of dietitians and behavioural researchers. A small set of food items that were components of or related to FaV or had FaV names were included to assess their clustering.
Table 1 Professional categories and food items

Two sets of 4¼ in × 5½ in cards were used (sixty-four cards for vegetables and sixty-seven cards for fruits), each containing a photograph and the typed name of the selected food item. For each card sort, the child was asked to sort the cards into piles of similar foods. Children were allowed to make as many or as few piles as they wanted. If there was a food they did not know, a ‘Don’t know’ pile was permitted; and if they were not sure where to place a food, a ‘Not sure’ pile was suggested. At the child’s termination of sorting, the research staff went through the ‘Don’t know’ and ‘Not sure’ food items and asked the child to try to place each card in one of the existing piles. The child was allowed to leave the cards as ‘Don’t know’ or ‘Not sure’ if she could not categorise the cards with others. At the completion of sorting, the child was asked to name each pile and then explain why she had selected that particular name. In response to pilot testing, participants were instructed not to sort foods as ‘healthy’ or ‘unhealthy’, nor ‘like’ or ‘don’t like’, since pilot testing suggested some children might be doing this to please the staff or were not grappling with categorisations. Such labels, however, were accepted after the card sort in the authors’ belief that they reflected the child’s categories if done despite receiving these instructions. The research staff recorded the name on a sticky note and attached it to the top of each pile.
The child completed a food preference questionnaire administered on a personal digital assistant (PDA) between each card sort, which included all the foods depicted on the cards. The food preference response categories were: ‘Never had it’, ‘Don’t like it’, ‘Like it a little’ or ‘Like it a lot’. Similar response categories were shown to provide reliable, simple and valid assessments of FaV preferences(Reference Domel, Baranowski, Davis, Leonard, Riley and Baranowski32). They additionally used the PDA to answer a food frequency questionnaire on how often they consumed each of the food items during the previous week(Reference Cullen, Baranowski, Baranowski, Hebert and Moor33). The frequency of consumption response categories were: ‘Never eaten this’, ‘Didn’t eat it in last 7 days’, ‘Ate it 1–2 times’, ‘Ate it 3–5 times’, ‘Ate it 6–7 times’ or ‘Ate it more than 7 times’. These response categories have also been shown to provide reliable responses(Reference Cullen, Baranowski, Baranowski, Hebert and Moor33). The back of each food card contained a distinct bar code. The name given by the child (as recorded on the sticky note labels by the research staff) for each pile was first typed into a computer database, and the food items in the pile were scanned with a bar code reader (to minimise data entry errors) at the end of each morning’s data collection. Monetary compensation was provided to each child, as well as a brochure on healthy diet and physical activity practices; and they had questions answered about healthy diet and physical activity practices at the end of their participation.
Data processing and analyses
The samples were depicted by their demographic and anthropometric characteristics using descriptive statistics (means, standard deviations, frequencies, percentages). Participants were separated into normal weight (BMI-for-age < 85th percentile), at risk of overweight (85th percentile ≤ BMI-for-age < 95th percentile) or overweight (BMI-for-age ≥ 95th percentile) groups. Mean number of card sort piles was tested across demographic characteristics using one-way ANOVA and Tukey’s pairwise comparisons.
Two levels of data coding were employed for the card sort naming process. First, the child-provided pile names were coded into similar labels (second-level categories) to create consistency across the children, while maintaining the basic integrity of the name given by the child. For example, pile names such as ‘made from fruits’, ‘modified fruits’, ‘things you can make with fruit’, were uniformly labelled ‘made from fruit’ (second-level name); ‘one veggie’, ‘plain vegetables’, ‘vegetables group’, were uniformly labelled ‘vegetables’. In situations where a child generated a category with two names (e.g. ‘dried and canned fruit’), the first name, ‘dried fruit’, was always selected. In some cases (e.g. ‘not plant related’), collapsing across child-generated categories was not possible. Two dietitians coded each child’s pile names, and disagreements were evaluated and resolved by group consensus (among all the authors).
Previous studies have categorised food groups using categories reflecting cognitive organising characteristics(Reference Ross and Murphy34). Eleven categories were used for third-level categorisation of the second-level food group names (see Table 2). These third-level categories were sequenced to reflect our best judgement about cognitive development, ranging from simpler ego-oriented categories (Evaluative – Preferences: e.g. Like/Don’t like) to categories imposing and requiring a cognitive framework reflecting nutrition knowledge (see Table 2). Two dietitians did the initial categorisation of level-2 names independently into level-3 categories; inconsistencies were resolved by consensus among the authors. Cross tabulation was used to assess association of the third-level categories with the original professional categories. To probe differences in distributions by the third-level categories, the sample was separated into subgroups based on demographic subcategories. Because the percentages were not mutually exclusive across categories, χ 2 tests were not used. However, meaningful differences were estimated as a ≥25 % difference in distribution among characteristics for each classification.
Table 2 Types of food categories varying from simples to most complex

A study-specific FORTRAN program was used to create proximity matrices, reflecting the relationships among items in the piles created by the children. The proximity matrix for the sixty-seven fruit items was a symmetric 67 × 67 matrix of co-occurrence inputs. For example, the value of 124 in column (C) 26, row (R) 27 indicated that 124 of 152 children put blueberries (C26) and raspberries (R27) in the same pile. In contrast, the value of 1 in C26 and R66 indicated only one of 152 children put blueberries (C26) and apple juice (R67) in the same pile, suggesting that nearly all children perceived blueberries and apple juice as not similar. In the case of the vegetables, the symmetric proximity matrix was of 64 × 64 co-occurrence inputs. To assess possible differences in the clustering of food items, proximity matrices were estimated within demographic characteristic strata.
Robinson matrices (see Fig. 1) provide a clustering procedure with general restrictions(Reference Hubert, Arabie and Meulman35). A matrix is in anti-Robinson form if the values in a dissimilarity matrix increase as they move away from the diagonal; a similarity matrix is said to be in Robinson form if the values decrease as they move away from the diagonal(Reference Hubert and Arabie36). The Robinson (similarity) matrix was modified to a dissimilarity (anti-Robinson) matrix by subtracting the number of paired food items from the total number of children and then analysed using Matlab7.0 m-files for anti-Robinson matrices(Reference Hubert, Arabie and Meulman35). The output matrix was converted back to a similarity file and ultimately standardised. Cut points(Reference Ross and Murphy34, Reference Hubert and Arabie36) were used to define the levels that were from most similar to the least similar: (a) the most similar food items (values ≥3) had a square icon in Fig. 1; (b) highly to moderately similar food items (values between 3 and 2) had a circle icon; (c) moderately similar (values between 2 and 1) had a triangle icon; and (d) least similar foods (values <1) had blank cells. A more complete discussion of (anti) Robinson matrices may be found elsewhere(Reference Subar, Thompson and Potischman31, Reference Cullen, Baranowski, Baranowski, Hebert and Moor33). The clusters resulting from the Robinson matrix analyses were named based on the most common name used by the children for labelling the corresponding food piles. For each food item, mean preference and frequency of consumption were computed and sequenced in order of priority.

Fig. 1 Robinson matrix of sorting fruit food items into piles
Results
A total of 152 children were recruited for the study and completed the FaV card sorts; five children were excluded from the vegetable card sort because of missing data (see Table 3). For demographic characteristics, 56·6 % were female; 89·5 % were predominantly English speaking; 43·4 % Hispanic; 56·6 % had normal BMI; 50·7 % had above >$60 000/year family income; 52·0 % had a college graduate or higher education at home; 46·7 % were PROP medium tasters; and were approximately similarly distributed across the ages of 8–13 years (Table 3).
Table 3 Fruit and vegetables card sorts (CS): descriptive statistics for number of piles by demographic characteristics

Obesity index: normal weight, BMI-for-age<85th percentile; at risk of overweight, 85th percentile≤BMI-for-age<95th percentile; overweight, BMI-for-age>95th percentile. HS, high school; PROP, 6-n-propylthiouracil.
Missing category & ‘Other’ Race/Ethnicity not included in testing differences among number of piles.
*Significant effect [F(1,150) = 10·45, P = 0·002] for Language group Fruit CS.
†Significant effect for Race/Ethnicity Fruit CS [F(2,147) = 4·15, P = 0·018] and Vegetables CS [F(2,142) = 4·25, P = 0·016]; however, post hoc tests yielded no significant (P < 0·0167) pairwise comparisons.
‡Significant effect [F(2,148) = 5·24, P = 0·006] for Fruit CS household income; post hoc tests yielded significant (P = 0·013) pairwise difference between $20 000–$59 000 and at least $60 000.
Children created an average of 8·5 (5·3) piles with 7·9 (11·4) cards per pile for the fruit card sort and an average of 10·1 (4·8) piles with 6·2 (7·9) cards per pile for the vegetable card sort. No differences were found across characteristics for the number of vegetable piles. No significant differences were detected in the number of fruit piles across gender, age, ethnicity and BMI or PROP taster status. Spanish-speaking children generated significantly (F(1, 150) = 10·45, P = 0·002) more fruit piles (mean 12·4 (sd 6·9)) than English-speaking (mean 8·1 (sd 4·9)) children. Participants with a $20 000–$59 000 household income had significantly (F(2, 148) = 5·24, P = 0·006) more fruit piles (mean 10·8 (sd 6·1)) than those with a >$60 000 household income (mean 7·6 (sd 4·6)). Although results yielded significant main effects among race/ethnic groups, no significant pairwise comparison differences were observed.
The correlation for number of piles or categories between FaVcard sorts was 0·5. The correlation for number of piles from the FaV card sorts with the number of piles in card sort 1 (foods from eighteen diverse professionally identified food categories) was 0·24 and 0·42, respectively(Reference Beltran, Knight Sepulveda, Watson, Baranowski, Baranowski, Islam and Missaghian26); and with the number of piles in card sort 2 (foods from fourteen professionally identified complex food categories) was 0·35 and 0·48, respectively(Reference Beltran, Knight Sepulveda, Watson, Baranowski, Baranowski, Islam and Missaghian27). All correlations were significant (P < 0·01). These generally modest correlations suggest that the numbers of categories are not simply a function of a child’s usual cognitive approach to categorisation.
The Robinson matrix for all children for the fruit card sort is presented in Fig. 1. Because this matrix accounted for 98 % of the variance, no analyses of the residual matrices were performed. The letter and number preceding each food identifies the professional category from Table 1. The first cluster was labelled ‘Dessert/Script’ and included E7 Strawberry ice cream, A3 Blueberry cobbler and A4 Key lime pie. The largest cluster labelled ‘Sliced/Food Characteristic’ (considering the most commonly used names by the children), was from C28 Orange to C21 Honeydew melon. The clusters in Fig. 1 were successively labelled dessert, pies, sweet foods, made from fruit, dried, berries, grapes, fresh/natural, pear, sliced, yellow group and juices. This analysis revealed that perceived dessert items were least similar to juices. The vegetable card sort clusters (not shown) were successively labelled as salads, vegetables with toppings, green colour, vegetables, peppers, potatoes, beans, fries and pies. No substantial differences in Robinson clustering of FaV were detected across subcategories for each of the demographic characteristics.
The range of mean fruit preference values (2·2–3·7) was narrow. There were no obvious patterns in the sequence of items by preference for fruit. Although the range of mean preferences (2·1–3·5) was similar for vegetables, the values were lower, and items from the white potato group were towards the more preferred end of the list. These means translate to values between 2 = ‘never had it’ and 4 = ‘liked it a lot’. Mean consumption was between 1·7 and 2·8 for both FaV items. These means translate to values between 1 = ‘never eaten this’ and 3 = ‘ate it 1–2 times per week’. As might be expected, as preference decreased there was a general trend for frequency of consumption to decrease, for both FaV. Correlations between mean preferences and consumption were 0·90 and 0·85 for FaV items, respectively.
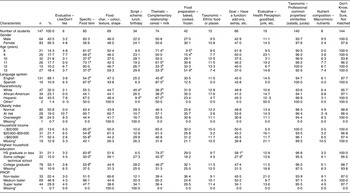
Food cards were the unit of analysis in Table 4. In the fruit card sort, there were 589 level-1 pile names given by the children that were coded into 120 level-2 names, which were then categorised into the eleven level-3 categories (see Table 2). For the vegetable card sort, there were 500 level-1 pile names and 126 level-2 names. Children categorised most (modal response) of the fruit and vegetable cards into ‘Taxonomic – Professional’ (51·8 % and 52·1 %, respectively) level-3 categories (bottom row in Table 4).
Table 4 Frequencies (and row percentages) of professional categories by conceptual match

Differences in the third-level categories by demographic characteristics for the FaV card sort are presented in Tables 5 and 6, respectively (cell percentages with child as the unit of analysis). A difference of 25 % or greater across demographic categories was considered important. In the fruit card sort, the majority of children (146) used the ‘Taxonomic – Professional classification’, followed by the ‘Don’t Know, Not Sure, Not matched’ (122), and the ‘Thematic – Complementary relationship’ (104) classifications. Twelve-year-old children used ‘Food Characteristic’ (i.e. colour, texture, shape), more frequently than 10-year-old children (80 % v. 47·1 %). Eleven- and 13-year-old children used ‘Script – Scheme’ (i.e. breakfast, lunch, party food) to classify the food items more than the 9-year-old children (46·2 % and 44·4 % v. 18·5 %). Twelve-year-old children used ‘Food preparations’ more than anyone; 10- and 11-year-old children used the ‘Food preparation’ classification more than the 8-year-olds group (38·2 % and 42·3 % v. 13·0 %) and 11-year-old children used this classification more frequently than the 9-year-old children (42·3 % v. 18·5 %). Spanish-speaking children used ‘Thematic – Complementary relationship’ (i.e. cereal and milk) classification more than the English-speaking children (93·8 % v. 65·4 %). Hispanic children used ‘Specific – Food item’ (i.e. the name of the food in the picture) more frequently than White children (72·7 % v. 40·4 %). Children at risk of obesity used ‘Food Characteristic’ to classify the food items more than overweight children (75·0 % v. 37·8 %). Children in the lowest and medium household income used the ‘Specific – Food item’ classification more than children in the highest household income (87·5 % and 78·1 % v. 48·1 %). The same situation was seen with children in the lowest educational attainment (79·4 %) compared to the highest household education group (53·2 %). There were no important differences among the third-level conceptual categories by gender or PROP taster status. In the vegetable card sort, the majority of children (144) used the ‘Don’t Know, Not Sure, Not matched’ followed by the ‘Taxonomic – Professional classification’ (140), and the ‘Specific – Food item’ (85) classification. Eight-, 9- and 10-year-old children used ‘Food Characteristic’, more frequently than 10- and 13-year-old children (81·0 %, 69·2 % and 73·1 % v. 37·5 % and 37·0 %). Eight- and 11-year-old children used ‘Thematic – Complementary relationship’ to classify the food items more than the 12- and 13-year-old children (71·4 % and 61·5 % v. 33·3 % and 33·3 %). Thirteen-year-old children used the ‘Food preparation’ classification more than the 8- and 9-year-olds group (51·9 % v. 9·5 % and 15·4 %). Spanish-speaking children used ‘Specific – Food item’ and ‘Thematic – Complementary relationship’ classifications more than the English-speaking children (87·5 % v. 54·2 % and 87·5 % v. 45·8 %, respectively). White children used significantly more ‘Script – Scheme’ classification than the Hispanic children (40·4 % v. 9·4 %). Hispanic children used ‘Thematic – Complementary relationship’ significantly more frequently than White and African-American children (67·2 % v. 38·2 % and 36·2 %). Children in the lowest household income used the ‘Specific – Food item’ and ‘Thematic – Complementary relationship’ classification significantly more than children in the medium and highest household income (83·9 % v. 50·0 % and 53·8 %; 74·2 % v. 45·5 % and 46·2 %). Children in the lowest household income (58·1 %) group used ‘Goal – Have a function’ more than the children in the medium household education group. There were no important differences in the vegetable card sort among the third-level conceptual categories by gender, BMI or PROP taster status.
Table 5 Conceptual match for fruit card sort by demographic characteristics

Obesity index: normal weight, BMI-for-age<85th percentile; at risk of overweight, 85th percentile≤BMI-for-age<95th percentile; overweight, BMI-for-age>95th percentile. HS, high school; PROP, 6-n-propylthiouracil.
Number of children for each conceptual category not mutual exclusive.
Subscript notation: % a meaningfully significantly higher than % b; % c meaningfully significantly higher than % d.
Values in columns for each of the conceptual categories represent the percentage of children with the corresponding characteristics who used the category· For example, 1·5 in the ‘Male’ row and ‘Evaluative’ column indicate that 1·5 % of the sixty-six males used an evaluative label for at least one of the piles.
*Not included in comparison of meaningfully significantly differences (% differences > 25 %).
Table 6 Conceptual match for vegetable card sort by demographic characteristics
Obesity index: normal weight, BMI-for-age<85th percentile; at risk of overweight, 85th percentile≤BMI-for-age<95th percentile; overweight, BMI-for-age>95th percentile. HS, high school; PROP, 6-n-propylthiouracil.
*Not included in comparison of meaningfully significantly differences (% differences > 25 %).
Number of children for each conceptual category not mutual exclusive.
Subscript notation: % a meaningfully significantly higher than % b; % c meaningfully significantly higher than % d.
Values in columns for each of the conceptual categories represent the percentage of children with the corresponding characteristics who used the category. For example, 3·2 in the ‘Male’ row and ‘Evaluative’ column indicate that 3·2 % of the sixty-four males used an evaluative label for at least one of the piles.
*Not included in comparison of meaningfully significantly differences (% differences > 25 %).
Discussion
The 8–13-year-old children tended to categorise FaV using Robinson matrix clustering in a similar way with no substantial differences across demographic characteristics (data not presented). We were expecting to find an age group in this age interval, below which the children could not do the tasks or did them in a very different way. No such age cut-off was detected. Preference and consumption did not appear to play a major role in differentiating the FaV categories. There were substantial differences, however, in the names used for the categories (Tables 5 and 6).
Children did not appear to classify FaV food items in the same way as experts in the field. Children tended to sub-classify the larger categories defined by professionals and combined items across some of the categories (Fig. 1 and Table 1). The only cluster created by the children that was similar to the professionally defined categories for the fruit card sort was juices/Taxonomic – Professional, which was similar to the ‘fruit and fruit juice’ professional category. For the vegetable card sort salads/Taxonomic – Professional, vegetables/Taxonomic – Professional and beans/Taxonomic – Professional clusters were similar to the ‘salads’, ‘vegetables and vegetable juice’ and ‘beans, peas, nuts, soy products’ professional categories. Children tended to create some distinctive categories that did not resemble the professional categories, e.g. in the fruit card sort, clusters were identified by food characteristics such as: dried, sliced, yellow group, sweet food, and fresh/natural. In the case of the vegetable card sort, children created subclusters like: peppers, potatoes, fries and pies, grouping food items based on common properties among the food items.
The methods employed in the present study were similar to those used in other studies, but with different food items(Reference Michela and Contento14). Children who were 5–11-years-old classified a set of single and mixed dishes using categories similar to those found in the present study, e.g. as semantic characteristics (Taxonomic – Professional), functional criteria (Script – Scheme), and nutritional quality (Evaluative – Health Perception) and preference (Evaluative – Like/Don’t like)(Reference Michela and Contento14). Category labelling was affected by age in the current study (Tables 5 and 6) and by age-related cognitive ability in the other study(Reference Michela and Contento14). Insufficient data were presented in the earlier study to directly assess convergence. In the present study, there were essentially linear trends by age with increasing use of script schema for fruit, and food preparation for vegetables; and decreasing use of Thematic – Complementary label for vegetables. These patterns suggest increasing knowledge of food preparation practices by age and otherwise increasing cognitive complexity by age. More studies are needed to clarify these findings.
The modal category of response was the more complex cognitive classification of ‘Taxonomic – Professional’. This pattern of using more complex classifications of food items was found in card sorts with different food items(Reference Beltran, Knight Sepulveda, Watson, Baranowski, Baranowski, Islam and Missaghian26, Reference Beltran, Knight Sepulveda, Watson, Baranowski, Baranowski, Islam and Missaghian27). This suggests prevalent common knowledge of food group categories. The substantial diversity of child-provided names to label these third-level categories however suggests these labels were learned from families rather than learning consistent names in schools. A greater emphasis on nutrition in schools might induce more homogeneity in the second-level categories used.
The correlation for the number of piles between the FaV card sorts was moderate (0·5). This correlation was similar when done with the number of piles of mixed foods and vegetables (0·48), but diminished with fruit (0·35)(Reference Beltran, Knight Sepulveda, Watson, Baranowski, Baranowski, Islam and Missaghian26, Reference Beltran, Knight Sepulveda, Watson, Baranowski, Baranowski, Islam and Missaghian27). The correlations for numbers of piles between the FaV card sorts with diverse single items foods were 0·24 and 0·42, respectively(Reference Beltran, Knight Sepulveda, Watson, Baranowski, Baranowski, Islam and Missaghian26, Reference Beltran, Knight Sepulveda, Watson, Baranowski, Baranowski, Islam and Missaghian27). This suggests that children have a moderate tendency to classify foods into the same numbers of categories, which likely reflects some aspect of their cognitive complexity(Reference Ibáñez37). Moreover, the same food items such as banana and apple were grouped in different categories within different card sorts. In card sort 1, composed of diverse single food items, apple sauce was categorised as ‘Evaluative – Health Perception’, and fruit cocktail as ‘Taxonomic – Professional’(Reference Beltran, Knight Sepulveda, Watson, Baranowski, Baranowski, Islam and Missaghian26). In card sort 2 (contained mixed dishes)(Reference Beltran, Knight Sepulveda, Watson, Baranowski, Baranowski, Islam and Missaghian27), banana was also well classified as ‘Taxonomic – Professional’. This implies that depending on the context, children identified food items in different categories. Consequently, the same food item may need to be listed in multiple food categories to ease their being found in a 24 hdr. A single set of clusters accounting for 98 % of the variance across all children in fruit and in vegetables, and the lack of substantial differences in clustering by demographic categories, suggest that the same food categories can be used with all children for FaV search in a computerised 24 hdr.
The larger number of categories for FaV among the Spanish-speaking children over the English-speaking children suggests the Spanish speakers had more experience with FaV and thereby more labels. Hispanic children using FIRSSt reported more problems of use(Reference Baranowski, Islam, Baranowski, Cullen, Myres, Marsh and deMoor13); this suggests that a Spanish version of the computerised 24 hdr may need to include more categories to reflect their increased cognitive complexity.
Obese children have been shown to emotionally respond to food cues(Reference Braet and Grombez21). The lack of substantive differences in the clustering and the labelling of FaV across BMI categories suggest that these emotional reactions(Reference Braet and Grombez21) did not involve differences in their cognitive organisation of FaV.
Dietary guidance may be better understood if food categories are based on how the target audience categorises food rather than the nutrient content of food(Reference Marcoe, Wen Yen, Sedigheh, Carlson and Britten38). Nutrition educators may benefit from understanding children’s categorisation by discussing the nutrient composition and health benefits (or lack thereof) of consuming foods within each of the child-specified clusters. Nutrition educators should encourage more consistent use of labels for the clusters identified, and move children away from using simpler cluster names (e.g. sliced fruit, fresh/natural).
Limitations of the present exploratory study were the small sample for some subgroups, particularly the ethnic/language groups; thus not allowing for extensive examination by child characteristics. The sample was limited to 8–13-year-old children; it is not clear how this categorisation of foods would differ among younger or older children. Since the sample was recruited from the CNRC participant database, it is not clear to what extent the sample was representative of any larger population. Strengths of this study were the thorough consistent methods applied by trained data collectors and the use of state-of-the-art statistical methods.
Conclusion
Children who were 8–13-years-old tended to categorise foods in consistent ways. FaV were classified mostly into a ‘Taxonomic – Professional’ category. These categories should be tested for use in a hierarchical food search strategy in a computerised 24 hdr for children.
Acknowledgments
Conflict of interest: None of the co-authors have any conflicts of interest regarding this manuscript.
Funding source: This research was primarily funded by a grant from the National Institute of Diabetes & Digestive & Kidney Diseases (5 U44 DK66724-01). This work is also a publication of the United States Department of Agriculture (USDA/ARS) Children’s Nutrition Research Center, Department of Pediatrics, Baylor College of Medicine, Houston, Texas, and had been funded in part with federal funds from the USDA/ARS under Cooperative Agreement No. 58-6250-6001. The contents of this publication do not necessarily reflect the views or policies of the USDA, nor does mention of trade names, commercial products or organisations imply endorsement from the US government.
Author contributions: The authors participated in the following ways: wrote the first draft (K.K.S.), conceived the study (T.B.), participated in the design (T.B., J.B., D.T.), managed data collection (M.M., J.B.), participated in data collection (K.K.S., A.B., N.I.), and reviewed multiple drafts (K.K.S., A.B., T.B., J.B., N.I., M.M.).


