


Introduction
Dicamba is a Group 4, benzoic acid herbicide that has been an integral part of weed management programs in North America in corn (Zea mays L.) and cereals for over 50 years (Cao et al. Reference Cao, Sato, Behrens, Jiang, Clemente and Weeks2011; Hartzler Reference Hartzler2017). This herbicide was discovered in 1958 and was subsequently registered for annual, biennial, and perennial broadleaf weed control in 1962 in the United States (Hartzler Reference Hartzler2017). The rapid increase in the evolution of herbicide-resistant weeds in North America has resulted in renewed interest in dicamba (Behrens et al. Reference Behrens, Mutlu, Chakraborty, Dumitru, Jiang, Lavallee, Herman, Clemente and Weeks2007; Heap Reference Heap2019). Development of transgenic herbicide-resistant crops, specifically glyphosate- and dicamba-resistant soybean (Xtend® technology; Bayer Crop Science, St. Louis, MO) and cotton (Gossypium hirsutum L.) has provided a new weed management tool to control herbicide-resistant weeds (Byker et al. Reference Byker, Soltani, Robinson, Tardif, Lawton and Sikkema2013). These crop cultivars have transgenes that confer resistance to glyphosate through an insensitive enolpyruvyl shikimate 3-phosphate synthase enzyme and to dicamba through metabolism by dicamba monooxygenase (Byker et al. Reference Byker, Soltani, Robinson, Tardif, Lawton and Sikkema2013). Dicamba is an efficacious, cost-effective, broad-spectrum, broadleaf herbicide with minimal risks to the environment (Shaner Reference Shaner2014). It is currently labeled for weed management in dicamba-resistant (DR) soybean, corn, DR cotton, small grains, and pasturelands.
Research conducted in North America has shown that when timely and accurately applied, dicamba alone or in tank mixtures with other herbicides can control key glyphosate-resistant (GR) broadleaf weeds such as Palmer amaranth [Amaranthus palmeri (L.) Watson], waterhemp [A. tuberculatus (Moq.) Sauer], common ragweed (Ambrosia artemisiifolia L.), giant ragweed (A. trifida L.), and horseweed [Conyza canadensis (L.) Cronquist] (Byker et al. Reference Byker, Soltani, Robinson, Tardif, Lawton and Sikkema2013; Johnson et al. Reference Johnson, Young, Matthews, Marquardt, Slack, Bradley, York, Culpepper, Hager, Al-Khatib, Steckel, Moechnig, Loux, Bernards and Smeda2010; Spaunhorst and Bradley Reference Spaunhorst and Bradley2013; Spaunhorst et al. Reference Spaunhorst, Seifert-Higgins and Bradley2014; Vink et al. Reference Vink, Soltani, Robinson, Tardif, Lawton and Sikkema2012). For example, according to Nebraska (93%) and Wisconsin (66%) growers, weed management significantly improved with adoption of dicamba products in soybean (Werle et al. Reference Werle, Oliveira, Jhala, Proctor, Rees and Klein2018).
In 2019, 22 million ha of DR soybean were grown in the United States (Unglesbee Reference Unglesbee2019). In 2017, 2018, and 2019 in eastern Canada, 13%, 31%, and 44% of soybean fields were seeded to DR soybean cultivars, respectively (P.H. Sikkema, personal communication, August 8, 2019). The availability of DR crops and concomitant increase in the use of dicamba have increased the potential for injury to sensitive plants in adjacent areas, due to off-target movement (OTM) of dicamba (McCowan et al. Reference McCown, Barber and Norsworthy2018).
OTM can be related to droplet size and nozzle selection (particle drift), product formulation (vapor drift), and meteorological conditions (i.e., temperature, relative humidity, and wind speed). Particle drift occurs when droplets are carried by the wind during application away from the target area. Even the recommended nozzles for dicamba that produce extremely coarse and ultracoarse droplets yield at least 1% fines (Bish et al. Reference Bish, Guinan and Bradley2019a, Reference Bish, Farrell, Lerch and Bradley2019b). Conversely, volatility occurs when the herbicide reaches the intended target, but due to the inherent high vapor pressure of the herbicide combined with certain meteorological conditions, the herbicide can volatilize. Another important factor affecting OTM is air-temperature inversion, which is characterized by a warm air layer above the soil surface that limits vertical air mixing, causing small suspended droplets or vapor to remain close to the ground and move laterally in a concentrated cloud. It generally occurs in the evening through the early morning during summer months (Bish et al. Reference Bish, Guinan and Bradley2019a, Reference Bish, Farrell, Lerch and Bradley2019b). It has been recommended that applicators should not spray pesticides during such conditions (Bish et al. Reference Bish, Guinan and Bradley2019a, Reference Bish, Farrell, Lerch and Bradley2019b). In a survey of Nebraska growers, 69% reported that the main causes of dicamba injury in neighboring non-DR soybean fields were volatilization, 23% reported physical drift, and 8% reported temperature inversion (Werle et al. Reference Werle, Oliveira, Jhala, Proctor, Rees and Klein2018).
In 2017, two new formulations of dicamba were registered for use in DR soybean and cotton in North America: XtendiMax® (Monsanto/Bayer Group, St. Louis, MO) (Anonymous 2018a) or FeXapan® (Dupont Crop Protection, Wilmington, DE) (Anonymous 2018b) with VaporGrip technology from Monsanto and Dupont, respectively; and Engenia® (Anonymous 2019a) from BASF (Research Triangle Park, NC). In 2019, Syngenta (Basel, Switzerland) registered Tavium™ for use in soybean and cotton, which includes S-metolachlor for residual weed control and dicamba with VaporGrip technology (Anonymous 2019b). XtendiMax®, FeXapan®, and Tavium™ are all diglycolamine salts and have been engineered to have reduced volatility. Engenia® is an N,N-bis-(3-aminopropyl) methylamine salt with reduced volatility risk because of strengthening of the bond between dicamba acid and base within the formulation (Anonymous 2019a). These formulations are reported to reduce the formation of dicamba acid and, therefore, dicamba volatilization (Anonymous 2018a, 2018b, 2019a, 2019b). To further reduce injury to sensitive plants due to OTM of dicamba, numerous restrictions have been added to the dicamba labels, including nozzle type, approved mixtures, exclusion of ammonium sulfate, carrier volume, boom height, application speed, wind speed and direction, and buffer zones.
Research in Arkansas, Missouri, Tennessee, Nebraska, and Indiana has reported that under certain environmental conditions, these new formulations of dicamba can still volatilize and move to nontarget areas, even when applied according to the manufacturers’ recommendations (Jones et al. Reference Jones, Norsworthy, Barber, Gbur and Kruger2019; Norsworthy et al. Reference Norsworthy, Barber, Kruger, Reynolds, Steckel, Young and Bradley2018). A national survey conducted by the University of Missouri in 2017 reported soybean injury on 1.3 million ha in the United States (Bradley Reference Bradley2017). Complaints about extensive injury in nontarget crops by growers prompted Missouri and Arkansas to regulate dicamba sales in those states in 2017 (Gray Reference Gray2017). These concerns have also prompted the Environmental Protection Agency (EPA) to announce additional restrictions for continued use of dicamba in the United States (EPA 2018a).
Therefore, the objective of this research was to (1) quantify the amount of dicamba due to primary (particle drift) and secondary movement (particle plus vapor drift) from applications made in different environmental conditions, geographies, and/or landscapes; and (2) evaluate the effects of primary and secondary movement of dicamba on symptomology of non-DR soybean adjacent to sprayed areas located at six different regionally disparate sites in North America.
Materials and Methods
Experimental Methods
Six experiments were conducted on field sites located in Arkansas (Farm, Proctor, AR; 35.06°N, 90.22°W); Indiana (Farm, Montezuma, IN; 39.47°N, 87.22°W); Michigan (Farm, Fowlerville, MI; 42.39°N, 84.16°W); Nebraska (Burnside Farm Co., Stapleton, NE; 41.25°N, 100.39°W); Ontario (Farm, Dresden, ON; 42.38°N, 82.11°W); and Wisconsin (Farm, Arlington, WI; 43.19°N, 89.19°W) during the 2018 growing season (Figure 1). The treated area (hectarage for each site is listed in Table 1) was planted to DR soybean and the surrounding area was planted to a glyphosate-resistant (GR) non-DR soybean cultivar of similar maturity group. Applications were made when plants were at the V3 growth stage (Fehr and Caviness Reference Fehr and Caviness1977) in Michigan, Nebraska, and Wisconsin; and at R1 growth stage in Arkansas, Indiana, and Ontario. A tank mixture of dicamba at 613 g ae ha−1 (XtendiMax® with VaporGrip® Technology; Bayer Co.) plus glyphosate at 1,334 g ae ha−1 (Roundup PowerMax®; Bayer Co.) plus drift-reducing adjuvant at 0.5% v v−1 (IntactTM; Precision Laboratories, Waukegan, IL) was applied in an application volume of 140 L ha−1. In addition, acetochlor at 1,050 g ai ha−1 (Warrant®; Bayer Crop Science, St. Louis, MO) was added to the dicamba mixture in Arkansas for residual control of Palmer amaranth. This mixture is permitted per the XtendiMax® label. Attempts were made to follow the label, but the application conditions used represent the normal use pattern for dicamba (Table 1).
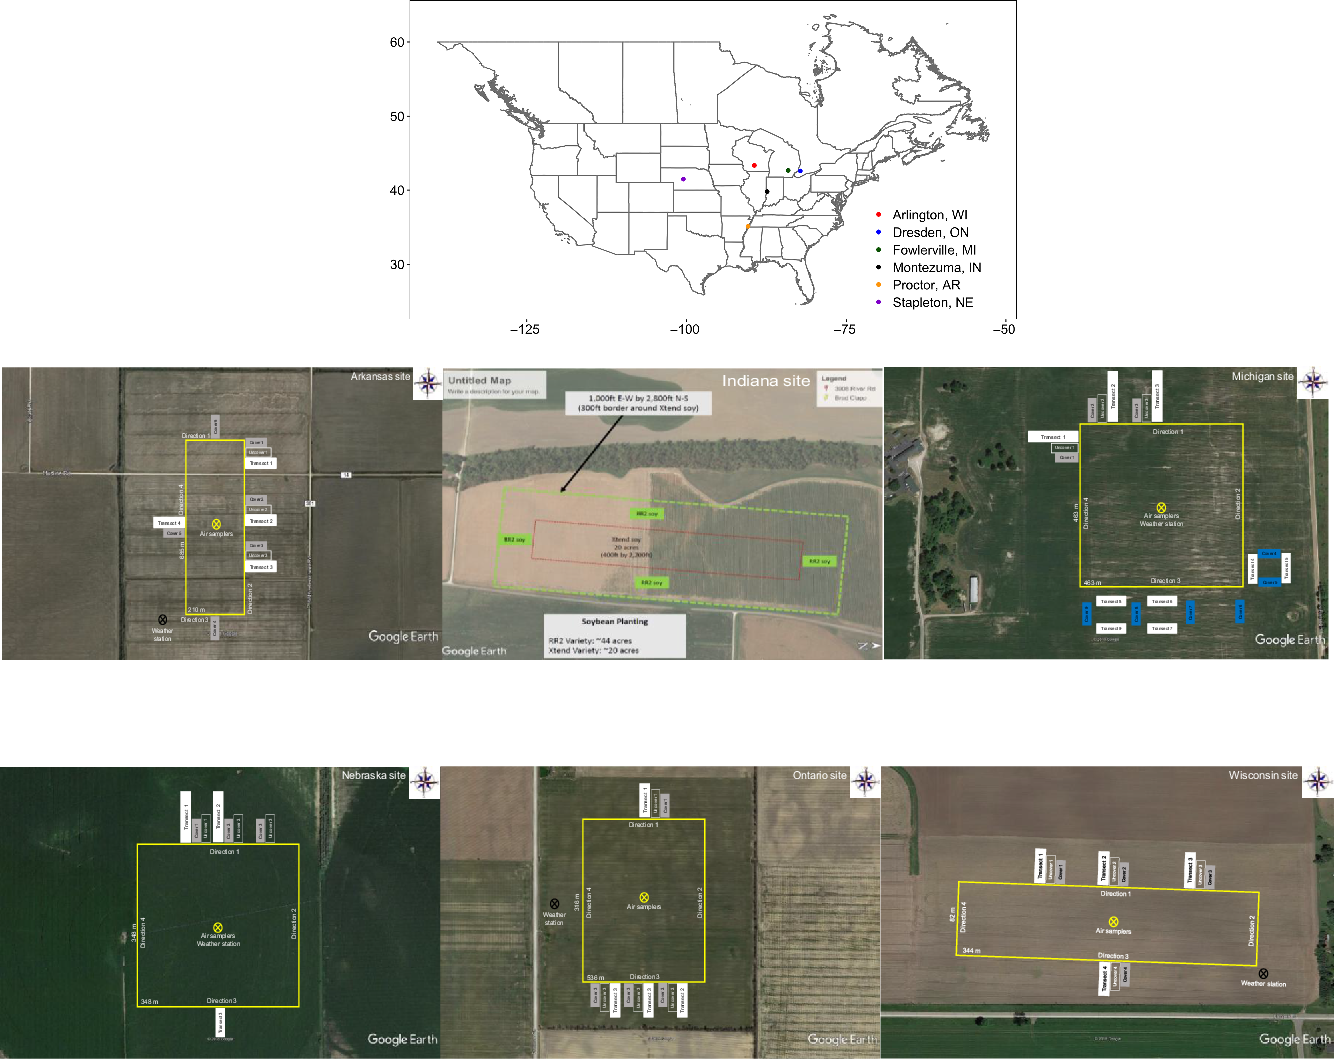
Figure 1. Field plot layout for six experiments conducted in Arkansas, Indiana, Michigan, Nebraska, Ontario, and Wisconsin to evaluate off-target movement of dicamba from applications during the 2018 growing season.
Table 1. Field and application information for experiments conducted in six locations to evaluate dicamba off-target movement during the 2018 growing season.
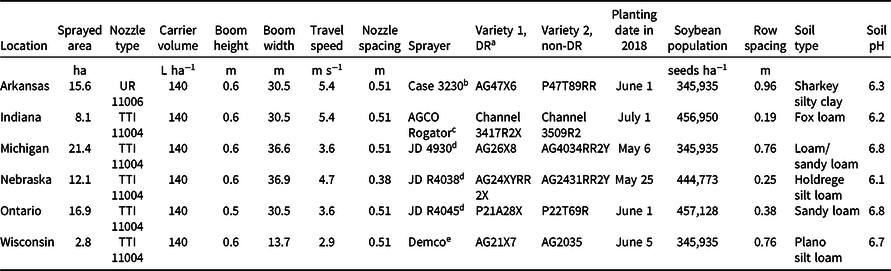
a Abbreviation: DR, dicamba resistant.
b CNH Industrial America, Burr Ridge, IL.
c AGCO, Duluth, GA.
d Deere and Co., Moline, IL.
e Demco Products, Boyden, IA.
Data on environmental conditions (i.e., wind speed, wind direction, air temperature, and relative humidity) at each site were collected from weather stations positioned outside of the sprayed area (Table 2; Figures 2 and 3). In Indiana, Nebraska, Ontario, and Wisconsin, the sensors were positioned at 0.33, 0.56, 0.89, and 1.50 m, respectively, above the crop canopy. In Arkansas and Michigan, temperature and relative humidity sensors were positioned only at 1.50 m above the canopy. Conditions were recorded during the application time until the drift sampling was completed.
Table 2. Meteorological data during dicamba applications in six locations during the 2018 growing season.
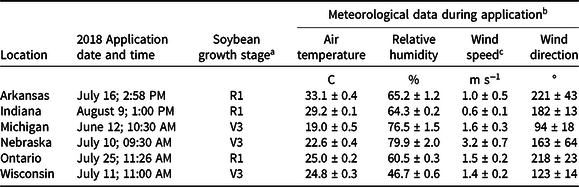
a Growth stage as defined by Fehr and Caviness (Reference Fehr and Caviness1977).
b Data are reported as the average ± standard deviation of all four heights measured at each site.
c Wind speed in Arkansas and Indiana were lower than label instructions during applications.

Figure 2. Wind rose plots demonstrating the average wind frequency, speed, and direction during the air-sampling period after dicamba application for six experiments conducted in Arkansas, Indiana, Michigan, Nebraska, Ontario, and Wisconsin in 2018.

Figure 3. Temperature fluctuations and inversions during the air-sampling period after dicamba application for six experiments conducted in Arkansas, Indiana, Michigan, Nebraska, Ontario, and Wisconsin in 2018. H and h, temperatures at the highest and lowest heights of sensors, respectively.
Spray Particle Drift Evaluation
Before the applications, 125-mm diameter filter papers (Whatman no. 1; Whatman, Maidstone, United Kingdom) were attached to a 15- by 15-cm cardboard sheet placed horizontally at the soybean canopy height outside of the treated area just prior to herbicide application to determine particle drift. The filter papers were collected 30 min after application and placed in individual 50-mL centrifuge tubes (Sarstedt AG & Co., Nümbrecht, Germany). Samples were stored in coolers containing dry ice until transfer to storage at −20 C before analysis.
Samples
Downwind and Upwind Samples
Filter papers were placed at several downwind distances from the field line (sprayed area). The field line was defined as the edge of the sprayed area from the farthest downwind nozzle on the boom. The distances were 15, 30, 46, 61, 76, 91, 107, 122, and 137 m at the Arkansas site; 4, 7, 16, 30, 45, 60, 75, and 90 m in Indiana; 4, 8, 16, 31, 45, 60, 75, 90, 105, and 120 m in Michigan; 4, 8, 16, 31, 45, 60, 75, 90, and 105 m in Nebraska and Ontario; and 4, 8, 16, 31, and 45 m in Wisconsin. Three lines of sample collectors were used at each site (except Nebraska, where two lines were used) spaced 15-m apart as appropriate for the test site and local landscape, with the center line located at the midpoint of the sprayed area. In addition, three filter papers were placed 30 m from the upwind edge of the application area at all sites. To avoid any cross contamination, upwind samples were collected by a person who did not previously collect samples from the downwind deposition area (Figure 1).
Field Air Samples
A set of air pumps (AirChek 224-52; SKC Inc., Eighty-Four, PA) with rechargeable batteries (Powercore + 20100 USB-C; Anker Innovations, Shenzhen, Guangdong, China) and polyurethane foam (PUF) (catalog no. 226-92; SKC Inc.) were positioned on a horizontal stand at each height. Batteries continuously used for 48 h were replaced with a charged one. The airflow rate of air pumps and PUFs were calibrated between 2.9 and 3.1 L min−1 (Check-mate Calibrator; SKC Inc.). Samples were collected, placed in uniquely labeled, screw-cap tube containers (Sarstedt AG & Co.), and stored in coolers containing dry ice until transfer to storage at −20 C before analysis.
Preapplication Samples
Two preapplication air samples were collected at 0.56 m above canopy level using air sampling equipment placed near the center of the sprayed area. The samples were collected within 24 h before the dicamba application. The preapplication air-monitoring event lasted for approximately 6 h. These samples were used to determine the background level of dicamba in the air before study initiation.
Postapplication Samples
A mast was erected in the middle of the sprayed area and air samplers were positioned at 0.33, 0.56, 0.89, and 1.50 m above the crop canopy. Sampling periods, in hours after application (HAA), were 0.5–4.5, 4.5–17.5, 17.5–28.5, 28.5–41.5, 41.5–52, and 52–64.5 HAA in Arkansas; 0.5–6, 6–18, 18–29.5, 29.5–41.5, 41.5–54, 54–65.5, and 65.5–78 HAA in Indiana; 0.5–4, 4–8, 8–20, 20–32, 32–44, 44–56, and 56–68 HAA in Michigan; 0.5–5, 5–18, 18–30, 30–42, 42–54, and 54–66 HAA in Ontario; 0.5–10.5, 10.5–22.5, 22.5–34.5, 34.5–46.5, and 46.5–56.5 HAA in Nebraska; and 0.5–4, 4–8, 8–20.5, 20.5–32, 32–44, and 44–55 HAA in Wisconsin.
Sample Analysis
All samples were shipped overnight in coolers containing dry ice at −20 C to the Mississippi State Chemical Laboratory (Mississippi State, MS) for analysis. The dicamba was extracted using 30 mL of methanol containing 13C6-labeled dicamba (CAS no.: 1173023-06-7; Sigma Aldrich, St. Louis, MO) as an internal standard. The PUF samples were homogenized with a SPEX SamplePrep Geno/Ginder® (OPS-Diagnostics, Lebanon, NJ). The supernatant was concentrated with a TurboVap to 1 mL, and filtered, evaporated, and solvent exchanged to an appropriate volume of 25% acetonitrile in water solution so the samples were concentrated 50×. Quality-control samples included a blank matrix sample (either a PUF or filter) that was devoid of dicamba and a spiked matrix sample that was fortified with a known concentration of dicamba. The spiked matrix sample was used to determine the efficiency of the extraction for every batch: recoveries ranged between 80% and 120%, and the level of detection for PUFs and filters were both 3 ng/PUF or filter. All samples were carefully managed to avoid the potential for cross-contamination and stored at −20 C until analysis.
Liquid Chromatography With Tandem Mass Spectrometry Method
The dicamba was quantitated using an Agilent 1290 liquid chromatograph coupled with an Agilent 6460 C triple quadrupole mass spectrometer (Agilent Technologies, Santa Clara, CA). Chromatographic separation was performed using an Agilent Zorbax Eclipse Plus 100-mm column. The mobile phases consisted of 0.1% formic acid in water for the aqueous phase (A) and 0.1% formic acid in acetonitrile as the organic phase (B). The flow rate was 0.3 mL/min with the following gradient program: 0 to 0.5 min of 25% B, 0.5 to 1 min of 50% B, and 1 to 4 min of 60% B. The ionization of dicamba was performed using electrospray ionization in negative mode with an auxiliary gas (N2), source temperature of 200 C, and a gas flow rate of 10 L m−1.
Plant Effects
OTM on non-DR soybean was assessed with visual estimation of injury along covered and noncovered transects downwind and perpendicular to the sprayed area. Covered and noncovered plants were rated starting at 15.2 m and every 15.5 m out to 259.0 m in Arkansas; 1.5 m and every 1.5 m out to 13.5 m in Indiana; 0.8 m and every 0.8 m out to 15.2 m in Michigan; 4.6 m and every 1.5 m out to 15.2 m in Nebraska; 5, 10, 15, 20, 30, 45, 60, 75, and 90 m in Ontario; and 0.5 m and every 0.5 m out to 10.0 m in Wisconsin. Plants were covered just before the applications using tarps with dimensions of 16.0 by 3.0 by 1.5 m elevated off the soybean canopy by a polyvinyl chloride pipe frame at all sites except Arkansas (Figure 1). In Arkansas, the tarps were 7.6 by 3.0 by 1.5 m beginning 3.0 m from the sprayed area in three downwind transects. The tarp at this site was rested on the plants to ensure no risk for physical drift. In Arkansas, 19-L buckets covering three non-DR soybean plants were used similar to that used in other dicamba research (Jones et al. Reference Jones, Norsworthy, Barber, Gbur and Kruger2019).
Plant injury ratings were collected at 28 d after application (DAA) in Wisconsin and 21 DAA at all other sites. Three soybean plants at each distance in the covered and noncovered areas were randomly selected and visually rated on a 0 to 100 scale, with 0 representing no crop injury and 100 representing complete plant death.
In Arkansas, the periphery of 5% injury was mapped using a global positioning unit at 21 DAA. The area on non-DR soybean injured by dicamba to a 5% or greater level was determined using Google Earth (Google, Mountain View, CA).
Statistical Analysis
The three-parameter log-logistic model (drm function) of the drc package in R statistical software (Ritz et al. Reference Ritz, Baty, Streibig and Gerhard2015) was fitted to the data set of percent dicamba injury and dicamba deposition (ng filter−1) on non-DR soybean, as shown in Equation 1:
 $$Y\left( {\rm{x}} \right) = {d \over {1 + {\rm{exp}}\left( {b\left( {{\rm{log}}\left( {\rm{x}} \right) - e} \right)} \right)}}$$
where Y is the percent non-DT soybean injury or dicamba deposition (ng cm−2), d is the upper limit of Y, and e (inflection point) represents 50% Y reduction relative to d. The parameter b is the relative slope around the e, and x is the distance (m) from the DR-soybean treated area. This was the top model, based on log likelihood of the function mselect in the drc package of R software. The drc package ED function estimated the distance from the dicamba application block area that caused 1% (D1), 10% (D10), and 20% (D20) dicamba injury on non-DR soybean plants (Ritz et al. Reference Ritz, Baty, Streibig and Gerhard2015).
Model Goodness of Fit
Root mean squared error (RMSE; Equation 2) and modelling efficiency (ME; Equation 3) were calculated and used to test the goodness of fit of three-parameter log-logistic and linear models (Mayer and Butler Reference Mayer and Butler1993; Ritz and Streibig Reference Ritz and Streibig2008), as follows:
 $$RMSE = \sqrt {{{RSS} \over {n - p - 1}}} $$
 $$ME = 1 - \left[ {{{\mathop \sum \nolimits_{i = 1}^n {{(Oi - Pi)}^2}} \over {\mathop \sum \nolimits_{i = 1}^n {{(Oi - {\rm{}}i)}^2}}}} \right]$$
where the RSS is the residual sums of squares; n is the number of data points; p is the number of model parameters; Oi is the observed, Pi is the predicted, and Ōi is the mean observed value. The ME values range from −∞ to 1, with values closer to 1 indicating better predictions.
Flux Calculations
The dicamba flux of each field site was calculated using the aerodynamic (AD) and integrated horizontal flux (IHF) methods as recommended by the EPA in Guideline OCSPP 835.8100 (EPA 2018b). Calculations were made using Excel 2016 worksheets (Microsoft Corp., Redmond, WA), as provided by the EPA (EPA 2018b). The AD method requires a minimum fetch of 100 times greater than the highest height of the air sampler, whereas the IHF method requires a minimum fetch of 20 m (Majewski et al. Reference Majewski, Glotfelty, Paw and Seiber1990).
AD method
The dicamba flux was calculated according to the Equations 4 and 5 (Majewski et al. Reference Majewski, Glotfelty, Paw and Seiber1990):
 $$P = {\rm{ }}{{ - {{\left( {0.42} \right)}^2}\left( {{c_{ztop}} - {c_{zbottom}}} \right)\left( {{u_{ztop}} - {u_{zbottom}}} \right)} \over {{\Phi _m}{\Phi _p}{{[{\rm{ln}}({{{z_2}} \over {{z_1}}}{\rm{ }})]}^2}}}{\rm{ }}$$
where P is the flux (µg m−2·s−1); c ztop (µg m−3) is the concentration at the top sampler adjusted according to the regression of concentration versus ln (height); c zbottom (µg m−3) is the concentration at the bottom sampler adjusted according to the regression of concentration versus ln (height); u ztop (m s−1) is the wind speed at the top sampler adjusted according to the regression of wind speed versus ln (height); u zbottom (m s−1) is the wind speed at the bottom sampler adjusted according to the regression of wind speed versus ln (height); Φ m and Φ p (dimensionless) are the internal boundary layer (IBL) stability correction terms determined according to the following conditions (Equation 5), based on the calculation of the Richardson number (R i):
 $${R_i} = {{\left( {9.8} \right)\left( {{c_{ztop}} - {c_{zbottom}}} \right)\left( {{T_{ztop}} - {T_{zbottom}}} \right)} \over {[\left( {{{{T_{ztop}} + {T_{zbottom}}} \over 2}} \right) + 273.16] + {{\left( {{u_{ztop}} - {u_{zbottom}}} \right)}^2}}}$$
where R i (dimensionless) is the R i, T ztop is the temperature (Celsius) at the top sampler adjusted according to the regression of temperature versus ln (height), T zbottom is the temperature (Celsius) at the bottom sampler adjusted according to the regression of temperature versus ln (height).
If R i >0 (for stagnant/stable IBL):
 $${{\it\Phi} _m} = {\left( {1 + 16{R_i}} \right)^{0.33}}{\rm \ and} \ {{\it\Phi} _{p}} = 0.885 {\left( {1 + 34{R_i}} \right)^{0.4}}$$$
If R i <0 (for convective/unstable IBL):
 $${\it\Phi _m} = {\left( {1 - 16{R_i}} \right)^{ - 0.33}}\ {\rm{and\,}}\,{\it\Phi _p} = 0.885 {\left( {1 - 22{R_i}} \right)^{ - 0.4}}$$$
IHF method
The dicamba flux was calculated according to the Equations 6 and 7 (Majewski et al. Reference Majewski, Glotfelty, Paw and Seiber1990):
 $$P = {\rm{}}{1 \over x}\sum\nolimits_{{Z_0}}^{{Z_p}} {\left( {A - Ln\left( z \right) + B} \right){\rm{*}}(C{\rm{*}}Ln\left( z \right) + D)dz} $$
where P is the flux (µg m−2·s−1); z (m) is the height above ground level; A is the slope of the wind speed regression line by ln(z); B is the intercept of the wind speed regression line by ln(z); C is the slope of the concentration regression by ln(z); and D is the intercept of the concentration regression by ln(z). Z p was determined using the Equation 7:
 $${Z_p} = {\rm{exp}}\left[ {{{\left( {0.1 - D} \right)} \over C}} \right]$$
Results and Discussion
Arkansas
The greatest occurrence of injury to non-DR soybean from OTM of dicamba occurred in Arkansas. After waiting 6 d at the field site because of insufficient winds to make a labeled application, the dicamba-containing mixture was applied beginning at 2:58 PM on July 16, 2018, with the entire application requiring approximately 45 min. A fire started adjacent to the field indicated there was no inversion present during application, based on rapid dispersion of smoke. Meteorological data collected at 0.33- and 1.50-m height several kilometers from the test site indicated absence of an inversion during application. Air temperature, relative humidity, and wind speed at boom height during application were 32 C, 66.5%, and 1.3 m s−1, respectively. Wind during the application was predominantly from the west/northwest but the following application wind was from all 360° of the treated field over the next 24 h (Figure 2).
OTM at the test site was predominately in the form of secondary drift, based on (1) a similar level of injury for covered and noncovered soybean plants (Table 3; Figure 4), (2) the upper limit of dicamba deposited downwind being only 60 ng filter paper−1 (Table 4; Figure 5), and (3) the presence of damaged soybean on all four sides of the field. By 22 DAA, soybean covered with tarps during application on all sides of the treated field had at least 40% injury, with a similar level of injury for covered and noncovered plants (Supplemental Table 1). The average wind speed of 1.3 m s−1 at height of the boom during application contributed to less physical drift of dicamba during application compared with other sites, except Indiana (Table 4).
Table 3. Estimated parameters and downwind distance (m) where 1%, 10%, and 50% dicamba injury were observed on covered and noncovered non-DR soybean at six sites.

a Abbreviations: NA, not applicable; b, the slope; d, the upper limit; D1, the distance at which 1% injury was detected; D10, the distance at which 10% injury was detected; D50, the distance at which 50% injury was detected; e, the inflection point relative to the upper limit (50% injury reduction related to the upper limit). The d (upper limit) from noncovered and covered in Arkansas is locked at 55.

Figure 4. Non–dicamba-resistant soybean injury at various distances from the dicamba-treated areas (covered and noncovered) in the downwind direction in (A) Arkansas, (B)Indiana, (C) Michigan, (D) Nebraska, (E) Ontario, and (F) Wisconsin at 28 d after application (DAA) in Wisconsin and 21 DAA in the other sites. Shaded areas represent 95% confidence intervals. DR, dicamba resistant; ME, modeling efficiency; RMSE, root mean squared error.
Table 4. Estimated parameters of dicamba deposition on non–dicamba-resistant soybean plants (based on dicamba deposition on filter papers placed downwind adjacent to the sprayed area at six sites.
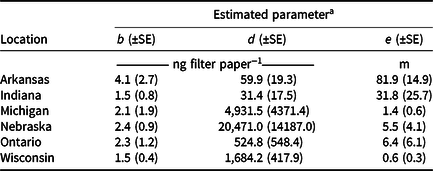
a Abbreviations: b, the slope; d, the upper limit; e, the inflection point relative to the upper limit (50% dicamba deposition reduction related to the upper limit).
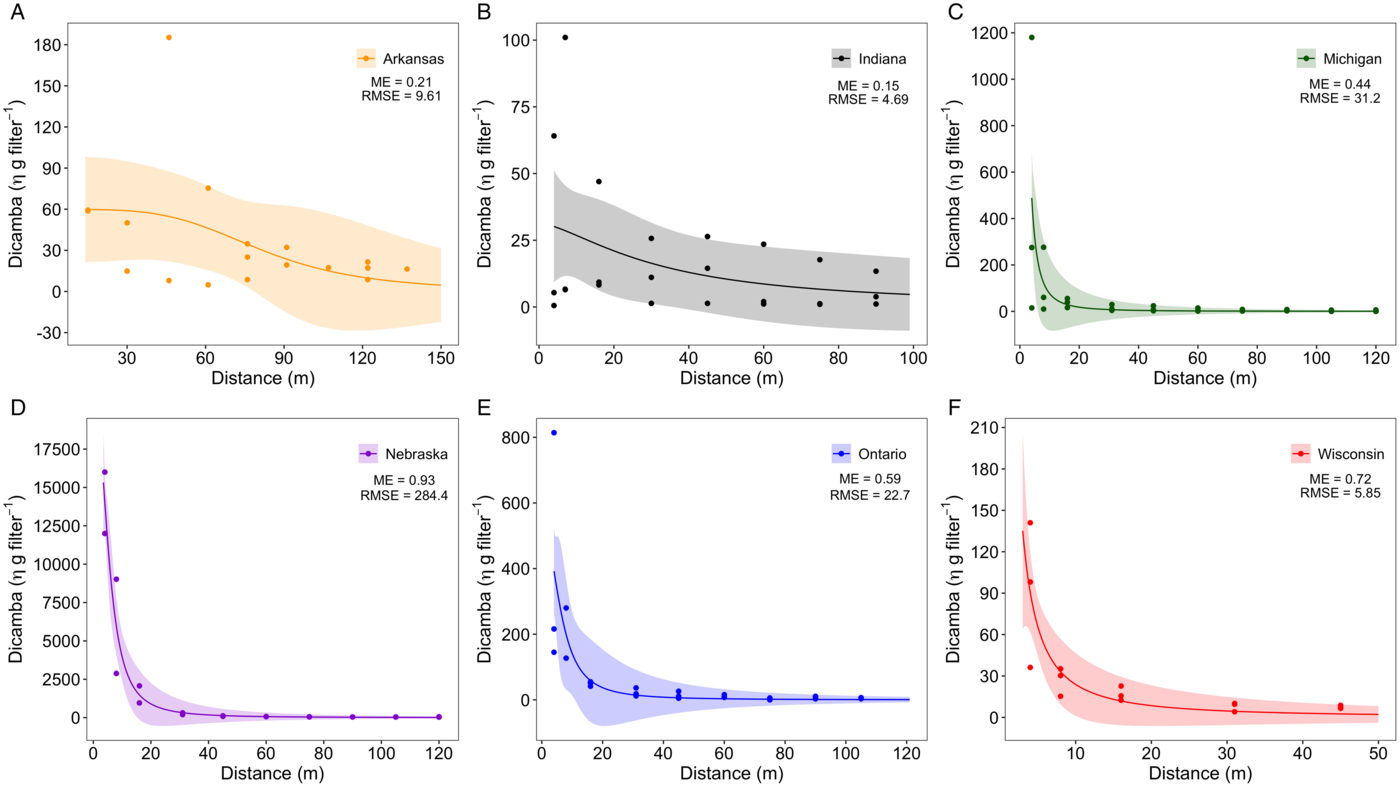
Figure 5. Dicamba deposition at various distances from the dicamba-treated area in the downwind direction at the sites in (A) Arkansas, (B) Indiana, (C) Michigan, (D) Nebraska, (E) Ontario, and (F) Wisconsin. Shaded areas represent 95% confidence intervals. ME, modeling efficiency; RMSE, root mean squared error.
An estimated 10% injury to soybean occurred at 84 m from the treated field when plants were covered during application, and 1% injury to soybean was estimated beyond the field edge (approximately 250 m) for covered and noncovered plants (Table 3). Furthermore, at 22 DAA, 24.0 ha of non-DR soybean exhibited 5% or more injury from dicamba when only 15.6 ha of DR soybean were treated (Supplemental Table 1). Hence, 1.5 times the treated area was injured at least 5% by the dicamba application. Thus, a logical question is why the extensive movement in all directions and greater injury in Arkansas than at other sites?
It is well established that air temperature directly influences dicamba volatility (Behrens and Lueschen Reference Behrens and Lueschen1979), and volatilization of the dicamba formulation tested in this experiment increases substantially at temperatures above 30 C (Mueller and Steckel Reference Mueller and Steckel2019a). Temperatures during and after treatment frequently exceeded 30 C at this test site over three d. However, high temperatures alone do not adequately explain the extensive injury at the Arkansas site, especially considering postapplication daily temperatures exceeded 30 C at the Indiana and Nebraska sites. Slow-moving stable air in combination with high temperatures sufficient for dicamba volatility after application may need consideration (Bish et al. Reference Bish, Farrell, Lerch and Bradley2019b). Furthermore, the addition of glyphosate to dicamba may have also contributed to secondary movement of the auxin herbicide, depending on pH of the spray solution. The addition of the potassium salt of glyphosate to the dicamba formulation applied in these field trials resulted in a pH drop of 1.0 to 2.1 units, depending on the water source (Mueller and Steckel Reference Mueller and Steckel2019b), which can cause the volatility of dicamba to more than double (Mueller and Steckel Reference Mueller and Steckel2019a). Unfortunately, the pH of the water source and spray solution was not measured.
Another factor that may need consideration is the presence or absence of dew after exposure. The presence of dew and rewetting of dicamba on leaves at the Arkansas site is unknown, but other research on metolachlor found gaseous losses increased when the application surface (soil, in this instance) was moist during application (Prueger et al. Reference Prueger, Alfieri, Gish, Kustas, Daughtry, Hatfield and McKee2017). Dew is a common occurrence in the mid-southern United States during the summer months and it may be possible that rewetting of soybean leaves after previous exposure facilitates conversion of the dicamba salt to its respective acid form.
The IHF method was a poor indicator of the risk for injury to soybean from dicamba, based on the flux being lowest in Arkansas, yet the most extensive injury was observed at this location (Figure 6). These results are not surprising, considering recent research in the mid-southern United States has found volatile dicamba concentrations as low as 1 ng m−3 d−1 to be sufficient to cause symptomology in soybean (Brabham et al. Reference Brabham, Norsworthy, Zaccaro, Varanasi and Mueller2019), a level much lower than once thought to elicit injury to the crop.

Figure 6. Dicamba flux from the treated area estimated using Aerodynamic and integrated horizontal flux methods up to 78 h after application in Arkansas, Indiana, Michigan, Nebraska, Ontario, and Wisconsin.
Indiana
Dicamba was applied to soybean at the Indiana site on August 9, 2018, at 1:00 PM, 38 d after planting. The average wind speed during the herbicide application was 0.6 m s−1 at the height of the spray boom, which is below the label requirement of sustaining average wind speeds between 1.3 and 4.5 m s−1 (Table 2). However, wind gusts up to 3.1 m s−1 were observed during the application (Figure 2). In addition, a smoke bomb was released just prior to the herbicide application and provided visual confirmation that an air temperature inversion did not exist.
Less soybean injury was observed for sensitive soybean that were protected with a plastic cover from primary drift during the application compared with plants that had no cover (Figure 4). The difference in soybean injury with and without the plastic cover during the period for primary drift indicates that secondary herbicide movement of dicamba was evident. However, secondary movement of dicamba was relatively minor compared with the primary drift at this site. Soybean injury along the transects reached beyond 30 m downwind from the application (Supplemental Table 1) and was associated with dicamba deposition on the filter paper in amounts greater than 15 ng (Figure 5). No soybean injury or deposition of dicamba on filter paper was observed for any upwind samples (Supplemental Tables 1 and 2). Data and subsequent modeling of the air samples for dicamba described very little secondary movement of dicamba (Figure 6), which supports the soybean injury data.
Michigan
Dicamba was applied to soybean at the Michigan site on June 12, 2018, between 10:18 and 11:00 AM, 37 d after planting. At the time of application, average air temperature was 19 C, relative humidity was 76.5%, and average windspeed was 1.6 m s−1, which was in the label wind speed range of 1.3 and 4.5 m s−1 (Table 2). Wind speeds did not fall below or exceed label recommendations within the 10 h after application (Figure 2).
To account for the southeasterly wind direction during application, downwind tarps and transects were placed on the west and north sides of the sprayed area (Figure 1). Greater dicamba injury to soybean occurred on the west side (tarp A). Maximum injury from primary dicamba drift to noncovered soybean was 60% 3 m downwind outside of tarp A (Supplemental Table 1). Soybean injury levels declined as the downwind distance increased; however, there was still 15% injury 15.2 m downwind. Less soybean injury occurred on the north side of the sprayed area, accounting for overall less injury from the combined downwind transects (Figure 4). Primary dicamba drift plus secondary movement, averaged across the measurements outside the three tarps, caused at least 10% soybean injury 11 ± 3 m downwind (Table 3).
Secondary dicamba movement was also detected on soybean that were kept covered during and up to 1 h after the application. Soybean injury was as much as 13% (±1%), and injury at 1% could be detected as far out as 7 m downwind (Table 3; Figure 4). To a much lesser extent, secondary dicamba movement also occurred on the upwind side of the sprayed area. At one of the three transects, 5% soybean injury was detected at the 8-m transect on the east side (Supplemental Table 1). No injury was detected 30 m away from the sprayed area or at any distance on the south side. Whereas, soybean injury (3%) was found on the east side where tarps were placed at approximately 10 m, during and up to 1 h after dicamba application. Soybean injury on the upwind side was only apparent 21 d after treatment.
Higher amounts of dicamba deposition in the downwind direction closely followed soybean injury. The maximum amount of dicamba detected was 1,180 ng filter−1, 4 m away from the sprayed area on the west side (transect 1) (Supplemental Table 2). Maximum dicamba deposition on the north side was 14.9 and 275 ng filter−1, for transects 2 and 3, respectively. Dicamba deposition was reduced with distance from the edge of the application area, even though there was as much as 15 ng of dicamba filter−1 detected as far as 120 m away from the application area. The 50% reduction of dicamba deposition downwind was estimated to be 2 ± 1 m from the edge of the application area (Table 4; Figure 5). In comparing dicamba deposition with soybean injury, it appears that a minimum of 50 ng filter−1 of dicamba may be needed to elicit a response in soybean.
Similar to other locations, the highest amount of dicamba detected using the PUFs was within the first 6 h after application (Figure 6). Flux calculations followed a diurnal cycle, with higher dicamba fluxes during the day and lower fluxes at night. No additional dicamba was captured at the Michigan location at 48 HAA.
Nebraska
Dicamba was applied to soybean at the Nebraska site on July 10, 2018, at 9:30 AM, 46 d after planting. During the application, the air temperature, relative humidity, and wind speed were 23 C, 80%, and 3.2 m s−1, respectively. In Nebraska, wind speed was up to 4.5-fold higher than at the other sites, especially Indiana (4.5-fold) and Arkansas (3.2-fold). During the air samplings after application, temperature data suggest inversions occurred overnight with stronger gradients in the two nights after the application.
Visible injury on covered or noncovered non-DR soybeans during the application was observed at 21 DAA, showing injury levels up to 50% on covered and up to 75% on noncovered plants (Figure 4). These results suggest secondary movement of dicamba occurred, causing injury on soybean under the tarps, probably due to the high temperatures (higher than 30 C) and suggested temperature inversions on the next two DAA. These outcomes would agree with those of Mueller and Steckel (Reference Mueller and Steckel2019a), who reported that temperature appears to be a major contributor of dicamba secondary movement, with greater dicamba detections in the air at higher temperatures. The injury level decreased as the downwind distance increased, reaching 31% and 50% of injury on covered and noncovered plants, respectively, at 15 m from the sprayed area.
Higher amounts of dicamba on filter papers were detected at the Nebraska site when compared with the other sites (Figure 5), which may be explained by the higher wind speed during the application. The amount of dicamba detected on filter papers decreased exponentially as downwind distance increased, with greater slope up to 15 m, where approximately 1,514 ng filter−1 dicamba was detected, which resulted in 50% injury on non-DR soybean.
Although a higher amount of dicamba was detected using the PUFs at the Nebraska site when compared with some of the other sites (Figure 6), flux calculations from all sites had a similar tendency for detecting greater dicamba flux during the days and lower flux during the nights. Higher amounts of dicamba detected during the day are probably due to higher air temperatures and wind speeds and lower air relative humidity compared with night conditions. Interestingly, dicamba was detected in the air samples up to 56 HAA, not only at the Nebraska site but also at the Indiana and Wisconsin sites. Although very fine droplets may remain suspended in the air under low wind-speed conditions (Miller and Stoughton Reference Miller and Stoughton2000), it is unlikely that those droplets remained suspended in the air, because calm wind speed conditions had frequency of 0% to 2% (Figure 2), suggesting that other sources of secondary movement such as vapor and dust may be associated with the results.
These results may help us understand the reasons for having 6,164 of 46,515 ha of non-DR soybean injured by dicamba in 2017 in Nebraska (13% of survey respondents) according to Werle et al. (Reference Werle, Oliveira, Jhala, Proctor, Rees and Klein2018). Those authors suggested the primary suspected causes would be tank contamination, application during a temperature inversion, and/or secondary movement. Indeed, secondary movement happened (otherwise no injury should have been observed on soybean under the tarps); however, primary movement was also important for resulting in up to 25% more injury on noncovered soybeans when compared with covered soybeans. Regardless of cause, farmers and applicators should be cautious of nearby sensitive crops and weather conditions during and up to 56 h after dicamba applications to mitigate spray drift and its consequences.
Ontario
At the Ontario site, the application was made to soybean on July 25, 2018, between 10:45 and 11:30 AM (Table 2). At the time of application, the temperature was 25 C, with a relative humidity of 61% and wind speed of 5.4 km h−1 (1.5 m s−1) from the north-northwest.
Dicamba levels in the air were below levels to cause any injury symptomology outside of the sprayed area (Figures 4 and 6). Dicamba captured in the air by PUFs occurred mostly during the daytime periods with warmer temperatures and lower relative humidity. There was minimal amount of dicamba captured in the air sample during the night, except at 24 h after dicamba application. There was an increase in dicamba concentration in the air from the upwind PUFs at 36 h after dicamba application, which the authors attributed to the strong southwest winds (Figure 2).
There were no dicamba injury symptoms in the sensitive soybean in upwind areas under covered or noncovered areas (Supplemental Table 1). There were no dicamba injury symptoms in the sensitive soybean in the downwind direction under the covered areas, but there were dicamba injury symptoms in the sensitive soybean in the noncovered areas after dicamba application (Table 3; Figure 4). There was 525 ng filter−1 of dicamba on filter papers placed downwind adjacent to the dicamba application block (Table 4). The dicamba deposition was reduced with distance from the edge of the application block. The 50% reduction of dicamba deposition downwind was estimated to be 7 m from the edge of dicamba application block (Table 4). At 4 m downwind from the sprayed area, dicamba caused 15% (±1%) soybean injury. However, at 16 m downwind from the sprayed area, dicamba did not cause any soybean injury (Supplemental Table 1).
Based on dicamba concentrations from the filter paper and PUF samples, the amount of dicamba captured was minimal and correlates with injury expected in dicamba-sensitive soybean. Dicamba was still detectable in some PUFs samples 57 HAA. However, there was no detectable dicamba in the PUFs at 69 HAA. As expected, soybean injury was greatest adjacent to the dicamba sprayed area, but soybean injury decreased rapidly with distance, with no injury beyond 20 m downwind or any other direction from the dicamba sprayed area.
Wisconsin
Dicamba was applied to soybean at the Wisconsin site during the morning of July 11, 2018. At the time of application (11:00 AM), wind speed was 1.4 m s−1 out of the south, air temperature was 25 C, and relative humidity was 47%. Application was completed within 30 min. The dicamba application was made following the label directions to reduce dicamba OTM. Smoke bombs were used to indicate wind direction and there was no temperature inversion during application (indicated by rapid dispersion of smoke).
At 28 DAT, dicamba injury on non-DR soybean was observed on the north side (downwind) of the DR soybean block, and no injury was observed on the south side (upwind; Supplemental Table 1). Despite covering the non-DR soybean area during and until 1 h after dicamba application, injury occurred downwind in both covered and noncovered areas of non-DR soybean at this site. The highest dicamba injury rate on non-DR soybean was 44% (±1%) and 41% (±1%) injury without and with cover, respectively (Table 3). The dicamba injury rapidly decreased as distance from the dicamba application area increased (Figure 4). Minimal to no visible injury was observed on non-DR soybean at a distance of 19 m downwind.
The dicamba deposition reduced with distance from the application block (Figure 5; Table 4). Dicamba 1,684 ng filter−1 was detected adjacent to the dicamba application block (Table 4). The 50% reduction of dicamba deposition was estimated at 0.6 m from the dicamba application block. Similar to other locations, the highest amount of dicamba detected using the PUFs was within the first 6 HAA (Figure 6). Flux estimations followed a diurnal cycle, with higher dicamba concentrations measured during the day and lower concentrations at night. Dicamba was still detected up to 55 HAA at the Wisconsin site. Dicamba injury on non-DT soybean in the downwind direction was likely caused by both primary and secondary dicamba OTM. Calm winds blew toward the same direction for 72 HAA at this site, likely carrying secondary dicamba vapor or particles in the downwind direction (Figure 2).
In summary, the greatest injury to non-DR soybean from OTM of dicamba occurred at the Nebraska and Arkansas sites followed by the Michigan, Wisconsin, Indiana, and then Ontario sites. The level of injury on covered and non-covered plants at all sites generally decreased as the downwind distance increased. The highest estimated dicamba injury on non-DR soybean was 50%, 44%, 39%, 67%, 15%, and 44% for noncovered areas and 59%, 5%, 13%, 42%, 0%, and 41% injury for covered areas at the Arkansas, Indiana, Michigan, Nebraska, Ontario, and Wisconsin sites, respectively. The upper limit of dicamba deposition on non-DR soybean plants (based on dicamba deposition on filter paper placed downwind adjacent to the dicamba application block) was 60, 31, 4,931, 20,471, 525, and 1,684 ng filter paper−1 at the Arkansas, Indiana, Michigan, Nebraska, Ontario, and Wisconsin sites, respectively. The dicamba deposition diminished with distance from the application block.
Non-DR soybean injury was greatest adjacent to the dicamba sprayed area; the soybean injury due to OTM of dicamba rapidly decreased as distance from the dicamba application area increased. There was no injury beyond 20 m downwind or in any other direction from the dicamba sprayed areas at the Indiana, Michigan, Ontario, and Wisconsin sites. We cannot conclude from this study that all soybean injury was solely the result of primary drift. Soybean injury was sometimes evident in directions that were not always downwind from the application. The difference in soybean injury with and without the plastic cover during the spray period for primary drift (particle) also indicates that secondary herbicide movement of dicamba (particle plus vapor) happened at five of the six locations. Temperature seems to be an important factor in dicamba behavior under some field conditions. Slow-moving, stable air in combination with high temperatures sufficient for dicamba volatilization after application may contribute to off-site movement.
Additional research is needed to determine the exact mechanism of secondary movement of dicamba when applied according to the manufacturer’s label directions. This research reemphasizes the importance of maintaining appropriate stewardship to avoid injury to sensitive plants and crops besides soybean and preserve the use of dicamba for weed management in North America.
Acknowledgments
The authors gratefully acknowledge Dr. Ryan Rector from Bayer CropScience Inc. for his supervision and technical contributions to this project. The authors also thank Adam Pfeffer, Chris Kramer, Ryan DeWerff, Jeff Golus, Kasey Schroeder, and all summer and graduate students from collaborating institutions for their technical expertise in conducting these studies. Funding for this project was provided by Bayer CropScience Inc. No other conflicts of interest have been declared.
Supplementary material
To view supplementary material for this article, please visit https://doi.org/10.1017/wet.2020.17


 Open access