


Time-limited psychotherapy has been introduced partly in response to economic considerations and partly because of patient preferences for brief interventions (Reference Jarrett and RushJarrett & Rush, 1994). In addition, the demand for psychological treatment appears to have been motivated by concerns about the side-effects of medication and about potential drug dependency, and by a reluctance to use biochemical therapy to resolve psychological problems (Reference Churchill, Hunot and CorneyChurchill et al, 2001). In The Netherlands, psychological treatment is generally provided by out-patient mental healthcare centres (MHCs, the former Regional Institutes for Ambulatory Mental Health).
At these MHCs, an approach known as brief therapy, namely a short-term psychological treatment consisting of a maximum of seven sessions, is currently growing in popularity. The aim of this study was to assess the long-term cost-effectiveness of brief therapy compared with cognitive–behavioural therapy (CBT) and care as usual as a first-line treatment in an MHC out-patient population. We used a pragmatic trial design to enhance external validity.
METHOD
Study sample
The study was a large multicentre randomised trial conducted in MHCs in The Netherlands. The MHCs are specialised mental healthcare institutes to which patients must be referred by a general practitioner (GP). Seven MHCs (Altrecht, Eleos, Emergis, Gelderse Roos, Mentrum, Zaanstreek/Waterland and Adhesie) participated in the study and were representative of the patient population. Patient selection was undertaken in two steps. Enrolment took place between February 2000 and October 2001, and follow-up data were collected until March 2003. First, during this period a total of 6095 new clients presented to the MHCs and were screened with regard to inclusion criteria (age 18–65 years, eligible for out-patient mental healthcare, not treated by the same MHC in the past year) and exclusion criteria (psychotic or bipolar disorder, cognitive impairment, high suicide risk, poor command of the Dutch language, hard drug misuse/dependence). Comorbidity associated with other psychiatric diagnoses (with the exception of psychotic or bipolar disorder) was allowed, and this included personality disorders, alcohol misuse/dependence and somatic disorders. Second, all of the remaining patients were assessed with the Composite International Diagnostic Interview (CIDI; Reference WittchenWittchen, 1994). Patients with the following DSM–IV diagnoses (American Psychiatric Association, 1994) were included: major depressive disorder (single episode or recurrent); dysthymic disorder; panic disorder (with or without agoraphobia); social phobia; or generalised anxiety disorder. Over a fifth of the interviewed patients were excluded (n=1338; 22%) or else failed to meet the inclusion criteria (n=1257; 21%). Nearly a third of the patients (n=1995; 33%) refused to participate, and 803 (13%) were not included for other reasons (e.g. not contactable because telephone number was incorrect, on holiday). In total, 702 patients gave their informed consent and were included in the study. This sample was somewhat smaller than the pre-set sample size of 750 patients.
A follow-up period of 1.5 years was chosen to establish the long-term effects on health status and costs. Measurements were recorded at baseline and then every 3 months. Patients were permitted to switch to an alternative treatment arm if their medical condition rendered this necessary. We applied intention-to-treat analyses.
Interventions
Brief therapy is a formalised ‘stepped-care’ approach. The therapy focuses mainly on the present, and emphasises abilities rather than disabilities. Brief therapy is expected to reduce costs and increase efficiency in the short term. Its claim to long-term cost-effectiveness in the Dutch mental healthcare setting for a broad range of psychiatric problems has not yet been confirmed by scientific evidence. Problems may recur at a later date, or patients may require additional treatment in mental healthcare services or other parts of the healthcare sector and consequently generate additional costs. In the present study, patients who were undergoing brief therapy for depression or anxiety were compared with those who were receiving CBT, which had been shown by earlier studies to be an effective approach (Reference Black, Wesner and BowersBlack et al, 1993; Cloaguan et al, 1998; Reference Dorrepaal, van Nieuwenhuizen and ScheneDorrepaal et al, 1998). In this study, CBT was formalised and the main focus was on altering irrational cognitions by challenging them. The maximum number of sessions was 15. In the same way as for brief therapy, a ‘stepped-care’ approach was adopted for CBT, in which all patients initially received a first-line treatment, and they were only switched to another therapy if the first therapy proved to be inadequate. In The Netherlands, care as usual is not formalised, and a multidisciplinary team is free to assign a therapy from a wide range of therapeutic options. The treatment decision is based on professional experience, taking into account the specific problems and characteristics of the individual patient. The number of sessions depends on the therapy that is offered. Evidence on the (cost-)effectiveness of care as usual is lacking. However, this type of ‘matched care’ is claimed to be more effective than a ‘stepped-care’ approach, in which one form of (relatively brief) therapy is started for all patients indiscriminately, and patients are switched to other options if there is no subsequent improvement or if side-effects occur.
Measures
At baseline, several demographic characteristics (e.g. age, gender, educational level and employment status) were assessed. In all interviews that were conducted during treatment, we assessed health-related quality of life, use of medical resources and productivity loss using the EuroQol Questionnaire (EQ–5D) (Reference Essink-Bot, Stouthard and BonselEssink-Bot et al, 1993) and the Trimbos and iMTA Questionnaire on Costs Associated with Psychiatric Illness (TiC–P; Reference Hakkaart-van RoijenHakkaart-van Roijen, 2002).
Quality of life
Quality of life was assessed with the EQ–5D, which is a validated tool for measuring general health-related quality of life. It consists of five items (mobility, self-care, usual activities, pain/discomfort and anxiety/depression), each of which is rated as causing ‘no problems’, ‘some problems’ or ‘extreme problems’. The health descriptions can be linked directly to empirical values for health states of the general public, which allows utilities to be computed (Reference Essink-Bot, Stouthard and BonselEssink-Bot et al, 1993). The patient mean utility scores were estimated by applying the area-under-the-curve method, which involves summing the areas of the geometrical shapes obtained by linearly interpolating between utility scores over the study period (Reference Matthews, Altman and CampbellMatthews et al, 1990).
Direct and indirect costs
The economic evaluation was undertaken from a societal perspective, and included costs due to medical resource utilisation (direct medical costs) and costs attributable to production losses (indirect costs).
We used the TiC–P to collect data on direct and indirect costs from the patients (Reference Hakkaart-van RoijenHakkaart-van Roijen, 2002). The first part of the Tic–P measures medical resource utilisation by asking for the number of contacts with different (medical and psychological) healthcare providers (e.g. GP, psychiatrist, medical specialist, physiotherapist, alternative health practitioner, day care/hospital length of stay, and medication) during the past 4 weeks. We assumed that the number of contacts and/or days in those 4 weeks were representative of the total period between assessment points (an average of 3 months). Data on the number of contacts at the MHCs were collected directly from the participating centres. Subsequently, the number of medical contacts was multiplied by the unit costs for 2002 (Reference Oostenbrink, Koopmanschap and RuttenOostenbrink et al, 2000; College for Health Insurance (CVZ), 2002). All costs were estimated for the year 2002 and are presented in euros.
The second part of the TiC–P measures productivity losses and includes a short version of the Health and Labour Questionnaire (Reference van Roijen, Essink-Bot and Koopmanschapvan Roijen et al, 1996; Reference Dam, Spijker and ArendsDam et al, 1998). Data on the number of days of absence from work were divided into short-term and long-term absence from work. Short-term absence referred to periods of less than 2 weeks. When calculating the indirect costs due to short-term absence from work, we assumed that the number of days lost over the past 2 weeks was representative of the total period between the measurement points (an average of 3 months). However, if respondents indicated that they had been absent for the whole of the past 2 weeks, we collected additional information concerning when this period of long-term absenteeism had begun, as the recall period for long-term absence from work was determined by the start of this period. This additional information was used to value the production losses according to the friction cost method (Reference Koopmanschap, Rutten and van IneveldKoopmanschap et al, 1995; Reference Koopmanschap and RuttenKoopmanschap & Rutten, 1996). The period of time needed to replace a worker (the so-called ‘friction period’) in 2002 is estimated to be 154 days. Absenteeism among workers was valued by the average production value by age and gender per day or per hour.
Patients may go to work despite being ill, which may impair job performance. Therefore all patients who had worked were asked if they had experienced ‘no impediment’ or ‘some/considerable impediments’.
Data analysis
Costs and quality-adjusted life-years
The results of the cost and quality-adjusted life-year (QALY) analyses are presented as mean values with standard errors. Data on the number of contacts at the MHC were collected directly at the centres, and therefore data were available for nearly all patients (n=611; 87%). However, data on healthcare utilisation and absence from work for estimating other health costs and indirect costs and quality of life were collected by means of a questionnaire. At baseline, data from the TiC–P and the EQ–5D were available for 646 (92%) of the participants in all treatment groups. At the 1-year follow-up and 1.5-year follow-up, data from the TiC–P and the EQ–5D were available for 423 (60%) and 394 (56%) of the respondents respectively. Data with regard to individual resource-use items were unavailable for a small proportion (3%) of patients.
To account for the missing data and the additional uncertainty that they introduce, we used the multiple imputation technique in which each missing value is replaced by m>1 simulated values (Reference RubinRubin, 1987; Reference Rubin and SchenkerRubin & Schenker, 1991; Reference Lavori, Dawson and SheraLavori et al, 1995). After the multiple imputations have been created, m plausible versions of the complete data exist, each of which is analysed by standard methods. The results of the multiple imputation analyses are then combined to produce a single result that includes uncertainty owing to the missing data (Reference Rubin and SchenkerRubin & Schenker, 1991; Reference RubinRubin, 1996; Reference SchaferSchafer, 1997). For the proportion of missing data in the present study, m=10 was found to be sufficiently large to stabilise the outcomes in terms of the standard errors for all analyses (Reference SchaferSchafer, 1997). The overall mean costs are simply calculated as the mean of the mean costs in each data-set. The overall associated variance is determined by combining the variance within data-sets with the variance between data-sets (Reference SchaferSchafer, 1997). We used the Monte Carlo Markov Chain approach to impute the missing values. This approach assumes that the underlying distribution is multivariate normal. However, it has been shown in a large simulation study that even with skewed data this method often performs well (Reference Oostenbrink and AIOostenbrink & Al, 2005).
Standard errors were derived both by the parametric approach as suggested by Rubin (Reference Rubin1996) and by a (non-parametric) bootstrap procedure (Reference Rubin and SchenkerRubin & Schenker, 1991). However, because these two methods yielded equivalent results, only the parametric standard errors are presented here.
Cost-utility
Cost-utility was evaluated by relating the difference in direct medical costs per patient who received either brief therapy or the control treatment (CBT or care as usual) to the difference in terms of QALYs gained, which yielded an estimate of cost per QALY. In addition, we estimated the cost per QALY including the indirect costs.
Uncertainty was assessed by means of bootstrapping, and the results are presented as acceptability curves (Reference van Hout, AI and Gordonvan Hout et al, 1994). Since we were dealing here with three interventions instead of two, we used an adjusted version of the acceptability curve, which leads to a cost-effectiveness frontier that indicates which treatment is optimal for various threshold incremental cost-effectiveness ratios (Reference Fenwick, Claxton and SculpherFenwick et al, 2001).
Sensitivity analyses
The way in which missing data are handled is vitally important when assessing the results of economic evaluations (Reference Oostenbrink, AI and Rutten-van MolkenOostenbrink et al, 2003; Reference Oostenbrink and AIOostenbrink & Al, 2005). Therefore two alternative methods for imputing missing data, namely linear extrapolation and complete case analysis, were applied in the sensitivity analysis. Applying linear extrapolation, the other healthcare costs and costs due to short-term absence from work were extrapolated to 1.5 years by dividing the observed costs of each patient by the number of observed days for which the patient remained in the study, and multiplying the results by 548.
The complete case analysis excluded the data for all patients who dropped out of the study before the 1.5-year follow-up.
Statistical analysis
Multiple imputation analysis was performed using PROC ‘MI’ in SAS for Windows (available in version 8.02 and higher). All other statistical analyses were performed using SPSS version 10.1 for Windows.
RESULTS
The initial characteristics of the patients in the three treatment arms were fairly similar with regard to key variables (Table 1). In total, 41% of the patients had both a mood disorder and an anxiety disorder, 47% had a mood disorder only and 12% had an anxiety disorder only. Over half of the patients who were in paid employment had been absent for a period of over 2 weeks at baseline. More than 40% of the patients who were not in paid employment indicated that this was a result of health problems. At baseline, the mental health functioning of the patients in the CBT group was significantly lower than that of patients in the brief therapy group (Table 1).
Table 1 General characteristics of the respondents at baseline (n=702)

| Care as usual (n = 266) | CBT (n = 232) | Brief therapy (n = 204) | Total (n = 702) | |
|---|---|---|---|---|
| Age (years): mean (s.d.) | 36 (10) | 36 (10) | 37 (10) | 36 (10) |
| Gender (% male) | 35 | 40 | 43 | 39 |
| DSM—IV diagnosis1 (%) | ||||
| First depression, mild | 12 | 12 | 10 | 11 |
| First depression, moderate | 16 | 14 | 13 | 15 |
| First depression, severe | 23 | 28 | 20 | 24 |
| Recurrent depression, mild | 14 | 14 | 20 | 16 |
| Recurrent depression, moderate | 10 | 10 | 10 | 10 |
| Recurrent depression, severe | 11 | 8 | 12 | 11 |
| Dysthymia | 24 | 28 | 28 | 27 |
| Panic disorder without agoraphobia | 13 | 12 | 15 | 13 |
| Panic disorder with agoraphobia | 23 | 21 | 23 | 22 |
| Social phobia | 26 | 29 | 26 | 27 |
| Generalised anxiety | 3 | 6 | 3 | 4 |
| Respondents in paid employment (%) | 62 | 68 | 70 | 66 |
| Paid employment (hours/week): mean (s.d.) | 29 (11.3) | 31 (10.4) | 32 (10.7) | 31 (10.9) |
| Respondents in paid employment2 | ||||
| No impediments at work (%) | 13 | 12 | 16 | 14 |
| Impediments at work (%) | 30 | 30 | 33 | 31 |
| Absent for ≤2 weeks (%) | 16 | 11 | 12 | 13 |
| Absent for >2 weeks (%) | 57 | 57 | 50 | 55 |
| Respondents not in paid employment | ||||
| Care for household (%) | 38 | 43 | 34 | 38 |
| Health problems (%) | 48 | 43 | 39 | 44 |
| Receiving pension (%) | 3 | 1 | 1 | 2 |
| Student (%) | 4 | 8 | 6 | 6 |
| Other3 (%) | 8 | 5 | 20 | 11 |
| EQ—5D utility score | 0.51 | 0.52 | 0.53 | 0.52 |
At baseline, there were no statistically significant differences in demographic data, health status or costs between the group for which there was a complete data set and the respondents who were lost to follow-up.
Direct and indirect costs
Table 2 shows the estimated total mean direct medical costs and indirect costs per patient over a period of 1.5 years. As was expected, the mean number of contacts and the associated costs in the MHCs were significantly lower in the brief therapy group than in the CBT group (95% CI €169 – €741) or the usual care group (95% CI €14 – €464). However, no significant difference was found between the three treatment groups with regard to the mean total direct medical costs per patient (i.e. including the costs due to resource utilisation in other parts of the healthcare service), nor was there a significant difference in indirect costs between the three treatment groups.
Table 2 Mean direct medical costs and indirect costs1

| Care as usual | CBT | Brief therapy | |
|---|---|---|---|
| Number of patients | 245 | 241 | 187 |
| Number of sessions: mean (s.d.) | 12 (14) | 10 (7) | 8 (11) |
| Costs (€): mean (s.e.) | |||
| MHC | 1396 (107) | 1180 (58) | 941 (99) |
| Other medical care | 1964 (235) | 1947 (239) | 2738 (395) |
| Total direct medical costs | 3360 (251) | 3127 (255) | 3679 (417) |
| Indirect costs | 6151 (551) | 6621 (683) | 6537 (675) |
| Total costs (direct and indirect) | 9511 (607) | 9748 (747) | 10216 (816) |
Over time, for all treatment groups the percentage of patients in paid employment who had long-term absence from work declined, and conversely the percentage of patients who had no impediments increased (Table 3).
Table 3 Percentage of respondents in paid employment with impediments, and short-term and long-term absence from work by treatment group1

| Care as usual | CBT | Brief therapy | Total | |
|---|---|---|---|---|
| Baseline | ||||
| n | 149 | 141 | 130 | 420 |
| No impediments at work (%) | 13 | 12 | 16 | 14 |
| Impediments at work (%) | 30 | 30 | 33 | 31 |
| Absent from work for <2 weeks (%) | 15 | 11 | 12 | 13 |
| Absent from work for ≥2 weeks (%) | 56 | 57 | 50 | 55 |
| One-year follow-up | ||||
| n | 95 | 80 | 90 | 265 |
| No impediments at work (%) | 46 | 46 | 48 | 47 |
| Impediments at work (%) | 29 | 38 | 30 | 32 |
| Absent from work for <2 weeks (%) | 8 | 15 | 11 | 11 |
| Absent from work for ≥2 weeks (%) | 20 | 16 | 19 | 18 |
| End of study (1.5 years) | ||||
| n | 86 | 80 | 77 | 243 |
| No impediments at work (%) | 52 | 63 | 43 | 53 |
| Impediments at work (%) | 33 | 30 | 40 | 35 |
| Absent from work for <2 weeks (%) | 17 | 14 | 16 | 16 |
| Absent from work for ≥2 weeks (%) | 12 | 8 | 17 | 12 |
Quality of life
The utility scores for the three treatment groups also showed significant improvement during the study period and did not differ significantly between the groups (Table 4). The improvement in utility scores was moderate during the first year, but was low during the final 6 months of follow-up (Reference CohenCohen, 1988). At the end of the study period, the patients’ quality of life was still significantly lower than the average utility score of the general population (0.88) (Table 4).
Table 4 Utility scores by treatment arm at baseline, at 1 year and at the end of the study (1.5 years), and QALYs per patient at the end of the study

| Care as usual | CBT | Brief therapy | |
|---|---|---|---|
| Number of patients | 245 | 214 | 187 |
| Baseline | |||
| Utility score (s.e.) | 0.51 (0.02) | 0.52 (0.02) | 0.53 (0.02) |
| Number of patients | 165 | 127 | 131 |
| One-year follow-up | |||
| Utility score (s.e.) | 0.64 (0.02) | 0.68 (0.02) | 0.64 (0.03) |
| Number of patients | 147 | 111 | 126 |
| End of study (1.5 years) | |||
| Utility score (s.e.) | 0.69 (0.04) | 0.65 (0.04) | 0.71 (0.04) |
| QALYs (s.e.) | 0.909 (0.03) | 0.936 (0.03) | 0.939 (0.03) |
Cost utility
Table 5 shows the incremental cost-effectiveness ratios both for direct medical costs per QALY gained and for total costs per QALY gained. As we are comparing three treatment options, we have reported the results in the format suggested by Karlsson & Johannesson (Reference Karlsson and Johannesson1996). The treatments are ordered from least to most effective. Comparison of the direct medical costs of care as usual and CBT shows that CBT is superior to usual care (with lower costs and better outcomes), so an incremental cost-effectiveness ratio is only calculated for brief therapy ν. CBT, yielding a value of €262 857 per QALY gained. With regard to total costs the same relationship applies (CBT could achieve the same number of QALYs at lower costs), so again only the incremental cost-effectiveness ratio for brief therapy ν. CBT is calculated, yielding a value of €222 956 per QALY gained.
Table 5 Costs, effects and incremental cost-effectiveness ratio for the three treatment groups

| Treatment | QALYs | Direct medical costs (€) | ICER | Total costs (€) | ICER |
|---|---|---|---|---|---|
| Care as usual | 0.91 | 3360 | CBT could achieve the same number of QALYs at lower cost than treatment as usual | 9511 | CBT could achieve the same number of QALYs at lower cost than treatment as usual |
| CBT | 0.94 | 3127 | 9748 | ||
| Brief therapy | 0.94 | 3679 | 262 857 | 10 216 | 222 956 |
To assess the uncertainty, we constructed acceptability curves for each treatment by calculating the proportion of bootstrap replicates for which that treatment is optimal, for a number of threshold incremental cost-effectiveness ratios (Fig. 1) (Reference Fenwick, Claxton and SculpherFenwick et al, 2001). Figure 1 relates to the direct medical costs per QALY, and it indicates that, taking uncertainty into account, CBT is optimal. However, the preference for CBT becomes less strong as the threshold incremental cost-effectiveness ratio increases. The same is true if all costs are considered (data not shown).
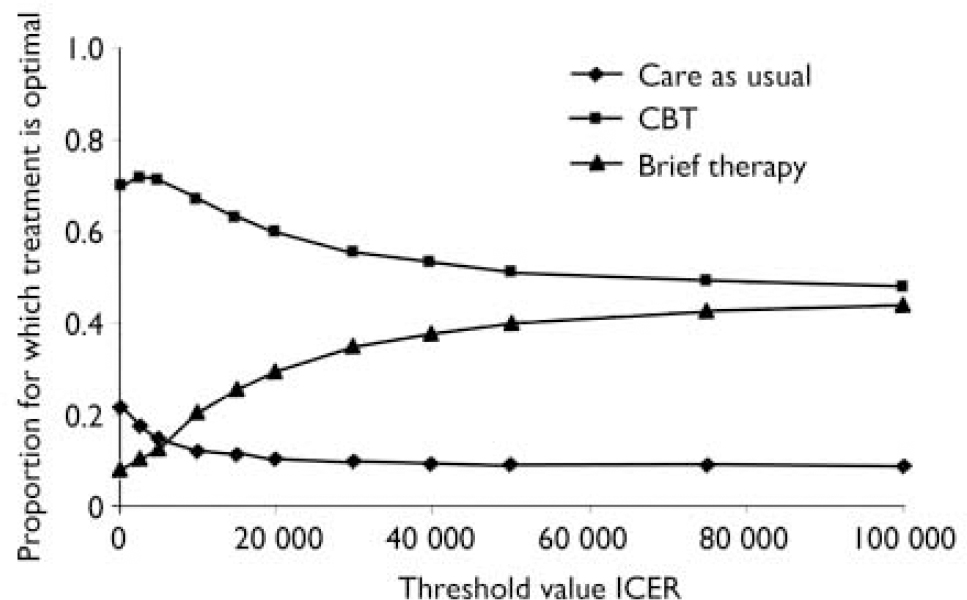
Fig. 1 Acceptability curves for the three treatment options, for direct medical costs per QALY gained. CBT, cognitive–behavioural therapy; ICER, incremental cost-effectiveness ratio; QALY, quality-adjusted life-year.
Sensitivity analyses
In the sensitivity analyses of the missing data, we recalculated the costs and QALYs by performing linear extrapolation and complete case analysis (Table 6). Again no significant difference was found between the groups in overall mean costs and QALYs. When only 48% of the participants were used for the complete case analysis this resulted in comparable findings to those of the linear extrapolation analysis, but with much larger standard errors.
Table 6 Cost per QALY after applying multiple imputation, linear extrapolation and complete cases analysis of the missing data for the three treatment groups

| Care as usual | CBT | Brief therapy | |
|---|---|---|---|
| Multiple imputation | |||
| Direct medical costs (€): mean (s.e.) | 3360 (251) | 3127 (255) | 3679 (417) |
| Indirect costs per patient (€): mean (s.e.) | 6151 (551) | 6621 (683) | 6537 (675) |
| QALY: mean (s.e.) | 0.909 (0.03) | 0.936 (0.03) | 0.939 (0.03) |
| Linear extrapolation | |||
| Direct medical costs (€): mean (s.e.) | 3573 (295) | 3191 (240) | 3605 (327) |
| Indirect costs per patient (€): mean (s.e.) | 6331 (567) | 6383 (672) | 6061 (693) |
| QALY: mean (s.e.) | 0.895 (0.03) | 0.931 (0.03) | 0.906 (0.03) |
| Complete cases analysis | |||
| Direct medical costs (€): mean (s.e.) | 3770 (392) | 2924 (360) | 3792 (594) |
| Indirect costs per patient (€): mean (s.e.) | 5767 (717) | 6135 (925) | 6263 (928) |
| QALY: mean (s.e.) | 0.914 (0.03) | 1.009 (0.03) | 0.920 (0.04) |
DISCUSSION
To our knowledge, this study is the first long-term cost-utility analysis of brief therapy in the Dutch mental healthcare setting to be conducted from a societal perspective. It demonstrated that brief therapy was less costly to the MHCs than CBT or care as usual. Taking into account the direct medical healthcare costs in other parts of the healthcare system, we found no significant differences in costs between the treatment groups, nor were there any significant differences in utility scores between the groups. These findings suggest that the cost savings resulting from brief therapy were cancelled out by higher costs in other areas of healthcare. Inclusion of the indirect costs due to productivity losses did not change our conclusion. In addition, our study confirmed that the indirect costs due to productivity losses were responsible for the majority of the costs of depression and anxiety to society. Over time, the indirect costs declined significantly and there was a significant improvement in health-related quality of life for all three treatment groups.
Sample selection
We conducted a large-scale multicentre randomised trial in the setting of general mental healthcare services in The Netherlands. External validity may have been affected by selection bias resulting from patients either refusing to enter the study or being lost to follow-up. Our data on refusal and our missing data seem to be comparable to those of other important trials (Reference Lambert, Ogles and LambertLambert & Ogles, 2004). Moreover, treatment drop-out in this study was comparable to that in the general population of MHC patients (Reference van der Sande, van Hoof and Hutschemaekersvan der Sande et al, 1992). We recruited patients with a wide range of mood and anxiety disorders, comparable to a normal population of out-patient mental healthcare patients. Furthermore, the patients in our trial reported more (severe) psychological symptoms at baseline (mean score of 223 on the 90-item Symptom Checklist (SCL–90) (Reference DerogatisDerogatis, 1977)) than did a reference population of arbitrarily selected Dutch psychiatric out-patients (mean SCL–90 score=204) (Reference Arrindell and EttemaArrindell & Ettema, 2003). There was no indication of any selection bias leading to the enrolment of only ‘mild’ cases in the study. Furthermore, we found no significant differences in baseline characteristics or mental health status between patients who completed the study and those who did not. Therefore there is no compelling reason to believe that selection bias affected the external validity of the study.
Study design
Unfortunately, this study did not provide an opportunity to evaluate the cost-effectiveness of psychological treatment compared with natural recovery of the patient. The potential effect of antidepressant medication, which was allowed in addition to the treatment to which patients were randomised, is also unclear. At baseline, 36% of the respondents used antidepressant medication, and there were no significant differences between the treatment groups.
Direct costs
It was not possible to distinguish between healthcare utilisation for depression and/or anxiety disorders and that for eventual other general healthcare problems which relied on other areas of the healthcare system. However, this was equally true for all three treatment groups. Furthermore, data were collected on healthcare utilisation, which it was expected would be relevant to the treatment of psychological problems. Data on healthcare utilisation other than sessions at the MHCs were collected by self-report. A previous study has indicated that such patients’ self-reports are a valid source of data on days of hospitalisation and out-patient visits. However, costs of medication may be underestimated (Reference van den Brink, van den Hout and Stiggelboutvan den Brink et al, 2004).
Indirect costs
Our study indicated that inclusion of the indirect costs for patients with depression and/or anxiety was highly relevant. We did not assess productivity losses resulting from reduced efficiency at work and from unpaid work (e.g. household work), because of the practical and methodological difficulties involved in measuring these losses. Consequently, the actual productivity losses to society were probably underestimated.
In a population that has social insurance it is unlikely that respondents include the societal impact of ill health in quality-of-life measures, because they do not bear the full consequences of their reduced productivity (Reference Brouwer, Koopmanschap and RuttenBrouwer et al, 1997; Reference Meltzer and JohannessonMeltzer & Johannesson, 1999). Recently, an empirical study by Sendi & Brouwer (Reference Sendi and Brouwer2005) indicated that respondents do not include the effect of ill health on income if the instrument used does not explicitly ask about this effect (as is the case for the EQ–5D).
Cost-effectiveness
The results of our study are consistent with the findings of a systematic review on the effectiveness and cost-effectiveness of brief psychological treatments for depression (Reference Churchill, Hunot and CorneyChurchill et al, 2001). The review suggested that some forms of brief psychological treatment, particularly those derived from cognitive–behavioural models, are beneficial in the treatment of people with depression who are being managed outside the hospital setting (Reference Churchill, Hunot and CorneyChurchill et al, 2001).
A cost-effectiveness study by Pyne et al (Reference Pyne, Smith and Fortney2003) estimated the cost per QALY of a primary care intervention for women with depression. Its findings suggested that enhanced care for women with depression was more expensive and more effective than usual primary care, the additional cost being US$5244 per QALY.
Overall, we found no cost savings of brief therapy over CBT or care as usual. However, in terms of the MHCs, brief therapy was a cost-effective treatment and may help to reduce waiting lists. In routine practice, ‘stepped care’ is characterised not only by fewer sessions, but also by an earlier start after intake. Subsequently, the MHCs may increase the quality of care that they provide by a formalised approach, and be more successful in meeting the preferences of patients. This might allow redistribution of some resources to the group of patients who are not effectively treated. This treatment policy should be supported by a monitoring system for detecting inadequately treated patients to ensure that there is a timely switch to a more appropriate treatment option.
Clinical Implications and Limitations
CLINICAL IMPLICATIONS
-
▪ Care as usual (‘matched care’) was not more cost-effetive than brief psychological therapy or cognitive–behavioural therapy (‘stepped care’).
-
▪ Brief psychological therapy may help to reduce the waiting lists of mental health care centres.
-
▪ Brief psychological therapy reduces the costs of mental healthcare centres and may allow redistribution of resources to the group of patients who are ineffectively treated.
LIMITATIONS
-
▪ Data on the use of other healthcare services and on short-term absence from work were collected from patients with a limited recall period.
-
▪ Complete service use data for other healthcare services and data on absence from work for the total follow-up period (1.5 years) were available for less than half of the respondents.
-
▪ The study provided no opportunity to evaluate the cost-effectiveness of psychological treatment compared with natural recovery of the patient.
Acknowledgements
We thank J.B.Oostenbrink for his practical help with the cost analyses, and G. Koopmans for his comments on earlier drafts of this paper.
This study was funded by ZonMw (the main provider of financial support for independent research on health and healthcare in The Netherlands) and SBWOGG (an independent foundation).


eLetters
No eLetters have been published for this article.