Anorexia, i.e. a reduction in voluntary food intake, is a prominent feature of many infections, including gastrointestinal parasitism. In sheep, the occurrence of anorexia after nematode infection has been investigated mainly in parasite-naïve lambs(Reference Coop, Sykes and Angus1) and such studies have shown that food intake returns to normal when animals acquire a full immunity to the parasites(Reference Kyriazakis, Anderson, Coop and Jackson2, Reference Kimambo, Macrae, Walker, Watt and Coop3). Reproductive ewes, however, can experience a breakdown of their acquired immunity to parasites during their periparturient period (from late pregnancy through to early lactation) and this is generally referred to as the ‘periparturient relaxation of immunity’ (PPRI). The phenomenon manifests as an increase in faecal egg counts (FEC) and worm burdens(Reference Barger4–Reference Leyva, Henderson and Sykes6). However, there is scant evidence whether or not ewes experience a reduction in food intake during PPRI. In addition, it is unknown whether there are differences between breeds in the degree of anorexia during PPRI and whether these are linked to the production potential of the breeds.
Coop & Kyriazakis(Reference Coop and Kyriazakis7), while developing a nutrient partitioning framework that accounts for nutrient allocation towards the various physiological functions of the host, have suggested that PPRI has a nutritional basis. A number of studies have shown that the extent of the PPRI can be reduced by an increased intake of metabolizable protein (MP)(Reference Houdijk, Kyriazakis, Jackson, Huntley and Coop8, Reference Houdijk, Kyriazakis, Jackson and Coop9). Whether enhanced protein nutrition affects the degree of anorexia in infected periparturient ewes is not known. In addition, it has been suggested that breeds that have been selected more intensively for production traits (e.g. growth) are more susceptible to gastrointestinal infections than breeds that have been selected less intensively(Reference Bisset, Morris, McEwan and Vlassoff10–Reference Rauw, Kanis, Noordhuizen-Stassen and Grommers12). Whether or not such breed differences in production potential are reflected in the degree of anorexia following infection, is not known.
Maternal plasma leptin concentrations (PLC) in non-infected ewes decline progressively during late pregnancy and early lactation(Reference Ehrhardt, Slepetis, Bell and Boisclair13) and it has been suggested that this reduction in leptin could have negative effects on immune function(Reference Ingvartsen and Boisclair14). Adipose tissue metabolism plays an important role in the regulation of immune responses(Reference Fantuzzi15) and increased PLC as a result of infection or inflammation have been observed in many models of disease(Reference Barbier, Cherbut, Aube, Blottiere and Galmiche16, Reference Grunfeld, Zhao, Fuller, Pollock, Moser, Friedman and Feingold17). Although a similar role for leptin has been suggested for nematode-infected ewes by Valderrabano et al. (Reference Valderrabano, Gomez-Rincon and Uriarte18), this was not based on a comparison of leptin concentrations between infected and uninfected ewes.
The aim of the present study was to test the hypotheses that (1) nematode infected ewes experience anorexia during the occurrence of PPRI and the magnitude of anorexia is greater in ewes selected more intensively for high productivity than in ewes that have been selected less intensively, (2) the degree of anorexia can be reduced by dietary protein supplementation and (3) nematode infection of periparturient ewes will result in increased PLC compared to non-infected periparturient ewes.
Materials and methods
The Animal Experiments Committee of the Scottish Agricultural College approved the experimental protocol (AE ED 02/2005). The experiment was carried out under Home Office authority for experimental parasitic infection and repeated blood sampling (PPL 60/3004).
Animals, housing and husbandry
Sixty-four pregnant ewes, thirty-two Greyface crosses (G) and thirty-two Scottish Blackface (B), which were identified by scanning as bearing twins, were brought indoors 57 d (d− 57) before the realized mean parturition day (d0). Upon housing, ewes were orally drenched with Ivermectin (Oramec, Merial, UK) and Levamisole (Nilverm Gold, Schering-Plough, Welwyn Garden City, UK) according to manufacturers' instructions, in order to remove residual worm burdens from previous exposure to parasites. The mean body weight (BW) and body condition score (BCS) at d− 57 were 73·1 (se 1·13) kg and 3·1 (se 0·04) and 53·2 (se 1·00) kg and 2·5 (se 0·04) for G and B ewes, respectively. Ewes were housed in a naturally illuminated and ventilated shed in individual pens with solid floors until 5 weeks into lactation (d35). The pens were 1·5 × 2·0 m and were bedded with a thick layer of sawdust that was topped up when required. Each pen was equipped with two feeding bins and ewes had free access to water from a bucket all day. Feeding bins were raised above floor level, a practice which prevented lambs from consuming any of the feed offered to the ewes.
Experimental design
Ewes were assigned randomly to treatments on the basis of their BW and BCS measured on day− 57, and ensuring that an equal number (n 8) of similar ewes of each breed were allocated to each treatment. The experimental design was a 2 × 2 × 2 factorial, which involved the two breeds of sheep, two levels of infection (infected and uninfected controls) and two feeding treatments (protein supplemented and unsupplemented).
Infection treatments and infection details
The ewes were expected to have had previous exposure to gastrointestinal nematodes from field infections prior to housing. Following a 10 d adaptation period after housing, half of the ewes in each breed was trickle-infected (treatment: +) with the gastrointestinal nematode Teladorsagia circumcincta at a dose of 10 000 infective third-stage larvae, in 10 ml water, each Monday, Wednesday and Friday until the end of the experiment. Similar rates of infection have previously been shown to lead to establishment of a patent T. circumcincta worm burden in periparturient ewes(Reference Leyva, Henderson and Sykes6, Reference Houdijk, Kyriazakis, Jackson, Huntley and Coop19). The larvae were incubated from eggs that were harvested from fresh faeces of infected whether donor sheep every 14 d. Non-infected ewes (treatment: − ) were given a similar volume of water only (sham infection) at the same time, thus undergoing the same amount of handling as the infected ewes.
Feeding treatments and experimental diets
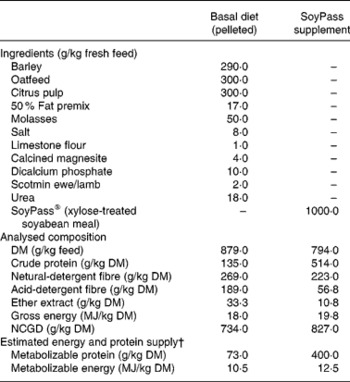
From housing until d− 28 all ewes were offered ad libitum hay as a sole diet in an effort to reduce BCS(Reference Tolkamp, Yearsley, Gordon, Illius, Speakman and Kyriazakis20). During late pregnancy, i.e. from d− 28, all ewes were fed ad libitum the same low-protein pelleted feed until the end of the experiment. This diet was formulated to provide sufficient energy, minerals and vitamins but less than the estimated MP requirements (Table 1) of the ewes. The feed provided an estimated 7 g MP/MJ metabolizable energy, while the requirements for such twin-bearing/lactating ewes are estimated to be 9 g MP/MJ metabolizable energy(Reference Houdijk, Kyriazakis, Jackson and Coop9, 21). For half of the ewes within each infection treatment this was the only food supplied (treatment: LP). The other half of the ewes in each infection treatment received, in a separate bin, an additional amount of a protein supplement (SoyPass®) which was calculated to increase the protein supply in the total feed to around 11 g MP/MJ metabolizable energy (treatment: HP). To supply sufficient MP, the amount of SoyPass offered to the HP ewes was based on the intake of ewes in the study of Houdijk et al. (Reference Houdijk, Kyriazakis, Jackson and Coop9). The amounts of SoyPass offered to the G ewes and the smaller B ewes were 330 and 250 g/d during d− 21 to d7 and 450 and 340 g/d during d7 to d35, respectively.

Measurements
Ewe and lamb performance and intake
Ewes were weighed at housing and then weekly throughout the study, as well as within 6 h after parturition. Lambs also were weighed within 6 h after birth and weekly thereafter. BCS estimates of ewes were first taken at housing and then weekly from d− 42 onwards. BCS was measured by lumbar palpation on a scale from 0 to 5 with 0·25 increments(Reference Russel, Doney and Gunn22) by the same operator. Ewe muscle and back-fat depths were measured by ultrasound scanning(Reference Glasbey, Abdalla and Simm23) from d− 42 onwards.
The amounts of distributed food were calculated daily to achieve ad libitum intake. Refusals were weighed twice weekly (Monday and Thursday) for calculation of average daily food intake (ADFI) and averaged 15 % of the amount of food offered, which is sufficient to measure ad libitum intake(Reference Minson24, Reference Blaxter25). Experimental foods were sampled while the daily allowances were being prepared and daily samples were bulked and analysed for DM, crude protein, neutral detergent fibre and minerals. There were no refusals of the restrictedly fed SoyPass supplement through the experiment. The refusals of the pelleted food were recorded on an as fed basis, as similar refusal levels were obtained for the individual animals and there was no evidence of feed separation in the bins.
Faecal egg counts
Faecal samples were taken twice weekly directly from the rectum, from day− 57 onwards and analysed for FEC according to a modified flotation method(Reference Christie and Jackson26). FEC was expressed as the number of eggs/g fresh faeces.
Plasma constituents
Blood samples were taken weekly from the jugular vein into heparinized vacutainers from day d− 50 (pre-infection) onwards. The blood samples were centrifuged for 15 min at 2600 g, and the separated plasma stored at − 20°C pending analysis for leptin, pepsinogen and albumin. Plasma pepsinogen was determined by the modified method of Paynter(Reference Paynter27) and expressed in IU (international units). Plasma albumin as an indicator of host protein nutrition was determined by a spectrophotometric method using a commercial clinical test: IL Test™ Albumin (Instrumentation Laboratory SpA, Milan, Italy) and results are reported in g/l.
Leptin RIA
PLC was determined by the use of a ruminant-specific leptin RIA as described previously by Zaralis et al. (Reference Zaralis, Tolkamp, Houdijk, Wylie and Kyriazakis28). This assay uses an anti-ovine leptin antiserum raised in guinea-pigs against recombinant ovine leptin (a gift from Prof. A. Gertler, The Hebrew University of Jerusalem) at a final assay dilution of 1:160 000. Pure recombinant ovine leptin (DSL Ltd, London, UK) was used as a standard at the following concentrations: 50, 25, 12·5, 6·25, 3·125, 1·56, 0·78, 0·395, 0·1975, 0·098 ng leptin/ml. Approximately 15 000 cpm of radiolabelled leptin (125I-leptin), prepared by iodination with sodium [125I]iodide (Amersham, UK), was added to each tube. The tubes were incubated for 48 h and then bound and free ligands were separated by addition of 100 μl of cellulose-bound anti-guinea-pig IgG (Sac-Cel; IDS, Washington, UK). After centrifugation (3000 rpm; 4°C; 20 min) supernatant containing unbound 125I-leptin was aspirated by vacuum pump via a trap and the residual, drained pellets were counted in a Cobra II gamma counter (Packard Canberra Ltd, UK). Six replicates of blood plasma from a fat (BCS>3·5) non-pregnant ewe and six from a lean (2·0 < BCS>3·5) non-pregnant ewe were used as high and low leptin controls throughout each assay. The mean PLC for these high and low controls were 7·37 (se 0·64) and 3·62 (se 0·36) ng/ml, respectively. The mean intra-assay CV were 9·0 and 10·2 % while the inter-assay CV were 14·5 and 17·5 % for high and low controls, respectively.
Statistical analysis
The data obtained for each ewe during the periparturient period were synchronized to day relative to parturition (d0). Mean lambing dates for G and B ewes were 20 April 2005 ± 1 d and 27 April 2005 ± 1 d, respectively. The average day relative to parturition associated with data obtained during the periparturient period was computed, and used to present the results.
ADFI, BW, BCS, muscle and back-fat depths were analysed by repeated measures ANOVA with an auto-regressive correlation structure for residual errors over time, using the MIXED procedure of SAS (SAS 9.1.3; SAS Institute Inc., Cary, NC, USA). The statistical models contained the fixed effects of breed, protein supplementation, infection, time, and their interactions. In every statistical model the random effect was animal nested within breed by treatment. Data are reported as least squares means and their standard error and their differences were tested by a t test.
Because ADFI and BW changed dramatically from pregnancy to lactation, data obtained during lactation and pregnancy were analysed separately and initial ewe BW difference from the mean breed BW measured on d− 57 was used as covariable. ADFI refers to the intake of fresh basal feed only and does not include the protein supplement. Achieved MP intake (MPI) of the ewes was calculated on the basis of ADFI and the protein content of the foods. MP requirements (MPR) for pregnant and lactating ewes were estimated on the basis of maternal BW and milk yield according to recommendations of the Agricultural and Food Research Council(21). The ratio MPI/MPR of all ewes was subjected to statistical analysis in order to determine the degree of protein limitation or adequacy in the two breeds.
Plasma leptin data were analysed also by ANOVA using the MIXED procedure of SAS for repeated measurements. Comparison of actual plasma leptin levels between treatments was made by a model that included the main effects of breed, infection, protein supplementation, time, and their interactions (model 1). Leptin data were also analysed by a similar model that contained either the back-fat measurements or the relative food intake (RFI; g/kg per d) of the ewes as a covariable in addition to the main effects of breed, infection, protein supplementation, time, and their interactions (model 2). The relationships between PLC and back-fat depth, and between PLC and RFI, were tested by comparing the respective covariable coefficient with its associated standard error. All models for leptin included an assay effect to take into account the between-assay variation. In every statistical model the random effect was animal nested within breed by treatment.
Lamb BW gain (g/d) was calculated by linear regression and data were analysed by ANOVA (general linear model) with the fixed effects of breed and treatment and litter sex (i.e. ♀♀, ♀♂ and ♂♂ litters).
FEC and pepsinogen data were log-transformed according to log10 (x+1), in order to normalize residuals, prior to statistical analysis. Log-transformed data were analysed by repeated measures ANOVA (GenStat Release 7.2; Lawes Agricultural Trust, Rothamsted Experimental Station, UK) as described earlier for the intake and performance measurements. FEC and pepsinogen data are reported as back-transformed means (according to 10α, where ![]() )(Reference Johnson, Kotz and Balakrishnan29) with 95 % CI (lower and upper limit). FEC of non-infected ewes were all zero throughout the experiment and these were, therefore, not included in the statistical analysis.
)(Reference Johnson, Kotz and Balakrishnan29) with 95 % CI (lower and upper limit). FEC of non-infected ewes were all zero throughout the experiment and these were, therefore, not included in the statistical analysis.
Results
The balanced structure of the experiment (eight ewes per breed per treatment) was not maintained throughout the study. One ewe had still-born lambs (treatment LP+, B), three ewes failed to adapt to the experimental feeds (one treatment HP+, B; one treatment LP − , B; and one treatment LP − , G) and one ewe gave birth to triplets (treatment HP − , G). The data obtained from these animals were excluded from the statistical analysis and treated as missing values.
Faecal egg counts
Mean back-transformed FEC for infected ewes are shown in Fig. 1. There was a significant breed effect on FEC (P < 0·001) as a result of higher eggs/g fresh faeces values in G than in B ewes. Protein supplementation resulted in a significant decrease (P = 0·038) in FEC, but the interaction between protein supplementation and breed was not significant (P = 0·23). As expected, FEC changed significantly over time (P < 0·0001). In all treatment groups, FEC were low until d− 21 ( < 17 eggs/g fresh faeces upper limit), increased with time to peak during early lactation and then tended to decrease towards the end of the experiment. Maximum FEC for both breeds were observed on the LP treatment, i.e. on d7 for B ewes (119 eggs/g fresh faeces; 95 % CI 67, 213) and on d28 for G ewes (648 eggs/g fresh faeces; 95 % CI 325, 1294). Mainly as a result of these differences, the interaction of time with breed was significant (P = 0·005).

Fig. 1 Faecal egg counts (FEC; epg, number of eggs per g fresh faeces) of Greyface cross (○, ●) and Scottish Blackface (□, ■) twin-bearing/lactating ewes, trickle infected with 30 000 third-stage infective larvae of Teladorsagia circumcincta per week and offered a protein supplement (○, □) or not (●, ■) during the periparturient period (d− 28 to d33 of parturition (d0)). The trickle infection started on d− 47. Values are back-transformed means with 95 % CI depicted by vertical bars.
Food intake
Fig. 2 shows the observed mean ADFI of G and B ewes from d− 24 until d31 of the experiment. Breeds did not differ in ADFI during late pregnancy (d− 24 to d0; P = 0·53) or lactation (d0 to d31; P = 0·85). ADFI in both breeds did not change with time during late pregnancy (P = 0·09) but increased significantly during lactation in both breeds (P < 0·001). Nematode infection resulted in a significant reduction in ADFI in both breeds during late pregnancy (reduction around 12 %; P = 0·026) and even more so during lactation (reduction around 22 %; P = 0·0036). Interactions between breed and infection were not significant in either period (P>0·5). Protein supplementation resulted in higher ADFI in G ewes but not in B ewes especially during lactation as indicated by the significant interaction between breed and protein supplementation (P = 0·011; see also Fig. 2 and Table 2). The interaction between protein supplementation and infection was not significant during either late pregnancy (P = 0·58) or lactation (P = 0·86), which showed that protein supplementation did not affect the extent of the observed anorexia.

Fig. 2 Average daily food intake of Greyface cross (a) and Scottish Blackface (b) twin-bearing/lactating ewes, trickle infected with 30 000 third-stage infective larvae of Teladorsagia circumcincta per week (●, ■) or non-infected (○, □) and offered a protein supplement (○, ●) or not (□, ■) during the periparturient period (d− 28 to d33 of parturition (d0)). The trickle infection started on d− 47. Values are group means with their standard errors depicted by vertical bars.
Table 2 Achieved average daily fresh food intake from basal diet (kg) and total metabolizable protein (MP; g) intakes of twin-bearing/lactating ewes that received (HP) or did not receive (LP) a protein supplement and were infected (+) or not infected (−) with the nematode Teladosargia circumcincta †

MPI, MP intake; MPR, MP requirement.
Values were significantly different: *P < 0·05, **P < 0·01, ***P < 0·001 (B, breed (Greyface cross v. Scottish Blackface); I, infection (+v. − ); P, protein supplementation (HP v. LP)).
† For details of procedures and chemical analysis, see the Materials and methods section and Table 1. Infection started on d− 47 relative to parturition (d0) and animals were receiving orally 30 000 third-stage infective larvae per week. Non-infected animals were receiving only water (‘sham’ infected). Protein supplementation started on d− 28. The protein supplement was SoyPass® (xylose-treated soyabean meal).
‡ Based on error mean squares pooled over treatment groups.
§ Estimated MPR for twin-bearing ewes based on maternal body weight were 142 and 129 g for Greyface cross and Scottish Blackface ewes, respectively. Estimated MPR for lactating ewes based on maternal body weight and assuming milk yield of 3 and 2 kg/d were 248 and 203 g for Greyface cross and Scottish Blackface ewes, respectively (according to the Agricultural and Food Research Council(21)).
Protein supplementation resulted in MP intakes that were higher than the estimated MP requirements, during both late pregnancy and lactation in both breeds (Table 2). Ewes that were fed the low-protein basal diet only had a ratio of MP intake to MP requirements (MPI:MPR) below 1. This ratio was much lower for G ewes than for B ewes, which resulted in a significant interaction between the effects of protein and breed during both late pregnancy and lactation (Table 2).
Ewe and lamb performance
During both periods, G ewes were heavier than B ewes (P < 0·0001; see Fig. 3). Infected ewes in both breeds had lower BW than non-infected ewes during both late pregnancy (P = 0·003) and lactation (P = 0·0002). A difference in ewe BW between HP and LP treatments was observed only in G ewes and this was reflected by a significant interaction between breed and protein supplementation during both late pregnancy (P = 0·04) and lactation (P = 0·01; see Fig. 3). There was also a significant interaction between breed and time on ewe BW because B ewes gained more BW than G ewes, but this was apparent only during lactation (P = 0·003). G ewes lost more BCS over time than B ewes did as indicated by a significant interaction between breed and time (P < 0·0001). On average, infected ewes had lower BCS compared to non-infected ewes as shown by the main effect of infection (P = 0·016; Table 3) but the infection by time interaction was not statistically significant (P = 0·22). Unsupplemented ewes lost more BCS compared to protein-supplemented ewes over time as shown by the interaction between protein supplementation and time (P = 0·0003).

Fig. 3 Weekly body weight of Greyface cross (a) and Scottish Blackface (b) twin-bearing/lactating ewes, trickle infected with 30 000 third-stage infective larvae of Teladorsagia circumcincta per week (●, ■) or non-infected (○, □) and offered a protein supplement (○, ●) or not (□, ■) during the periparturient period (d− 28 to d33 of parturition (d0)). The trickle infection started on d− 47. Values are group means with their standard errors depicted by vertical bars.
Table 3 Average body condition score (BCS) and muscle depth (MD) of twin-bearing/lactating ewes that received (HP) or did not receive (LP) a protein supplement and were infected (+) or not infected (−) with the nematode Teladosargia circumcincta †

Values were significantly different: *P < 0·05, **P < 0·01, ***P < 0·001 (B, breed (Greyface cross v. Scottish Blackface); I, infection (+v. − ); P, protein supplementation (HP v. LP)).
† For details of procedures and chemical analysis, see Materials and methods section and Table 1. Infection started on d− 47 relative to parturition (d0) and animals were receiving orally 30 000 third-stage infective larvae per week. Non-infected animals were receiving only water (‘sham’ infected). Protein supplementation started on d− 28. BCS and MD were measured weekly from d− 42 to d30. The protein supplement was SoyPass® (xylose-treated soyabean meal).
‡ Based on error mean squares pooled over treatment groups.
At lambing, mean whole-litter BW of G and B ewes were 10·6 (se 0·26) and 6·6 (se 0·26) kg (P < 0·0001). Mean daily litter BW gains were 559 (se 29) and 419 (se 27) g/d for G and B ewes, respectively (P = 0·001). Litter sex tended to affect litter birth weight with ♀♀, ♀♂ and ♂♂ litter mean weights of 9·9, 10·9 and 10·8 kg in G ewes and 5·9, 7·0 and 6·9 kg in B ewes (se 0·4, P = 0·07). Across treatments, HP ewes produced heavier litters than LP ewes (P = 0·03) but there were no differences in birth weights between litters produced by infected and non-infected ewes (P = 0·3). There was a significant breed × protein supplementation interaction due to the faster growth of the G lambs from the HP treatment (P = 0·006). Litters nursed by infected ewes tended to have lower whole-litter BW gain (P = 0·1) than litters nursed by non-infected ewes but the interaction between breed and infection on whole-litter weight gain was not significant (P = 0·8).
Back-fat and muscle depth
Mean back-fat depth was considerably higher in G ewes (4·3, se 0·11 mm) than in B ewes (2·0 (se 0·11) mm) during the periparturient period (P < 0·0001) but because G ewes lost more BCS than B ewes the interaction between breed and time was significant (P < 0·0001; Fig. 4). Back-fat depth was affected positively by protein supplementation over time (P = 0·04) and negatively by infection (P = 0·05) in both breeds.

Fig. 4 Weekly back-fat depth of Greyface cross (a) and Scottish Blackface (b) twin-bearing/lactating ewes, trickle infected with 30 000 third-stage infective larvae of Teladorsagia circumcincta per week (●, ■) or non-infected (○, □) and offered a protein supplement (○, ●) or not (□, ■) during the periparturient period (d− 28 to d33 of parturition (d0)). The trickle infection started on d− 47. Values are group means with their standard errors depicted by vertical bars.
In ewes of both breeds, muscle depth decreased during late pregnancy (P < 0·001). During lactation, muscle depth remained almost static in G ewes but increased in B ewes; that was reflected by a significant breed × time interaction (P < 0·001). Infected ewes had significantly lower muscle depth compared to non-infected ewes in both breeds (P = 0·02; Table 3). Protein supplementation did not affect muscle depth in B ewes but it had a positive effect in G ewes as shown by a statistically significant interaction between breed and protein supplementation (P = 0·03; Table 3).
Plasma constituents
Plasma pepsinogen
Plasma pepsinogen concentrations were similar in non-infected ewes of both breeds, were not affected by protein supplementation and did not change systematically with time (Fig. 5). Infected ewes had higher plasma pepsinogen concentrations than non-infected ewes and differences were significant from the first week of infection in both breeds (P < 0·0001). Protein supplementation had no effect on pepsinogen concentrations in B ewes but it resulted in a decrease in plasma pepsinogen concentration in G ewes from parturition until the fourth week of lactation; this was reflected by significant breed × protein supplementation interaction (P = 0·017).

Fig. 5 Pepsinogen concentrations of Greyface cross (a) and Scottish Blackface (b) twin-bearing/lactating ewes, trickle infected with 30 000 third-stage infective larvae of Teladorsagia circumcincta per week and offered a protein supplement (○) or not (●) during the periparturient period (d− 28 to d33 of parturition (d0)). The trickle infection started on d− 47. Data from non-infected ewes are also shown (■) and were averaged across the nutritional treatments. Values are back-transformed means with 95 % CI depicted by vertical bars.
Plasma albumin
Plasma albumin concentrations across treatments were 32·6 and 31·1 (se 0·8) g/l for G and B ewes, respectively. Plasma albumin concentrations increased from late pregnancy to lactation in both breeds (P < 0·0001). Ewes on the LP treatment had significantly lower plasma albumin concentrations compared to ewes on the HP treatment (P = 0·0002) and these differences were more pronounced during lactation. The breed by protein supplementation interaction was not significant (P = 0·65). Infection resulted in significantly lower plasma albumin concentrations in both HP- and LP-treated ewes of both breeds (P = 0·02).
Plasma leptin
Analysis of PLC with model 1 (no covariables included) showed no effect of infection (P = 0·77) or of protein supplementation (P = 0·52) but PLC was higher (P = 0·005) in G (1·2 (se 0·11) ng/ml) than in B ewes (0·7 (se 0·11) ng/ml). However, the breed difference in PLC disappeared (P = 0·43) when data were analysed with model 2, in which, back-fat depth was included as a covariable. This model showed that there was a statistically significant (P < 0·001) positive relationship between PLC and back-fat depth, as evidenced by the covariable coefficient and the interaction between breed and back-fat depth was found to be statistically non-significant (P = 0·22). The estimated covariable coefficient showed that a difference in back-fat depth of 1 mm was associated with a difference in PLC of 0·184 (se 0·028) ng/ml (P < 0·001). According to this model PLC was also not affected by infection (P = 0·87) or protein supplementation (P = 0·54). The model that included RFI as a covariable showed that there was no statistical evidence of a relationship between PLC and RFI (P = 0·27) but the breed effect remained significant (P = 0·005). All models showed that PLC was affected by time (P < 0·001), mainly because of the gradual increase in PLC after parturition.
Discussion
A T. circumcincta challenge was imposed upon half of the experimental periparturient ewes of two different breeds which did or did not receive a protein supplement to evaluate the effects of infection, breed and protein supplementation on parasite-induced anorexia and PLC. The effects of breed and protein supplementation on PPRI will be considered before we discuss the results in relation to the hypotheses developed in the introduction.
Effects of breed and protein supplementation on periparturient relaxation of immunity
Periparturient ewes displayed a loss of their acquired immunity to T. circumcincta infection as evidenced by an increase in FEC during late pregnancy and lactation. FEC as an indirect measure of immunity has proven to be an effective criterion with which to assess the extent of PPRI in ewes and it has frequently been used to compare differences in resistance to infection between breeds(Reference Barger4, Reference Donald, Morley, Waller, Axelsen, Dobson and Donnelly5, Reference Bisset, Morris, McEwan and Vlassoff10, Reference Good, Hanrahan, Crowley and Mulcahy30–Reference Amarante, Barbosa, Deoliveira and Siqueira33). In the LP treatment, infected G ewes had FEC which were more than five times higher than that of B ewes (Fig. 1). In addition, the relaxation of immunity occurred earlier in G ewes compared to B ewes as indicated by the significant rise in FEC during late pregnancy (Fig. 1). Significant differences in the extent and timing of PPRI between the two breeds suggest that B ewes were more resistant to T. circumcincta infection than G ewes under the same plane of nutrition.
In agreement with previous studies(Reference Houdijk, Kyriazakis, Jackson, Huntley and Coop8, Reference Houdijk, Kyriazakis, Jackson and Coop9), protein supplementation in G ewes limited the extent of PPRI during late pregnancy as evidenced by the significantly lower FEC during lactation (d7 onwards; Fig. 1). In B ewes, with the exception of the first week of lactation, the differences in FEC between HP and LP treatments were not as large as they were in G ewes (Fig. 1). Protein supplementation resulted also in lower pepsinogen levels, an indicator of mucosal damage by the parasite, in G ewes during lactation but it did not affect pepsinogen levels in B ewes (Fig. 5).
The finding that the two breeds differed significantly in their resistance to infection could be due to the enhanced genetic resistance of the B breed per se. However, the nutrient partitioning framework of Coop & Kyriazakis(Reference Coop and Kyriazakis7) suggests that the degree of nutrient scarcity can affect the degree of breakdown of immunity to parasites. Several studies with ewes(Reference Houdijk, Kyriazakis, Jackson, Huntley and Coop8, Reference Houdijk, Kyriazakis, Jackson and Coop9, Reference Donaldson, van Houtert and Sykes34), goats(Reference Chartier, Etter, Hoste, Pors, Mallereau, Broqua, Mallet, Koch and Masse35) and more recently with rats(Reference Houdijk, Jessop, Knox and Kyriazakis36) have shown that dietary MP scarcity exaggerates the extent of PPRI while an increased supply of, or a decreased demand for, MP reduces PPRI. Based on their own ad libitum food intake, unsupplemented G ewes achieved a lower proportion of their MP requirements than unsupplemented B ewes, as discussed later. This in itself could be sufficient explanation for the differences in PPRI observed between the two breeds. Whether B ewes would have displayed the same degree in PPRI as G ewes if they had been fed to the same degree of MP scarcity remains to be investigated.
Effects of breed and infection on food intake
Although the effects of gastrointestinal infection on sheep immune response has been studied extensively(Reference Barger4), our knowledge of the effects of nematode infection on food intake changes in periparturient ewes is limited. The only investigation of effects of nematode infection on ADFI in periparturient ewes is from Leyva et al. (Reference Leyva, Henderson and Sykes6) and their study reported a reduction in food intake. Nematode-infected barren ewes that maintain their acquired immunity to nematodes do not show a reduction in food intake(Reference Greer, Stankiewicz, Jay, McAnulty and Sykes37). This suggests that in periparturient ewes the occurrence of anorexia is related to the relaxation of immunity.
The results show that infected ewes had significantly lower food intake than non-infected ewes during the periparturient period. However, the degree of anorexia was not strongly associated with the differences in the extent of the PPRI between the high and the lower production potential breed. Therefore, the results of the present study do not support the hypothesis that anorexia is greater in ewes selected more intensively for high productivity than in ewes that have been selected less intensively. Leyva et al. (Reference Leyva, Henderson and Sykes6) reported a 16 % reduction in food intake during lactation in parasitized Poll Dorset ewes fed on a good quality diet (145 g crude protein/kg DM), but they did not observe any reduction in food intake during late pregnancy. The present findings that infected ewes experienced a reduction in food intake during late pregnancy (around 12 %) as well as during lactation (around 22 %) show that anorexia in periparturient ewes can occur before any increase in FEC is observed.
Leyva et al. (Reference Leyva, Henderson and Sykes6) supported the view that the occurrence of anorexia in periparturient ewes is unlikely to be attributable to abomasal damage, as suggested by Sykes & Coop(Reference Sykes and Coop38) based on an experiment with parasitized lambs. Although the mechanisms underlying the parasite-induced anorexia in sheep remain unclear, a recent study has shown that the occurrence of anorexia in parasitized sheep is associated with the development (acquisition) of the immune response rather than the expression of immunity per se (Reference Greer, Stankiewicz, Jay, McAnulty and Sykes37). Immune response was not dependent on IgA production and was not accompanied by a reduction in food intake in non-pregnant or non-lactating ewes(Reference Greer, Stankiewicz, Jay, McAnulty and Sykes37). Nevertheless, a significant increase in IgA levels is closely associated with the rise in FEC in periparturient ewes(Reference Jeffcoate, Wedrychowicz, Fishwick, Dunlop, Duncan and Holmes39, Reference Sykes, Xie, Stankiewicz, Huntley, Mackellar, Sedcole, McAnulty and Green40) but also in infected parasite-naïve lambs(Reference Stear, Strain and Bishop41). Greer et al. (Reference Greer, Stankiewicz, Jay, McAnulty and Sykes37) suggested that the physiological changes associated with the acquisition phase of the immune response, characterized by the stimulation of IgA production, are responsible for the loss in appetite in infected parasite-naïve lambs. Because mature animals restore their immune response following the PPRI, it is possible that the parasite-induced anorexia in periparturient ewes is related to the developing immune responses which eventually lead to the restoration of immunity.
Effects of protein supplementation on food intake and performance
The extent of PPRI in ewes is sensitive to dietary protein intake(Reference Houdijk, Kyriazakis, Jackson, Huntley and Coop8, Reference Donaldson, van Houtert and Sykes34). For that reason we also investigated how protein supplementation affected the degree of anorexia in periparturient ewes. G ewes were heavier and lambs nursed by G ewes had significantly higher BW and weight gain than lambs nursed by B ewes (Fig. 3). These differences imply that G ewes had a greater MP demand for maintenance, late pregnancy and lactation than B ewes(21, Reference Robinson, Foster and Forbes42), supporting the rationale for feeding a higher protein supplement to G ewes on the HP treatment. However, in order to be able to measure anorexia as a result of infection, all ewes were fed ad libitum. G ewes on the HP treatments did indeed consume more basal diet than B ewes and all HP groups achieved an MP intake that was more than adequate in relation to their requirements, as intended.
Unexpectedly, LP ewes of both breeds consumed similar amounts of basal diet, which resulted in G ewes consuming a lower proportion of their MP requirements than B ewes during late pregnancy and during lactation (see Table 2). Therefore, over the entire periparturient period, MP supply was more limiting in G ewes than in B ewes. Since the Agricultural and Food Research Council(21) system does not take into account effects of urea recycling on MP scarcity, it seems likely that MP supply on the LP treatment was underestimated(Reference Van Soest43). Performance of B ewes and their lambs was similar in supplemented and unsupplemented treatments, suggesting that the MP limitation must have been small. In contrast, unsupplemented G ewes lost more weight (Fig. 3) and their lambs gained less weight than their counterparts in the supplemented treatments. The present observations agree with the MP supply data that the MP limitation was much more severe in G than in B ewes.
Protein supplementation had no significant effect on the degree of anorexia in either breed because the reduction in ADFI was similar in the HP and LP treatments. The present finding does, therefore, not support the hypothesis that protein supplementation can lower the extent of anorexia in a manner similar to its effect on PPRI. In the only other study that investigated effects of food quality on anorexia, the degree of anorexia following trypanosome infection was also similar in goats that received either a high- or a low-protein food(Reference van Dam, Hofs, Tolkamp and Zwart44). We conclude that protein supplementation affected PPRI as measured by FEC but not anorexia and that the latter two variables are, therefore, not strongly related.
The significant interactions between breed and protein supplementation on ewe BW and whole-litter BW provide indirect evidence of differences between breeds in the extent to which their protein demands were met. However, the present results may not have been the exclusive effect of differences in protein scarcity because they could well have been affected by the differences in total ADFI between G ewes on the HP and LP treatments. The differences between breeds in protein scarcity as a result of the LP treatment were, to some extent, also reflected in the lower muscle depth in G ewes, but not in B ewes, when compared to their HP counterparts, since it has been shown that MP undernutrition reduces the weights of a range of proteinaceous body components(Reference Sykes and Field45, Reference Houdijk, Kyriazakis, Coop and Jackson46). In addition, excess MP can improve abomasal integrity restoration which in turn leads to lower plasma pepsinogen concentrations in infected ewes(Reference Houdijk, Kyriazakis, Jackson, Huntley and Coop19). Accordingly, the absence of a significant effect of protein supplementation on pepsinogen concentrations in B ewes, in contrast to G ewes, could also be a reflection of the differences in protein scarcity between the two breeds.
Effects of infection on plasma leptin concentration in relation to back-fat reserves
An important role in the relationship between nutritional status and immune function has been recently ascribed to leptin(Reference Lord, Matarese, Howard, Baker, Bloom and Lechler47). Changes in PLC in response to inflammation have been suggested to be important for the animals' ability to cope with, and survive, infections(Reference La Cava and Matarese48). Therefore, we tested the hypothesis that nematode infection of periparturient ewes will result in increased PLC.
Data obtained in a recent study(Reference Valderrabano, Gomez-Rincon and Uriarte18) suggested that differences in the immune response appeared to be associated with differences in serum leptin levels in periparturient ewes infected with Haemonchus contortus. Although the study was the first to address the possible implication of leptin during the periparturient immune response in ewes, the results were difficult to interpret because of the absence of any non-infected control ewes in that experiment. The experimental design of the present study allowed a direct comparison of PLC between infected and non-infected ewes during the periparturient period. Since a positive relationship between adiposity and PLC exists in ruminants(Reference Chilliard, Bocquier, Delavaud, Faulconnier, Bonnet, Guerre-Millo, Martin and Ferlay49, Reference Delavaud, Ferlay, Faulconnier, Bocquier, Kann and Chilliard50), the statistical model for PLC analysis included body fat depth as covariable to take this into account. The present results showed that PLC was affected significantly by time. The results are in accordance with the finding that maternal PLC in ewes declines from mid-pregnancy to early lactation where it reaches a nadir and increases gradually thereafter(Reference Ehrhardt, Slepetis, Bell and Boisclair13). The present results also show that PLC was positively correlated with back-fat depth, which is consistent with previous observations. Infected ewes tended to have lower back-fat depth and significantly lower BCS. However, when differences in back-fat reserves were accounted for, infected ewes did not differ in their PLC from non-infected ewes, which suggests that PLC are unlikely to be increased as a result of infection in periparturient ewes. In addition, despite protein supplementation that resulted in increased albumin and lower pepsinogen levels and reduced the extent of PPRI in periparturient ewes, PLC was not significantly affected by the level of protein supplementation. This further suggests that PLC are unlikely to be involved in MP partitioning towards the physiological functions of the host. Reduced appetite in ruminants has previously been ascribed primarily to physical limitations of the gastrointestinal tract, but metabolic signals may play an equally important role(Reference Tolkamp, Emmans and Kyriazakis51, Reference Ingvartsen and Andersen52). Although a role for leptin for the anorexia of infection has been proposed in other models of disease(Reference Barbier, Cherbut, Aube, Blottiere and Galmiche16, Reference Grunfeld, Zhao, Fuller, Pollock, Moser, Friedman and Feingold17), the present results suggest that leptin is unlikely to contribute to the reduction in appetite in infected periparturient ewes because PLC did not differ between infected and control ewes and PLC was not strongly associated with RFI.
Conclusions
The present study showed that T. circumcincta infection resulted in anorexia in periparturient ewes of each of two breeds differing in production potential, and that the anorexia can occur before any increase in FEC is observed. The differential breed responses to nematode infection were not associated with breed differences in anorexia. The results add to the growing body of evidence that where breakdown of immunity to T. circumcincta infection occurs under conditions of protein scarcity, the supplementation with protein can lower the extent of the breakdown. However, the hypothesis that dietary protein supplementation can reduce the magnitude of anorexia in periparturient ewes had to be rejected. The results were also not consistent with the hypothesis that nematode infection of periparturient ewes would result in increased PLC and it is unlikely that leptin is involved in the occurrence of anorexia of nematode-infected periparturient ewes.
Acknowledgements
We wish to thank Lesley Deans, Dave Anderson and Terry McHale for care of the animals, data collection and parasitological technical support and Emmanuel McAughey for assistance with leptin immunoassays. We are also grateful to the Scottish Government for financial support, to Mitch Lewis and Colin Morgan for advice on diet formulation and to Ian Nevison of BioSS for statistical advice. K. Z. is grateful to the Hellenic State Scholarship Foundation for the provision of a postgraduate scholarship. None of the authors has a conflict of interest in relation to this study. This paper has resulted from the postgraduate studies of K. Z. and is part of his PhD thesis. All other authors have contributed equally to the paper.