


1. Introduction
Splashing, resulting from drop impact onto a film of another liquid is of high significance due to its importance in many industrial applications. For example, fuel mixture preparation and emissions in modern combustion engines are influenced by the interaction of fuel spray drops impacting onto lubricating oil films in the cylinder. Spray cooling during the process of hot forging (Yang, Liu & Shivpuri Reference Yang, Liu and Shivpuri2005) or functional printing (Layani, Berman & Magdassi Reference Layani, Berman and Magdassi2014) are further examples of technologies that involve drop/film interaction of different liquids. In these examples the drop/wall interaction is affected by the fact that the drop and the liquid film on the wall are different liquids and may exhibit different degrees of miscibility.
Among the quantities most often studied in the field of drop impact are the splashing threshold in terms of dimensionless impact parameters, diameter of the secondary droplets and their combined mass compared to the mass of the impacting drop, as well as the diameter of the corona. The functional dependencies of these quantities are described using the Weber number,  $We = \rho D_0 U_0^2/\sigma$, the Reynolds number,
  $Re =\rho D_0 U_0/\mu$, (or their combination) and the dimensionless initial wall film thickness,
  $\tilde {\delta }=H_{f0}/D_0$, where
  $U_0$ is the drop impact velocity,
  $D_0$ is the drop diameter and
  $H_{f0}$ is the initial wall film thickness,
  $\rho$,
  $\mu$, and
  $\sigma$ are the liquid density, viscosity and surface tension, respectively. Comprehensive reviews of drop impact phenomena and their modelling can be found in the literature (Yarin Reference Yarin2006; Marengo et al. Reference Marengo, Antonini, Roisman and Tropea2011; Josserand & Thoroddsen Reference Josserand and Thoroddsen2016; Yarin, Roisman & Tropea Reference Yarin, Roisman and Tropea2017).
The understanding of the dynamics of drop impact onto a liquid film is based on the seminal work of Yarin & Weiss (Reference Yarin and Weiss1995), where an asymptotics solution for an inviscid wall flow is found and the splash phenomena are described as a propagation of a kinematic discontinuity in a spreading liquid film on the wall. This study proposes a reliable and widely accepted form for the description of the splashing threshold, which depends, among other parameters, on the drop impact frequency. Following this theory, the outward lamella velocity  $\tilde {u}$, the lamella thickness
  $\tilde {h}$ and the radius of the corona
  $\tilde {R}_c$ can be expressed in dimensionless form as
 \begin{equation} \tilde{u}=\frac{\tilde{r}}{\tilde{t}+\tilde{\tau}},\quad \tilde{h}=\frac{\tilde{\eta}}{(\tilde{t}+\tilde{\tau})^2}, \quad \tilde{R}_c=\tilde{\beta} \sqrt{\tilde{t}+\tilde{\tau}}, \end{equation}
where  $\tilde {\tau }$,
  $\tilde {\beta }$ and
  $\tilde {\eta }$ are dimensionless constants determined by the parameters of the impact. Here the drop initial diameter is used as a length scale, the impact velocity as a velocity scale and their ratio as a time scale.
Propagation of the corona in a liquid film has been studied in Roisman, van Hinsberg & Tropea (Reference Roisman, van Hinsberg and Tropea2008). Experiments show that surface tension influences the evolution of the corona radius, leading to its deviation from the predicted square-root dependence of  $\tilde {R}_c$ on time, (1.1a–c). Moreover, surface tension and gravity lead to a receding of the impact crater in the film fluid after its diameter reaches the maximum value
  $D_{max}$. The dimensionless maximum crater diameter and the corresponding dimensionless spreading time
  $\tilde {t}_{max}$ are only slightly dependent on the initial film thickness and on the liquid viscosity, and are determined mainly by the Weber number.
Many subsequent studies have confirmed these relations experimentally (Cossali, Coghe & Marengo Reference Cossali, Coghe and Marengo1997; Bakshi, Roisman & Tropea Reference Bakshi, Roisman and Tropea2007) for drops impacting onto a thin liquid film. However, it should be noted that these expressions are valid only for cases when the film thickness is much thicker than the viscous boundary layer, which would be formed by the spreading lamella at the wall surface. The viscous boundary layer leads to a damping of the spreading lamella and to formation of a residual film (Yarin & Weiss Reference Yarin and Weiss1995; Roisman Reference Roisman2009).
Among the well-studied outcomes of drop impact onto a wetted substrate are drop deposition, drop bouncing and corona splash. As to which of these phenomena occur is determined by inertial, viscous and capillary forces. The phenomenon of splash is one of the most important phenomena because of being central in many industrial applications, especially due to the liquid mass that does not remain on the surface, but is rather ejected in the form of a corona and, finally, secondary droplets.
Two main types of splashing have been observed upon drop impact (Worthington & Cole Reference Worthington and Cole1897; Harlow & Shannon Reference Harlow and Shannon1967; Levin & Hobbs Reference Levin and Hobbs1971; Macklin & Metaxas Reference Macklin and Metaxas1976; Wang & Chen Reference Wang and Chen2000; Rioboo, Tropea & Marengo Reference Rioboo, Tropea and Marengo2001): prompt splash and corona splash. Also, under certain conditions corona detachment has been observed upon spray impact in microgravity, Roisman et al. (Reference Roisman, Gambaryan-Roisman, Kyriopoulos, Stephan and Tropea2007), leading to the formation of larger secondary droplets formed from the corona rim. Empirical correlations were formulated for the splashing threshold based on the experiments of Rioboo et al. (Reference Rioboo, Bauthier, Conti, Voue and De Coninck2003) and Cossali et al. (Reference Cossali, Coghe and Marengo1997).
One important phenomenon is the rupture of the liquid film on a wall as a result of the fast spreading produced by drop or spray impact (Kadoura & Chandra Reference Kadoura and Chandra2013). The flow instability leading to the film rupture can be enhanced by the presence of the second liquid of different surface tension. This phenomenon could potentially increase the wall deposition ratio significantly, for example, under conditions typical of those found in internal combustion engines.
Several studies focused on the investigation of complex liquid drop impact, for example, suspensions or emulsions (Prunet-Foch et al. Reference Prunet-Foch, Legay, Vignes-Adler and Delmotte1998; Derby & Reis Reference Derby and Reis2003; Bolleddula, Berchielli & Aliseda Reference Bolleddula, Berchielli and Aliseda2010; Derby Reference Derby2010; Hao et al. Reference Hao, Zhou, Zhou, Che, Chu and Wang2016), or encapsulated drops (Chiu & Lin Reference Chiu and Lin2005) onto dry substrates. One recent study by Lhuissier et al. (Reference Lhuissier, Sun, Prosperetti and Lohse2013) is devoted to the impact of a liquid drop onto a deep pool of another immiscible liquid. It was shown that at some threshold velocity the impact leads to drop disintegration into several fragments and, thus, to liquid emulsification. Similar phenomena could occur after drop impact onto a liquid film, if the impact velocity is high enough.
In Kittel, Roisman & Tropea (Reference Kittel, Roisman and Tropea2018) the splashing threshold of a liquid drop impacting onto a solid substrate wetted by another liquid was studied. Three main regions are identified. For the case when the kinematic viscosity of the wall film ( $\nu _f$) is much higher than the kinematic viscosity of the drop (
 $\nu _d$), the properties of the drop govern the process of splashing. For the case of drop kinematic viscosity much higher than that of the film, the splash is governed by the properties of the film. For the case when the kinematic viscosities of the film and the drop are comparable, the splashing threshold depends on the viscosity ratio, defined as
  $\tilde {\kappa }_\nu =\nu _f/\nu _d$.
In the present experimental study the impact of a liquid drop onto a solid substrate wetted by another liquid is investigated. A range of impact parameters and combinations of liquid properties have been determined for which the corona produced by the impact completely detaches from the film. The detachment typically starts at a single point, but propagates extremely fast around the circumference of the corona, often within one or two frames of the videos, taken at up to 50 000 fps. The corona detachment is a mode of splashing that leads to the generation of secondary drops. This phenomenon has been observed before (Roisman et al. Reference Roisman, Gambaryan-Roisman, Kyriopoulos, Stephan and Tropea2007; Geppert et al. Reference Geppert, Terzis, Lamanna, Marengo and Weigand2016), but the mechanisms of corona detachment and the conditions leading to this phenomenon have not been conclusively analysed or understood. The present work contains such an analysis and provides a self-consistent theory of this phenomenon.
2. Experimental method
The experimental set-up, shown in figure 1, consists of three parts, the drop generator, the impact substrate and the observation system. The drop generator is based on a drop-on-demand design. A micropump transports fluid from a reservoir tank to the cannula. The fluid forms a drop at the tip of the cannula. The drop drips off the cannula tip by gravity, once a critical mass is reached. The initial drop diameter ( $D_0$) is varied in this study from 1.45 mm to 3 mm. The impact velocity of the drop (
 $U_0$) is varied by varying the height of the cannula tip above the impact substrate.
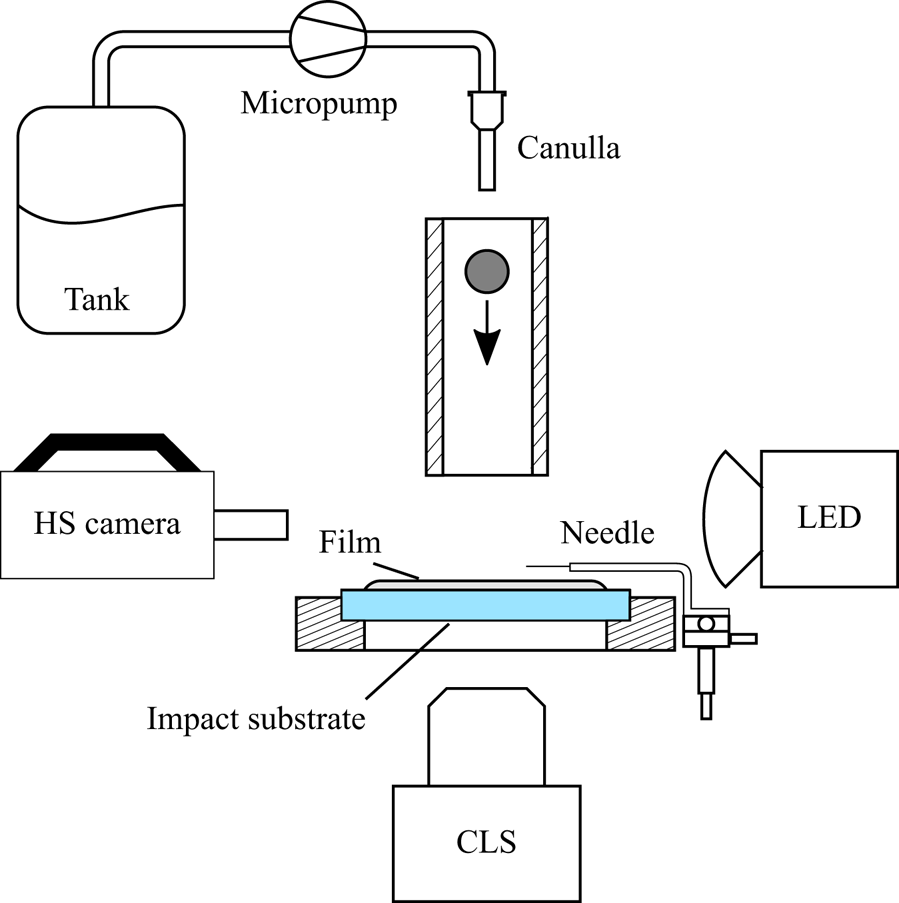
Figure 1. Schematic representation of the experimental set-up.
The impact substrate is a round, horizontally aligned glass plate with a diameter of 50 mm and a thickness of 0.5 mm. The plate is made of sapphire glass, which is optically polished to minimize the effect of surface roughness. The film thickness is measured using a chromatic-confocal line (CL) sensor (Precitec CHRocodile CLS). This system allows the film thickness to be measured at 192 points on a line of 4.5 mm length. In order to lay a film of a defined thickness, the film fluid is applied at the centre of the sapphire glass plate where it spreads. The film thickness is then varied from  $28\ \mathrm {\mu }\text {m}$ to
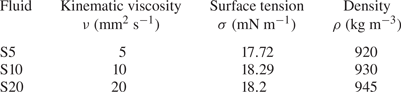
  $170\ \mathrm {\mu }\text {m}$ by utilizing a spin coating process in which the film thickness is constantly monitored by the CL sensor. The fluids used are silicone oils with varying kinematic viscosity, as shown in table 1.
Table 1. Fluid properties. Here Sxx stands for silicone oils of different viscosity. The vendor of silicone oils is Merck KGaA under the trademark Sigma-Aldrich.
The observation system consists of a high-speed video camera and an illumination source. The frame rate of the high-speed video camera (Photron Fastcam SA-X2) is set to 50 000 fps with a resulting resolution of  $768\times 328$ pixel and a shutter speed of
  $18.4\ \mathrm {\mu }{\rm s}$. The pixel resolution is in the range of
  $19\ \mathrm {\mu }{\rm m}$ to
  $31\ \mathrm {\mu }{\rm m}$ per pixel, depending on the investigated case. The high frame rate allows precise determination of the instant of detachment. A light-emitting diode (Veritas Constellation 120E, 12 000 lumen) is used as an illumination source. A diffusing screen is placed in front of the illumination source to provide uniform back lighting.
Two sets of experiments were conducted, the first set to observe conditions under which corona detachment occurred and to determine the instant of detachment. This set was followed by a second set in which the identical conditions for corona detachment were repeated, but a needle was used to artificially rupture the corona at an instant just prior to that at which detachment would normally occur. This allowed the corona wall thickness at this instant to be determined, as explained below. For this, the needle could be precisely positioned by a three-axes system so that it punctured the corona while it grows beyond the position of the needle.
3. Experimental characterization of the rupture process
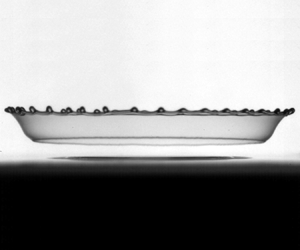
Typical outcomes of drop impact onto a liquid film are shown in figure 2 for four cases in which the drop and wall film are the same fluid but with varying film thickness and/or fluid viscosity. In all cases a corona evolves after impact and in all cases the corona detaches from the wall film, eventually retracting to the upper Taylor rim and disintegrating into ligaments and/or droplets. The instant shortly after detachment is marked in this figure with a red box. In the present study attention is focused on the reason for this observed corona detachment.
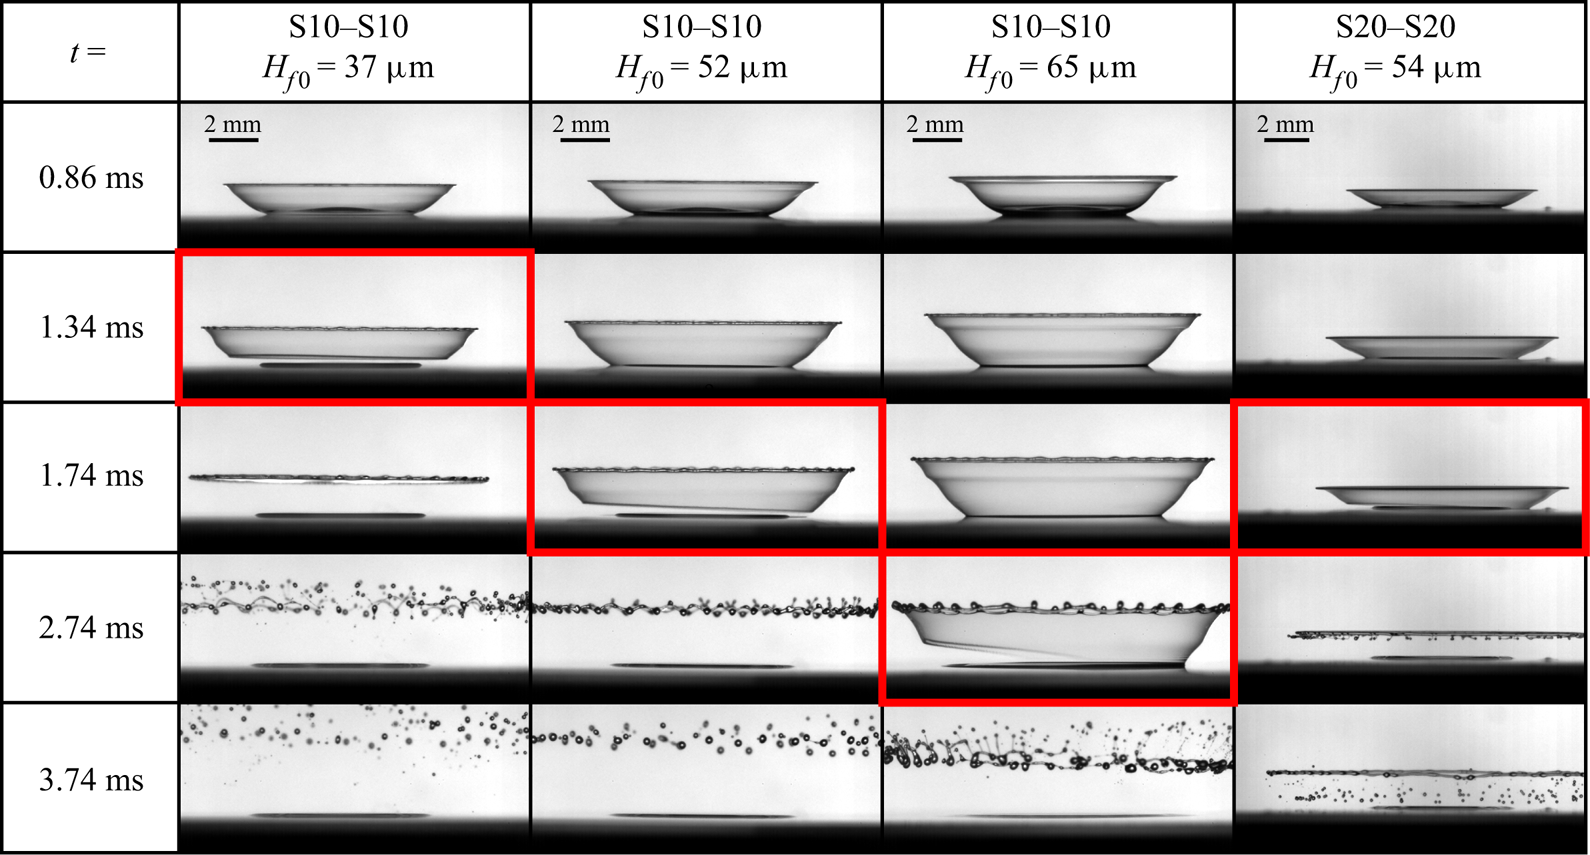
Figure 2. Evolution of corona formation, detachment and atomization for cases of varying  $H_{{f0}}$ and viscosity. The instant shortly after detachment is marked in each case with a red box. Impact parameters are:
  $D_0=2\ \mathrm {mm}$,
  $U_0=3.2\ \mathrm {m}\ \mathrm {s}^{-1}$ and
  $\tilde {\kappa }_\nu =1$.
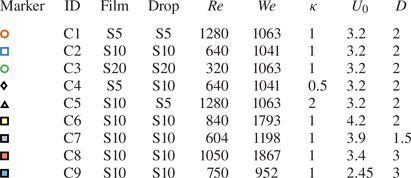
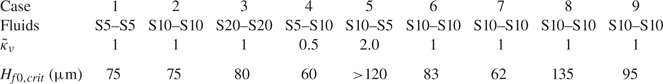
While figure 2 presents only exemplary observations, experiments have been carried out over a large range of wall film thicknesses, wall/film fluid combinations and impact parameters. Nine cases, systematically varying the viscosity, fluid combination, drop diameter and impact velocity are defined, and for each case, experiments are carried out for a large range of wall film thicknesses. The fluid combinations and impact parameters for the individual cases can be found in table 2. These values of film thickness and impact velocity cover the regimes in which corona detachment could be observed. Note that in all cases the drop and film liquids are miscible.
Table 2. Liquid combinations and impact parameters of the investigated experimental cases. The cases and the symbols from this table correspond to those shown in figure 3. Here Sxx denotes the respective liquid. The liquid properties can be found in table 1. The Reynolds and Weber numbers have been computed using the drop diameter and impact velocity and the liquid properties of the drop.
At the high frame rate of the camera the first instant of detachment can be determined very accurately and, furthermore, the critical wall thickness can be determined, beyond which corona detachment can no longer be observed ( $H_{f0,crit}$). The time of detachment is defined as the time interval between first contact of the drop with the liquid film and the instant when a first rupture in the corona is visible. The results of these experiments are summarized in figure 3 and table 3. In figure 3 the time of detachment
  $t_d$ is shown as a function of the initial wall film thickness
  $H_{f0}$ for different combinations of the drop and film liquid viscosities. These results are not made dimensionless yet, and compared with the theoretical results derived in § 4.4.
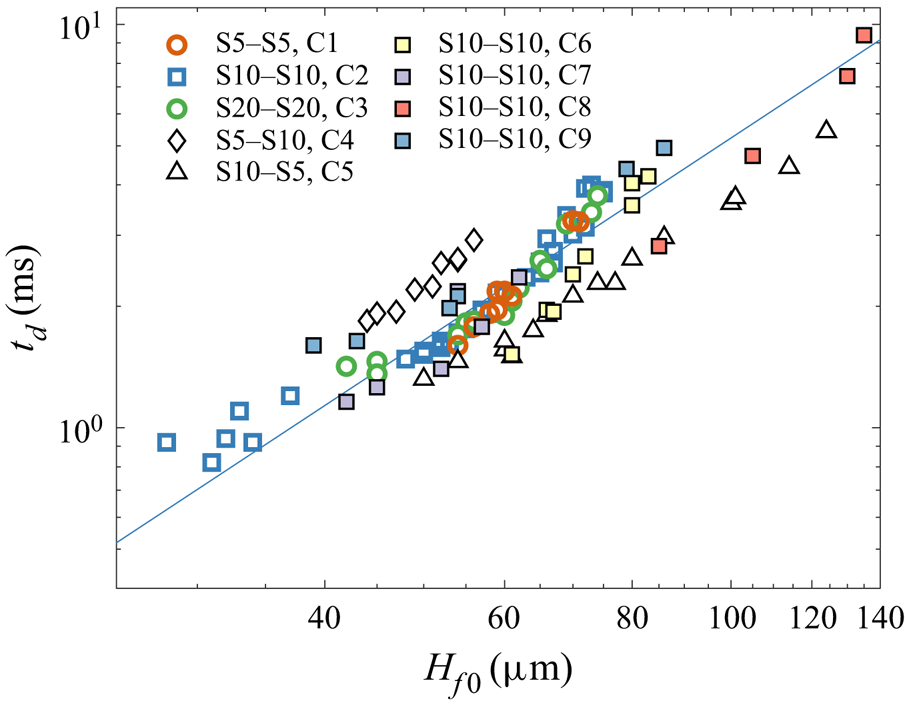
Figure 3. Instant of corona detachment  $t_d$ at different initial wall film thicknesses
  $H_{f0}$, different fluid combinations and impact parameters. The fluid combinations and impact parameters for the individual cases are listed in table 2. The solid line represents the slope predicted by (4.45) using a value of
  $k=73.43$ obtained by a least squares fitting to the data arising from like fluids S5, S10 and S20 and plotted for the S10–S10 case.
Table 3. Maximum wall film thickness  $H_{{f0,crit}}$ for which detachment can be observed for different fluid combinations. The impact parameters for the corresponding cases can be found in table 2. Here Sxx–Syy specifies film fluid–drop fluid;
  $\tilde {\kappa }_\nu = \nu _f/\nu _d$.
It is interesting to note that in the cases with the same liquid in the drop and wall film, the viscosity does not have a significant influence on  $t_d$, since the results for S5–S5, S10–S10 as well as S20–S20 overlap closely. From this figure it is also apparent that, for the different fluid combinations, corona detachment can only be observed for some maximum wall film thickness, beyond which no data points are shown. This limiting wall film thickness,
  $H_{f0,crit}$, is summarized in table 3 for the investigated fluid combinations. While the critical dimensional wall film thickness for corona detachment remains constant for case 1 and case 2, which represent single component drop impact with the fluids S5 and S10, the critical value of
  $H_{f0}$ is higher for case 3 where S20 fluid is used. This can be explained by the fact that in case 1 (S5) and case 2 (S10) the corona detachment is superimposed on a crown splash and at the instant when the corona in case 3 (S20) detaches, the corona in case 1 and case 2 has already collapsed due to the rim instability and can, therefore, no longer detach. Analogously, it can be observed that for cases with larger drop diameter or velocity (cases 5–9), the total collapse of the corona due to crown splash and the associated rim instability will occur at later times and, therefore, later times of detachment, i.e. higher critical values of
  $H_{f0}$ are possible.
Finally, the data in figure 3 reveals a rather strong influence of the viscosity ratio  $\tilde {\kappa }_\nu$, exhibiting longer dimensionless detachment times for lower values of
  $\tilde {\kappa }_\nu$ and shorter detachment times for higher values of
  $\tilde {\kappa }_\nu$.
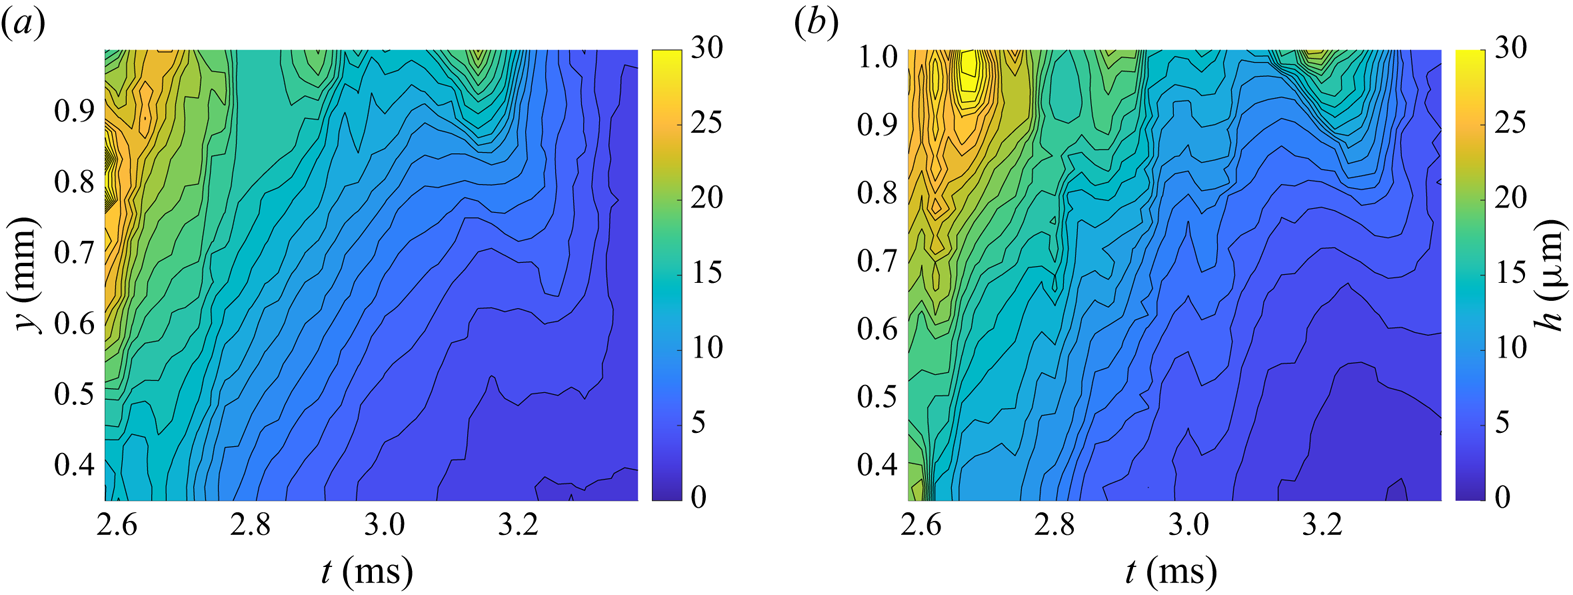
To determine the thickness of the corona liquid sheet at the instant of corona detachment, the artificial rupture with the needle was used. This technique is visualized in figure 4. In this figure the needle is held horizontal to the surface and pierces the liquid corona sheet on the far side as it expands. The needle can be positioned such that the puncturing takes place just prior to an expected corona detachment. This initiates a hole, which then propagates throughout the sheet. By tracking the Taylor rim contour in time, shown in figure 5 with coloured lines, the velocity of the rim can be computed as a function of height above the surface and time. Each contour line comes from a frame subsequent to the frame shown in the image. The axisymmetric centre of the corona is indicated with a blue line. This velocity can then be used to compute the film thickness, thus providing film thickness information for the corona sheet just prior to corona detachment.
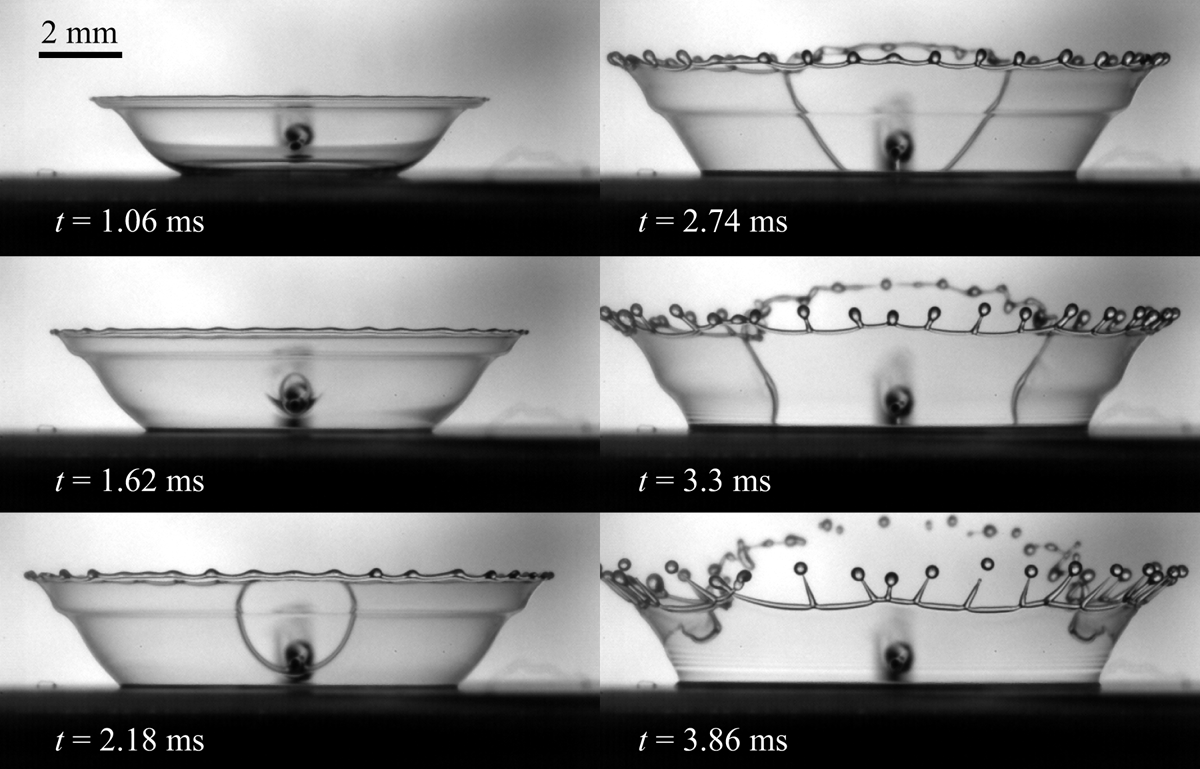
Figure 4. Puncturing of the corona sheet using a needle and propagation of the resulting hole throughout the sheet. The  $\Delta t$ between the images is 0.56 ms. Drop impact parameters are: liquid S10–S10,
  $U_0= 3.2\ {\rm m}\ {\rm s}^{-1}$,
  $D_0=2\ {\rm mm}$,
 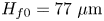 $H_{f0}= 77\ \mathrm {\mu } {\rm m}$.
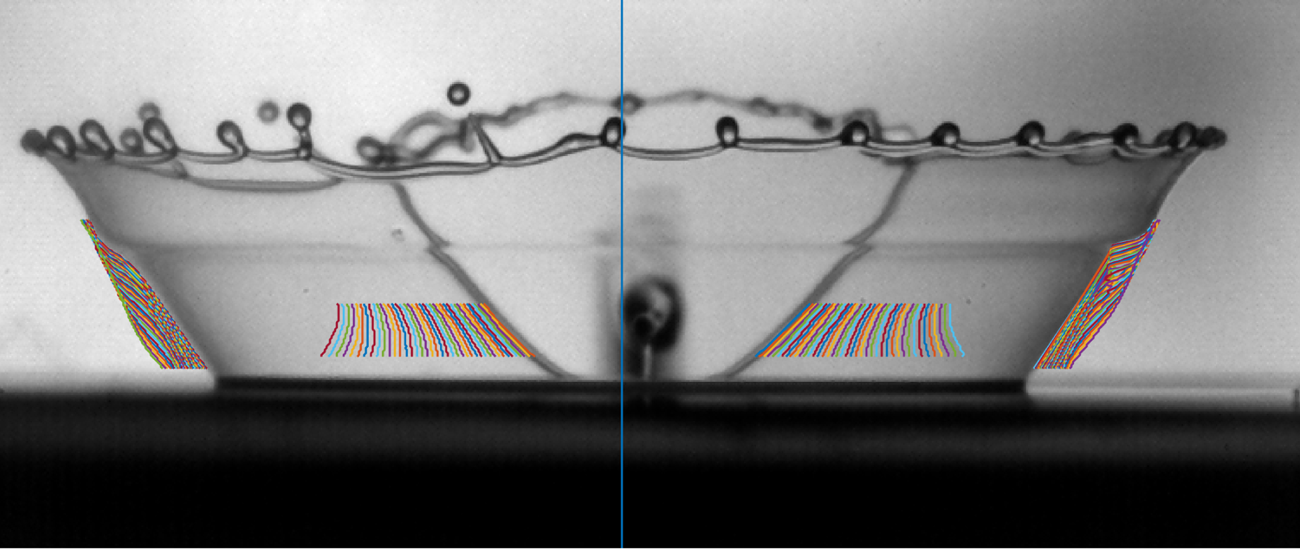
Figure 5. Drop impact at  $t=2.6\ \text {ms}$. Blue line denotes corona centreline/axis. The rim contour at different subsequent time instants is shown with different colours on the left and right side of the centreline. Impact parameters:
  $D_0=2\ \mathrm {mm}$,
  $U_0=3.2\ \text {m} \text {s}^{-1}$,
  $H_{{f0}}=80\ \mathrm {\mu } \text {m}$.
The thickness in the rupturing corona film can now be estimated with the help of the Taylor–Culick mechanism (Taylor Reference Taylor1959; Culick Reference Culick1960) describing the relation between surface tension  $\sigma$, density
  $\rho$, rim velocity
  $u_{TC}^{\vphantom{2}}$ and corona wall thickness
  $h$ in a tearing corona as
 \begin{equation} h=\frac{2\sigma}{u_{TC}^2\rho}. \end{equation}
 However, the rim does not move on a planar liquid sheet, but along the conical contour of the corona. Thus, the horizontal displacement of the rim obtained from the high-speed video images must first be projected onto a path laying on the corona contour. Assuming that the corona is rotationally symmetric, the angle through which the rim propagates between two consecutive frames at times  $t_1$ and
  $t_2$ is given by
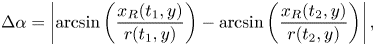 \begin{equation} \Delta \alpha = \left| \arcsin \left( \frac{x_R(t_1,y)}{r(t_1,y)} \right) -\arcsin \left({\frac{x_R(t_2,y)}{r(t_2,y)}}\right) \right|, \end{equation}
where  $x_R$ is the horizontal distance measured from the corona centre axis to the rupture rim and
  $r$ is the radial distance from the centre axis to the corona sheet (as shown in figure 6). Both quantities are functions of time and height above the corona base,
  $y$. These two quantities can be obtained directly from the high-speed images, as indicated in figure 5, where the outline of the rim and the corona border in subsequent time steps is plotted as coloured lines.
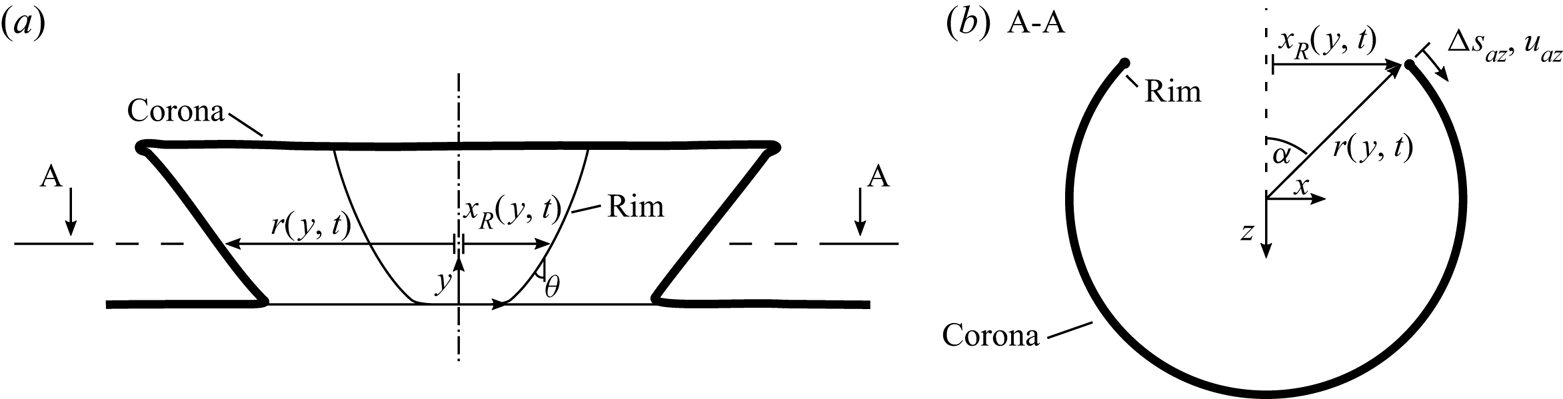
Figure 6. Sketch of a corona with an artificially inflicted rupture. (a) Depicts a side view and (b) a top view, showing the time and location-dependent corona radius  $r$, projected
  $x$-position
  $x_R$, the propagation angle of the corona
  $\alpha$, the azimuthal displacement
  $\Delta s_{az}$ and velocity
  $u_{az}$ as well as the local rim angle
  $\theta$.
To compute the velocity of the rim in the azimuthal direction,  $u_{az}$, the time average of the corona radius over two subsequent frames is formed, i.e.
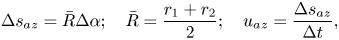 \begin{equation} \Delta s_{az} = \bar{R} \Delta \alpha; \quad \bar{R}=\frac{r_1+r_2}{2}; \quad u_{az} =\frac{\Delta s_{az}}{\Delta t}, \end{equation}
where  $r_1$ and
  $r_2$ are the corona radii at the times
  $t_1$ and
  $t_2$ and
  $\Delta t = t_2 - t_1$.
The velocity  $u_{TC}^{\vphantom{2}}$ appearing in (3.1) is the velocity normal to the rim, which would require following material points in the sequence of images available from the high-speed camera. Since this is impossible, the velocity
  $u_{TC}^{\vphantom{2}}$ was estimated by using the measured horizontal velocity of the rim,
  $u_{az}$, and the local inclination angle of the rim to the vertical,
  $\theta$, in the form
 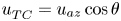 $u_{TC}^{\vphantom{2}}=u_{az}\cos {\theta }$. This approach also assumes that the advection of the corona wall liquid is zero, which for the horizontal velocity component of the rim is thought to be a good assumption.
Applying this procedure to selected cases from table 2 results in quantitative data for velocity and rim thickness at all heights of the corona as a function of time and for both the right- and left-hand sides of the corona. An example of one such measurement is shown in figures 7 and 8 for the velocity and rim thickness, respectively. Comparing results for the right- and left-hand sides of the hole propagation reveals a high degree of symmetry, confirming that the corona wall is equal in thickness around the circumference at a given height and time. Of particular interest however, is the film thickness very close to the impact surface, i.e. at very low  $y$ values, since this is a representative thickness of the rim when the corona begins to detach for cases that are not artificially ruptured. These values will be subsequently used in the theoretical model predicting detachment time to compare with experimentally determined instants of detachment.
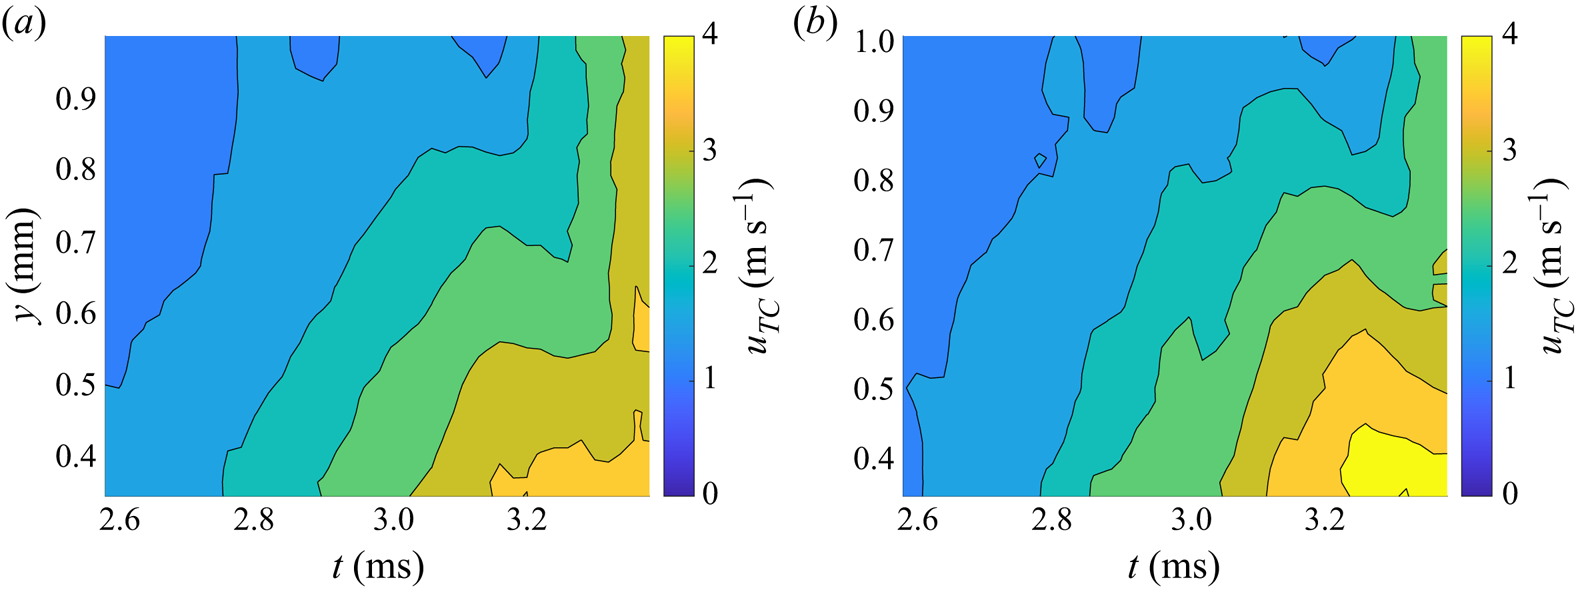
Figure 7. Measured rim velocity to the left and right side of the corona centreline. Impact parameters:  $D_0=2$ mm,
  $U_0=3.2\ \text {m}\ \text {s}^{-1}$,
  $H_{{f0}}=80\ \mathrm {\mu } \text {m}$. The velocities on both sides are shown as positive values for better comparison.


The corona sheet thickness 0.46 mm above the corona base is then plotted in figure 9 for three cases of substrate film thickness,  $H_{f0}=61\ \mathrm {\mu } \text {m}$,
  $70\ \mathrm {\mu } \text {m}$ and
  $80\ \mathrm {\mu } \text {m}$. The observed trends are clear: the corona sheet reduces rapidly in thickness from about
  $18\ \mathrm {\mu }{\rm m}$ to
  $3\unicode{x2013}4\ \mathrm {\mu }{\rm m}$, or until detachment occurs. For reference, in the case of
  $H_{f0}=61\ \mathrm {\mu } \text {m}$ the corona detachment occurs at 2.66 ms for
 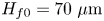 $H_{f0}=70\ \mathrm {\mu } \text {m}$ at 3.5 ms and, for
  $H_{f0}=80\ \mathrm {\mu } \text {m}$, no corona detachment is observed. It is apparent therefore that the thickness of the corona liquid sheet at the instance of detachment is influenced by the thickness of the liquid film on the substrate. If this thickness is too large, no detachment of the corona occurs.
Figure 9. Comparison of temporal development of corona sheet thickness from experiments and theory. Experimental data shows the film thickness 0.46 mm above the corona base. The fluid for film and drop is S10 for all experiments. Here  $H_{f0}$ is varied from 60 to
  $80\ \mathrm {\mu }{\rm m}$ and is colour coded (red:
  $H_{f0}=61\ \mathrm {\mu } \text {m}$; black
  $H_{f0}=70\ \mathrm {\mu } \text {m}$; blue
  $H_{f0}=80\ \mathrm {\mu } \text {m}$). The symbols (o and
  $\ast$) denote the left and right rim, respectively. The solid lines show the evolution of corona sheet thickness predicted by (4.28), whereby
  $B$ is chosen to be 16. The
  $B$ parameter corresponds to
  $1/\tilde {\tau }$ in (1.1a–c). To evaluate this value, numerous cases of expanding corona have been analysed and the value
  $B=16$ proves to yield excellent agreement with experiments. The temporal offset
  $t_0$ is
  $\{2.31, 2.37, 2.51\}$ ms for
  $\{61, 70, 80\}\ \mathrm {\mu } \text {m}$. The magenta coloured diamonds mark the film thicknesses and instances that were used to calculate the offset times
  $t_0$. Since the film heights determined from the right- and left-hand sides of the rim coincide well, the mean value of
  $h$ from both sides at the first measured instance of each experiment has been chosen for reference.
In figure 9 the predicted film thickness evolution according to (4.28) and using a value of  $B$ of 16 is also shown for the three substrate film thicknesses, as will be explained below.
The Taylor–Culick mechanism has been used before to estimate the thickness of film sheets in the context of drop impact. Thoroddsen et al. (Reference Thoroddsen, Thoraval, Takehara and Ethoh2011) used the mechanism to estimate the thickness of the ejecta forming immediately after impact to be approximately 300 nm. Both Thoroddsen, Etoh & Takehara (Reference Thoroddsen, Etoh and Takehara2006) and Aljedaani et al. (Reference Aljedaani, Wand, Jetly and Thoroddsen2018) used this approach to estimate the thickness from the propagation velocity of Marangoni holes in a corona and found sheet thicknesses of  $29\pm 9\ \mathrm {\mu }{\rm m}$ and
  $23\ \mathrm {\mu }{\rm m}$, respectively.
4. Mechanism of the film disintegration by hole nucleation and expansion
4.1. Spontaneously growing holes in liquid films
Examination of images of disintegrating liquid films reveals that multiple holes often appear prior to breakup (cf. Brenn et al. Reference Brenn, Prebeg, Rensink and Yarin2005). These holes proliferate into the intact film because of the surrounding circular free rims and are driven by surface tension according to the Taylor–Culick mechanism (Taylor Reference Taylor1959; Culick Reference Culick1960; Yarin et al. Reference Yarin, Roisman and Tropea2017). These expanding holes then merge, leaving a network of ligaments, which breakup due to capillary instability. This is the scenario further explored analytically in the present work in relation to the mechanism of corona detachment.
Free liquid films, being a two-dimensional continuum, are not inherently prone to breakup into droplets, because in contrast to one-dimensional continua (jets), their surface energy would increase through breakup. Therefore, holes appear only as a result of a nucleation, which is, for example, a perturbation resulting from disturbances in the corona wall film. Note also that perturbations can be introduced in free liquid films by an atomizer exit, or turbulent pulsations in the surrounding air, which also result in hole nucleation, as observed in Wakimoto & Azuma (Reference Wakimoto and Azuma2009) at high Reynolds numbers.
Consider a circular disk-like hole in a film of thickness  $h$. The hole in the film is surrounded by a free rim of cross-sectional radius
  $a$, which accommodates the liquid volume removed from the hole, i.e.
  ${\rm \pi} (r+a)^2h$, where
  $r$ is the radius of the rim centreline. The situation is sketched in figure 10. The rim volume is
  $2{\rm \pi} ^2ra^2$, and, thus, volume conservation yields
 \begin{equation} a=\frac{r h^{1/2}}{\sqrt{2{\rm \pi} r}-h^{1/2}}. \end{equation}
Note that in recent work of Bang et al. (Reference Bang, Ahn, Yoon and Yarin2023), where similar arguments related to hole formation on swirling liquid films issued from pressure-swirl atomizers were considered,  $a$ was neglected compared to
  $r$, which leads to an equation for the cross-sectional radius
  $a$ without the term
  $h^{1/2}$ in the denominator instead of (4.1), and the related changes in the equations of Bang et al. (Reference Bang, Ahn, Yoon and Yarin2023) corresponding to (4.2)–(4.6) here. It should be emphasized that the present refined version of (4.1)–(4.6) is preferable.
Figure 10. Sketch of (a) a liquid sheet of thickness  $h$ and (b) the liquid sheet with a circular hole of radius
  $r$ surrounded by a toroidal rim of cross-sectional radius
  $a$.
$a$.
The surface energy increase attributed to the surface energy of the free rim,  $\Delta \varPhi _{rim}=4\sigma {\rm \pi}^2 r a$, is expressed accounting for (4.1) as
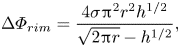 \begin{equation} \Delta\varPhi_{rim}=\frac{4\sigma {\rm \pi}^2 r^2 h^{1/2}}{\sqrt{2{\rm \pi} r}-h^{1/2}}, \end{equation}
where  $\sigma$ is the surface tension.
The surface energy decrease due to the hole formation is
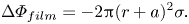 \begin{equation} \Delta\varPhi_{film}={-}2{\rm \pi} (r+a)^2 \sigma. \end{equation}
Here the factor 2 accounts for the two surfaces of the film.
Equations (4.2) and (4.3) show with the help of (4.1) that the total energy change related to the formation of a hole is
 \begin{equation} \Delta\varPhi
(r)=\Delta\varPhi_{film}+\Delta\varPhi_{rim}={-}\frac{4
{\rm \pi} ^2 r^2 (h-\sqrt{2 {\rm \pi}r h } +r) \sigma
}{(\sqrt{2 {\rm \pi}r }-\sqrt{h})^2}.
\end{equation}
\begin{equation} \Delta\varPhi
(r)=\Delta\varPhi_{film}+\Delta\varPhi_{rim}={-}\frac{4
{\rm \pi} ^2 r^2 (h-\sqrt{2 {\rm \pi}r h } +r) \sigma
}{(\sqrt{2 {\rm \pi}r }-\sqrt{h})^2}.
\end{equation}
The function  $\Delta \varPhi (r)$ has a maximum corresponding to the condition
  ${\rm d}\Delta \varPhi (r)/{\rm d}r=0$, which yields the critical hole nucleus size
 \begin{equation} r_*\approx 2.18 h. \end{equation}
If the radius of a hole ‘nucleus’  $r$ is smaller than
  $r_*$, its growth would correspond to an increase in the total energy, given by (4.4), i.e. it is energetically unfavourable and, thus, cannot be spontaneous. On the other hand, if a hole ‘nucleus’ is larger than the critical one, i.e.
  $r>r_*$, its growth would correspond to a decrease in the total energy
  $\Delta \varPhi (r)$ given by (4.4), i.e. it would be energetically favourable and, thus, spontaneous. The critical total energy corresponding to the critical hole ‘nucleus’ is found as
  $\Delta \varPhi _{*}=\Delta \varPhi (r_*)$, and according to (4.4) and (4.5), is equal to
 \begin{equation} \Delta\varPhi_* \approx 13.4 \sigma h^2. \end{equation}
This expresses the activation energy required to be exceeded to form a spontaneously growing hole. The next step is then to formulate the probability that a hole of this size will occur, given random disturbances in a liquid sheet. This is the subject of the next subsection.
Taylor & Michael (Reference Taylor and Michael1973) also developed an approach to determine the critical size of a hole that would grow. They propose a catenoidal shape, which guarantees zero capillary pressure in the liquid on the hole that remains in equilibrium with the surrounding vacuum. There are two possible catenoidal hole shapes of different sizes, with the smaller one (in radius) being stable, and thus, non-growing, and the larger one being unstable, and thus, growing. This approach uses stability arguments based on the surface energy of catenoidal holes and yields  $r_*\sim h$ (cf. (4.5)). However, this approach neglects the formation of a free rim, which could be realized in the Taylor & Michael (Reference Taylor and Michael1973) apparatus with suspended soap films, but is inapplicable to hole formation in dynamic free liquid films originating from drop impacts onto pre-existing liquid films (or many other films, e.g. those originating from swirl atomizers, as in Bang et al. Reference Bang, Ahn, Yoon and Yarin2023). Furthermore, the requirement of zero capillary pressure in liquid in equilibrium with the surrounding vacuum is arbitrary. The present approach accounts for realistic configurations of holes with free rims, and moreover, does not insist that their growth inevitably begins from an arbitrary chosen equilibrium catenoidal shape.
4.2. Turbulent eddies in liquid films
The intermittency and instability mechanisms at the base of the frontal ejecta arising underneath drops impacting onto liquid films are also driven by inertial effects (Thoraval et al. Reference Thoraval, Takehara, Etoh, Popinet, Ray, Josserand, Zaleski and Thoroddsen2012; Li et al. Reference Li, Thoraval, Marston and Thoroddsen2018), which can represent the first steps in the cascade of instabilities leading to the formation of turbulent eddies.
Consider a liquid film with turbulent eddies inside it, as suggested by the experiments of Wakimoto & Azuma (Reference Wakimoto and Azuma2009). Even though the global Reynolds numbers Re listed in table 2 are of the order of 100–1000, local generation of turbulence near the drop bottom following the impact is not precluded at all. Indeed, the global Reynolds number  $Re=U_0 D_0/\nu$ based on the drop impact velocity
  $U_0$ does not characterize at all the situation at the drop bottom at the moment following its impact, when disturbances set in, could grow and be swept into the forming lamella and corona in the form of turbulent eddies. Indeed, the relevant velocity for the bottom part of the drop is that of the intersection between the drop and surface film
  $U_i$, rather than
  $U_0$. The former is related to the latter through
  $U_i=U_0 \cot \gamma$, where
  $\gamma$ is the slope of the drop generatrix relative to the underlying horizontal surface (in particular, at the impact moment (
 $\gamma =0$); Lesser & Field (Reference Lesser and Field1983)). Moreover, if the condition
  $\sqrt {\nu /(D_0 C_l)} \ll 1$ holds (with
  $C_l$ being the speed of sound in liquid), the entire droplet body is already involved in the radial spreading after the impact. This condition holds for investigated drops with
  $D_0 \approx 10^{-1}$ cm,
  $\nu = 10^{-2}\ {\rm cm}^2\ {\rm s}^{-1}$ and
  $C_l \approx 1.5\ {\rm km}\ {\rm s}^{-1}$, whereby
  $\sqrt {\nu /(D_0 C_l)} \sim 10^{-3}$. That means that the characteristic scale of motion is
  $D_0$ and the characteristic Reynolds number is
  ${Re}_i=(U_0 D_0/\nu )\cot \gamma$. Because at the moments following drop impact
  $\cot \gamma \rightarrow \infty$, the Reynolds number
  ${Re}_i \rightarrow \infty$. Thus, turbulence generation near the drop bottom following the impact is real, and the growing disturbances are inevitably entrained as turbulent eddies into the spreading liquid lamella and corona arising from it.
In the inertial range, down to the dissipation range, the distribution of pulsation energy by wavenumber  $\kappa$,
  $E(\kappa )$ is given by the Kolmogorov spectrum (Kolmogorov Reference Kolmogorov1962; Pope Reference Pope2000)
 \begin{equation} E(\kappa)=C \varepsilon^{2/3} \kappa^{{-}5/3}, \end{equation}
where  $\varepsilon$ is the specific dissipation rate and
  $C$ is the universal Kolmogorov spectrum constant
  $C=1.5$ according to George, Beuther & Arndt (Reference George, Beuther and Arndt1984), which is related to the experimentally determined spectral constant
  $C_K$ as
  $C=(55/18)C_K$ (Sreenivasan Reference Sreenivasan1995).
The specific pulsation energy  $k_T$ of all the turbulent eddies in the film is found as
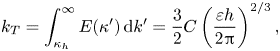 \begin{equation} k_T=\int_{\kappa_h}^{\infty}E(\kappa')\,{\rm d}k'=\frac{3}{2}C\left(\frac{\varepsilon h}{2{\rm \pi}}\right)^{2/3}, \end{equation}
where  $\kappa _h=2{\rm \pi} /h$ and
  $\kappa '$ is the dummy variable.
The Kolmogorov length scale is 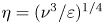 $\eta =(\nu ^3/\varepsilon )^{1/4}$, with
  $\nu$ being the kinematic viscosity. Assuming the overlap of the inertial and dissipation ranges, take
  $\eta \approx h$. Then, the dissipation rate is estimated as
 \begin{equation} \varepsilon \approx \frac{\nu^3}{h^4}. \end{equation}
Using (4.8) and (4.9), one finds the kinetic energy of turbulence per unit volume,  $E_T=\rho k_T$, as
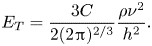 \begin{equation} E_T=\frac{3C}{2(2{\rm \pi})^{2/3}} \frac{\rho \nu^2}{h^2}. \end{equation}
The latter shows that the specific pulsation energy increases in smaller eddies (thinner films), as in the Kolmogorov theory.
Consider the film as a system of turbulent eddies and introduce its temperature in the energy units  $T_e$ as
 \begin{equation} T_e=E_T. \end{equation}
For the system of turbulent eddies, one can essentially repeat the entire thermodynamic derivation starting from the microcanonical  $\delta$-functional distribution to the introduction of the entropy
  $S$ as in Landau & Lifshitz (Reference Landau and Lifshitz2013),
 \begin{equation} \frac{{\rm d}S}{{\rm d}E}=\frac{1}{T_e}, \end{equation}
where  $E$ is understood here as the energy of velocity fluctuations. Then, the probability of a critical hole is given by the Gibbs distribution (Landau & Lifshitz Reference Landau and Lifshitz2013)
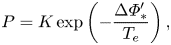 \begin{equation} P=K\exp\left(-\frac{\Delta\varPhi_*'}{T_e}\right), \end{equation}
which is also called the Boltzmann distribution;  $K$ is a dimensionless constant.
In (4.13), 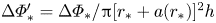 $\Delta \varPhi _*'=\Delta \varPhi_*/{\rm \pi} [ r_* + a(r_*)]^2 h$ is the hole energy per unit volume. According to (4.5) and (4.6),
  $\Delta \varPhi _*'\approx 0.48 \sigma /h$. Then, (4.10), (4.11) and (4.13) yield
 \begin{equation} P \approx K\exp\left[- \frac{1.09}{C}\frac{\sigma h}{\rho \nu^2}\right]. \end{equation}
At  $h=0$, the probability of a system with a critical hole is 1, which yields
  $K=1$ and, thus,
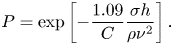 \begin{equation} P=\exp\left[- \frac{1.09}{C}\frac{\sigma h}{\rho \nu^2}\right]. \end{equation}
Equation (4.15) shows that the thinner the film is, the higher is the probability of a critical hole forming. Taking for an estimate the parameters of water,  $\rho = 1 \ \text {g}\ \text {cm}^{-3}$,
  $\sigma =72 \ \text {g}\ \text {s}^{-2}$,
  $\nu =10^{-2} \ \text {cm}^2 \text {s}^{-1}$, and the above-mentioned value of the empirical constant
  $C=1.5$, one obtains
  $P=0.59$ for
  $h=10$ nm. The estimation for the silicon oil S10 yields
  $P=0.49$ (
 $\rho =0.93\ \text {g}\ \text {cm}^{-3}$) for
  $h=5\ \mathrm {\mu }{\rm m}$.
4.3. Evolution of film thickness in time
The probability of critical hole formation (4.15) depends on time because the corona wall thickness  $h$ depends on time. Consider the simplest case where the pre-existing film on the wall and the impacting drop are of the same liquid. In this case the experiments show that corona detachment is possible. Then, the theory of Yarin & Weiss (Reference Yarin and Weiss1995) is applicable and the dimensionless radial velocity in the film on the wall at the spreading corona,
  $\tilde {U}_c$, is given by
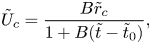 \begin{equation} \tilde{U}_c=\frac{B \tilde{r}_c}{1+B(\tilde{t}-\tilde{t}_0)}, \end{equation}
where  $B$ is dimensionless and determined by the radial velocity gradient in the film on the wall resulting from the drop impact near the impact centre. Note that here and hereinafter time is rendered dimensionless using
  $D_0/U_0$, velocity using
  $U_0$ and lengths using
  $D_0$. Dimensionless times, lengths and velocities are signified here with a tilde. The time shift
  $\tilde {t}_0$ is required because, as discussed in Yarin & Weiss (Reference Yarin and Weiss1995), this theory describes only a remote-asymptotics and cannot be extended to the drop impact time
  $\tilde {t}=0$; cf.
  $\tilde {\tau }$ in (1.1a–c). The shift is equivalent to the ’polar distance’ introduced when the theory of self-similar submerged jets, valid as remote asymptotics, is compared to the experimental data acquired using jets issued from a finite nozzle (cf. Abramovich Reference Abramovich1963).
In addition,
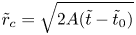 \begin{equation} \tilde{r}_c=\sqrt{2A(\tilde{t}-\tilde{t}_0)} \end{equation}
is the current dimensionless radial position of the corona, with  $A$ being the dimensionless integral characteristic of the radial velocity distribution in the film on the wall resulting from the drop impact.
Note that neither parameter  $A$ nor parameter
  $B$ in (4.16) and (4.17) are the adjustable constants in the theory of Yarin & Weiss (Reference Yarin and Weiss1995). They are the characteristics of an earlier velocity distribution in the lamella following drop impact, which are ‘inherited’ by the remote-asymptotics theory of Yarin & Weiss (Reference Yarin and Weiss1995) or (4.16) and (4.17), as certain traits are inherited by a living organism from an ancestor many generations before. If one would use a detailed numerical model of drop evolution after impact up to the remote asymptotics stage when a corona is formed, the parameters
  $A$ and
  $B$ could be fully predicted, and that had, essentially, been done in the numerical simulations of Weiss & Yarin (Reference Weiss and Yarin1999). The same is true regarding the time shift
  $\tilde{t}_0$, which is similar to the polar distance widely used in the theory of self-similar jets, which is nothing but a remote-asymptotics theory of non-self-similar jets (Abramovich Reference Abramovich1963). It can be predicted using the numerically simulated evolution of a non-self-similar jet toward the remote-asymptotics self-similar regime, as in Dzhaugashtin & Yarin (Reference Dzhaugashtin and Yarin1977). The Yarin & Weiss (Reference Yarin and Weiss1995) theory leading to (4.16) and (4.17) is an inviscid one and, in general, an effect of the Reynolds number could modify these equations. It should be emphasized however that, for the lamella flow evolution relevant here, under the condition
  $\sqrt {\nu /(D_0 C_l)} \ll 1$, which holds in all the experimentally explored cases here, the relevant Reynolds number is
  ${Re}_i = (U_0 D_0/\nu ) \cot \gamma$, where
  $\cot \gamma \rightarrow \infty$ and, thus,
  ${Re}_i \rightarrow \infty$. The latter shows that in such cases the effect of viscosity in the lamella flow is expected to be negligibly small, as (4.16) and (4.17) imply.
Accordingly,
 \begin{equation} \tilde{U}_c=B\sqrt{2 A}\frac{\sqrt{\tilde{t}-\tilde{t}_0}}{1+B(\tilde{t}-\tilde{t}_0)}. \end{equation}
Assuming negligible viscous losses when the liquid is propelled from the film to the corona, one can find the dimensionless corona height  $\tilde {L}$ integrating the equation
 \begin{equation} \frac{{\rm d}\tilde{L}}{{\rm d}\tilde{t}}=\tilde{U}_c, \end{equation}
which together with (4.18) yields
 \begin{equation} \tilde{L}=2\sqrt{2A}\left[ \sqrt{\tilde{t}-\tilde{t}_0}-\frac{1}{\sqrt{B}}\text{arctan} \sqrt{B(\tilde{t}-\tilde{t}_0)}\right]. \end{equation}
For relatively short times of interest here, (4.20) yields
 \begin{equation} \tilde{L}=\frac{2\sqrt{2A}B}{3}(\tilde{t}-\tilde{t}_0)^{3/2}. \end{equation}
Accordingly, the current volume of the corona is
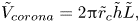 \begin{equation} \tilde{V}_{corona}= 2{\rm \pi} \tilde{r}_c \tilde{h} \tilde{L}, \end{equation}
whereby the volume is rendered dimensionless with  $D_0^3$. On the other hand, this volume was propelled from the film on the wall inside the corona, i.e.
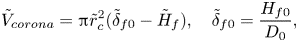 \begin{equation} \tilde{V}_{corona}={\rm \pi} \tilde{r}_c^2(\tilde{\delta}_{f0}-\tilde{H}_f) , \quad \tilde{\delta}_{f0} = \frac{H_{f0}}{D_0}, \end{equation}
where  $\tilde {H}_f$ is the current dimensionless film thickness on the wall inside the corona.
The film thickness rendered dimensionless by  $D_0$ is found as (Yarin & Weiss Reference Yarin and Weiss1995)
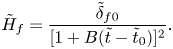 \begin{equation} \tilde{H}_f=\frac{\tilde{\delta}_{{f0}}}{[1+B(\tilde{t}-\tilde{t}_0)]^2}. \end{equation}
Then, using (4.17) and (4.21)–(4.24) one obtains the dimensionless thickness of the corona wall as
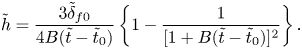 \begin{equation} \tilde{h}=\frac{3 \tilde{\delta}_{{f0}}}{4 B (\tilde{t}-\tilde{t}_0)} \left\{1-\frac{1}{[1+B(\tilde{t}-\tilde{t}_0)]^2}\right\}. \end{equation}
In dimensional form, (4.25) reads
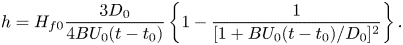 \begin{equation} h=H_{f0}\frac{3D_0}{4B U_0 (t-t_0)}\left\{1-\frac{1}{[1+B U_0(t-t_0)/D_0]^2}\right\}. \end{equation}
As  $(t-t_0) \xrightarrow []{} 0$, (4.26) yields
 \begin{equation} h=\tfrac{3}{2}H_{f0}. \end{equation}
Then, according to (4.26),  $h$ decreases monotonically in time approximately as
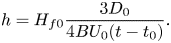 \begin{equation} h=H_{f0}\frac{3D_0}{4B U_0 (t-t_0)}. \end{equation}
According to figure 9, the corona sheet would breakup at
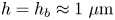 \begin{equation} h=h_b \approx 1\ \mathrm{\mu}\textrm{m} \end{equation}
and a reasonable estimate of the probability of hole formation would be, according to (4.15),
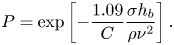 \begin{equation} P=\exp\left[-\frac{1.09}{C}\frac{\sigma h_b}{\rho\nu^2}\right]. \end{equation}
4.4. Hole growth process and the corona detachment time
Toroidal free rims surrounding the supercritical, spontaneously growing holes move outward with the Taylor–Culick velocity (Taylor Reference Taylor1959; Culick Reference Culick1960; Yarin et al. Reference Yarin, Roisman and Tropea2017),
 \begin{equation} u_{TC}^{\vphantom{2}}=\sqrt{\frac{2\sigma}{\rho h}}. \end{equation}
 Consider a specific location in the film and a hole forming around this location. Any hole that appears at a distance  $R$ from the location at time
  $\tau < t - R/u_{TC}^{\vphantom{2}}$ will reach this location before the instant
  $t$. The number of holes
  $\mathrm {d} n$ formed in a ring of radius
  $R$ defined by the radius element
  $\mathrm {d}R$, which reach the considered point at time
  $t$ can be estimated as
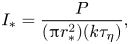
 \begin{equation} \mathrm{d} n=\int_{0}^{t-R/u_{TC}^{\vphantom{2}}} I_* 2 {\rm \pi}R\, \mathrm{d}R \,\mathrm{d}\tau=I_* \left( t-\frac{R}{u_{TC}^{\vphantom{2}}}\right) 2{\rm \pi} R \,\mathrm{d}R, \end{equation}
where  $\tau$ is an integration time and
  $I_*$ is the constant hole formation rate.
Note that if variation of  $I_*$ in time would be accounted for, one would have to evaluate the integral
  $\int _{0}^{t-R/u_{TC}^{\vphantom{2}}}I_* \,{\rm d}\tau$ numerically, which would complicate the following calculations, but, in principle, does not affect the main theoretical structure.
In total, the average number of holes  $N$ that can reach the location under consideration during time
  $t$ is
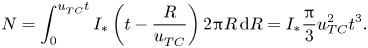 \begin{equation} N=\int_{0}^{u_{TC}^{\vphantom{2}}t}I_*\left( t-\frac{R}{u_{TC}^{\vphantom{2}}}\right) 2{\rm \pi} R \,{\rm d}R=I_* \frac{\rm \pi}{3}{u}_{TC}^2 t^3. \end{equation}
Because the growing hole formation process is random, the probability that the location under consideration will be reached by  $m$ holes during time
  $t$ is given by the Poisson distribution
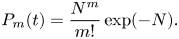 \begin{equation} P_m(t)=\frac{N^m}{m!}\exp({-}N). \end{equation}
Then, the probability that zero holes will reach that location  $(m=0)$, i.e. it will stay intact, is equal to
 \begin{equation} P_0(t)=\exp({-}N). \end{equation}
Accordingly, the relative area occupied by the holes, accounting for their interactions, is
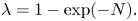 \begin{equation} \lambda=1-\exp({-}N). \end{equation}
Note that the calculation of  $\lambda$ via (4.32)–(4.36) is similar in a sense to the calculation of the degree of crystallization in polymer crystallization processes (Yarin Reference Yarin1992, Reference Yarin1993; Ghosal et al. Reference Ghosal, Chen, Sinha-Ray, Yarin and Pourdeyhimi2019).
The characteristic time scale of Kolmogorov dissipative eddies is 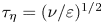 $\tau _\eta =(\nu /\varepsilon )^{1/2}$ (Kolmogorov Reference Kolmogorov1962; Pope Reference Pope2000). Using (4.9), one obtains
 \begin{equation} \tau_\eta=\frac{h^2}{\nu}. \end{equation}
Then, the specific rate of formation of growing holes per surface area is
 \begin{equation} I_*=\frac{P}{({\rm \pi} r_*^2)(k \tau_\eta)}, \end{equation}
where  $k$ is the number of characteristic time scales required for a hole formation. Using (4.5), (4.37) and (4.38), one obtains
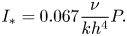 \begin{equation} I_*=0.067\frac{\nu}{k h^4}P. \end{equation}
The value of  $I_*$ found from (4.27), (4.30) and (4.39) reads
 \begin{equation} I_*=0.013 \frac{\nu}{k H_{f0}^4}\exp\left(-\frac{1.09}{C}\frac{\sigma h_b}{\rho \nu^2}\right). \end{equation}
 The expression (4.36) for the relative area of the holes  $\lambda$ with the help of (4.27), (4.31) and (4.33) yields
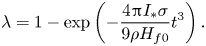 \begin{equation} \lambda=1-\exp\left(-\frac{4 {\rm \pi}I_* \sigma }{9 \rho H_{f0}} t^3 \right). \end{equation}
According to the percolation theory (Stauffer Reference Stauffer1979, Reference Stauffer1985), when the value of
 \begin{equation} \lambda=\tfrac{1}{2} \end{equation}
has been reached, the intact film disappears. Then, (4.41) and (4.42) yield the corona detachment time  $t_{d}$ as
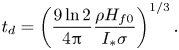 \begin{equation} t_{d}=\left(\frac{9\ln 2}{4{\rm \pi}}\frac{\rho H_{f0}}{I_* \sigma}\right)^{1/3}. \end{equation}
According to (4.40) and (4.43) the dependence of the corona detachment time  $t_{d}$ on the initial film thickness on the wall
  $H_{f0}$ is
 \begin{equation} t_{d}=3.37 \left(\frac{\rho k H_{f0}^5}{\sigma \nu}\right)^{1/3} \exp\left(\frac{0.363}{C}\frac{\sigma h_b}{\rho \nu^2}\right). \end{equation}
Using (4.29), the exponent in (4.44) with  $h_b \approx 1\ \mathrm {\mu }{\rm m}$ and
  $C=1.5$ is approximately 1. Even small variations in estimating
  $h_b$ will not alter the result significantly. Then, (4.44) yields
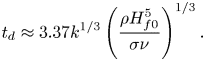 \begin{equation} t_{d} \approx 3.37 k^{1/3}\left(\frac{\rho H_{f0}^5}{\sigma \nu}\right)^{1/3}. \end{equation}
 Equation (4.45) predicts a scaling  $t_d \sim H_{f0}^{5/3}$, which has been added to the log-log representation of the experimental data in figure 3. The exact position of this scaling relation on the diagram was chosen using a least squares fit to all data arising from experiments involving like fluids (drop, film), whereby
  $k$ was used as a fitting parameter. The comparison shown in figure 3 indicates that this scaling describes the experimental results reasonably well for corona detachments with like fluids. The experimental data suggests that the absolute value of detachment time may be inversely proportional to
  $\tilde {\kappa }_{\nu }$, cf. cases 4 and 5 in table 2. Below, at the end of this subsection, the value of
  $k$ is also estimated theoretically.
For predicted characteristic times in fluid mechanics in general, including the one in (4.45) (based on (4.38)) in the present case, the most important aspect is the scaling dependencies on different relevant physical parameters. In this sense, the comparison with the experimental data in figure 3 shows that (4.45) predicts the scaling plausibly. As for the question, ‘how many characteristic times exactly a certain phenomenon takes’, i.e. ‘what would be the exact value of  $k$ in the present case?’, the answer always comes from fitting the prediction to the experimental data (using a least squares approach in figure 3). This is also done in the present work, and thus, the value of
  $k=73.43$ was found for the cases with like fluids S5, S10 and S20 (cf. figure 3). There is nothing unusual with this value of
  $k$. For a general comparison, the Rayleigh theory of capillary breakup of thin inviscid liquid jets predicts that jet breakup takes 39.59 characteristic times
  $\tau =\sqrt {\rho a_0^3 / \sigma }$ (where
  $a_0$ is the unperturbed cross-sectional radius of the jet, and
  $\ln {(a_0/\delta _0)=14}$ according to the fitting of the theory predictions for the jet length to the experimental data, with
  $\delta _0$ being the initial perturbation amplitude, Yarin et al. Reference Yarin, Roisman and Tropea2017).
Some additional remarks regarding the detachment process are necessary, in particular, whether detachment originates and propagates from a single corona wall rupture or whether multiple ruptures are responsible? In most cases the detachment is observed to propagate from a single visible hole in the corona wall, although some examples of multiple holes are observed, as is exemplary illustrated in figure 11. This ambiguity has two origins. On the one hand, the detachment is very sensitive to the surface film thickness. To illustrate this sensitivity, an example of S10 (film)/S10 (drop) is taken with a film thickness of  $H_{f0}=52\ \mathrm {\mu }{\rm m}$ from figure 2. At the instant of detachment the corona has a radius of approximately 6.3 mm. A variation of
  $5\ \mathrm {\mu }{\rm m}$ in film height over the corona diameter would occur already with an inclination of the surface of only
  $0.03^\circ$. According to (4.45), such a film height variation would lead to a difference in the detachment time of
  $283\ \mathrm {\mu }{\rm s}$ between opposite sides of the corona; however, the entire detachment lasts only
  $120\ \mathrm {\mu }{\rm s}$. Thus, the first hole dominates the process even for miniscule variations of film thickness. A second factor is that according to (4.5) the critical radius of a hole nuclei is
  $2.18 \ \mathrm {\mu }{\rm m}$, but the resolution of the camera in the object plane is
  $19\unicode{x2013}37\ \mathrm {\mu }{\rm m}$. Thus, some nuclei may go unnoticed.
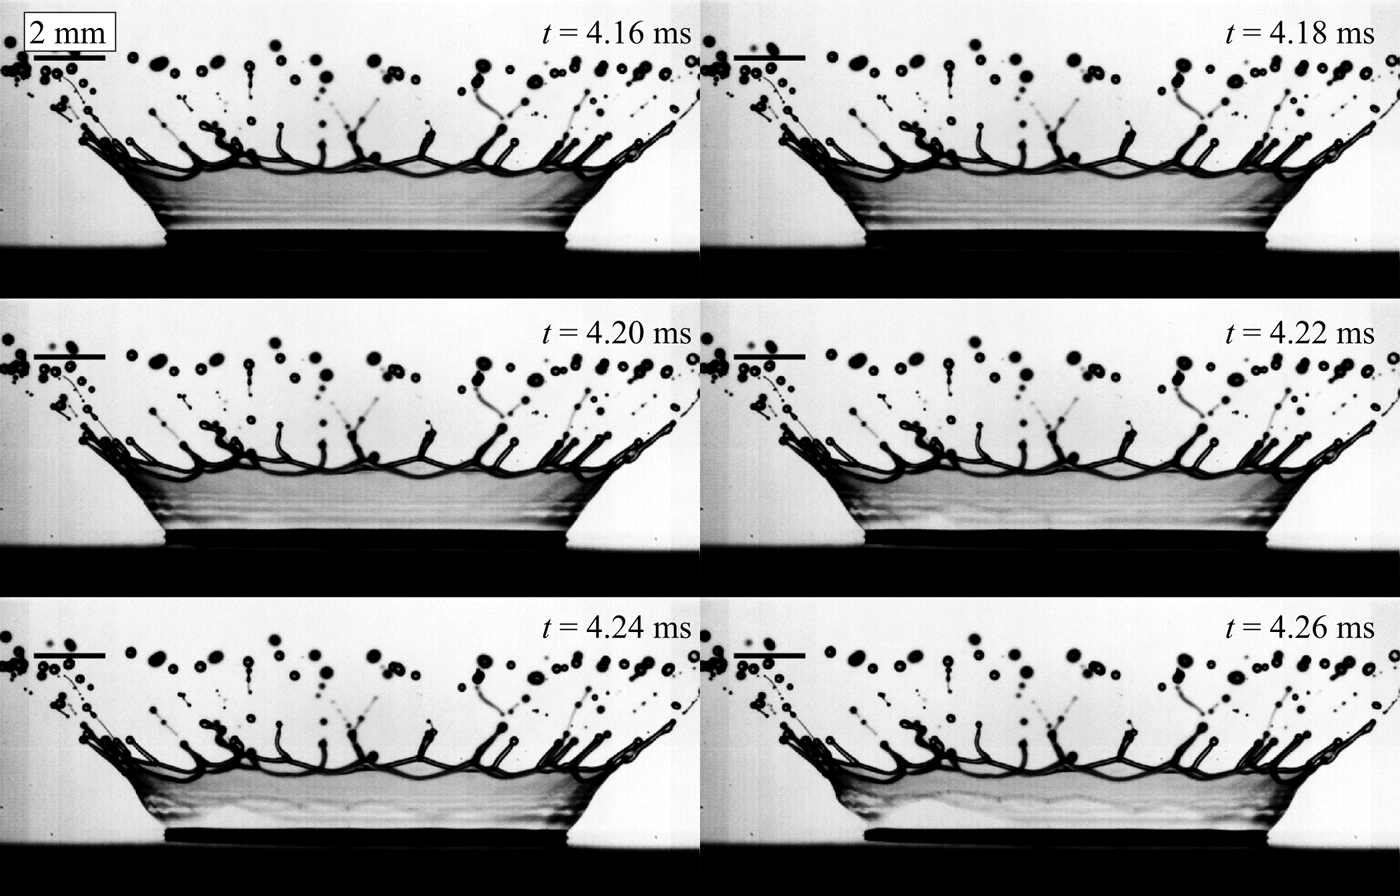
Figure 11. Consecutive images showing a situation where multiple holes form and lead to corona detachment. The contrast of the images has been increased to make the rupture more visible. Impact parameters are:  $D_0=2$ mm,
  $U_0=4.23\ {\rm m}\ {\rm s}^{-1}$,
  $H_{f0}=83\ \mathrm {\mu }{\rm m}$. Film and drop liquid are S10.
It should be emphasized that according to (4.38) the characteristic time of the nucleation of supercritical spontaneously growing holes is of the order  $\tau _{nucl}\sim k\tau _\eta$. Taking for the estimate
  $h= 1\ \mathrm {\mu }{\rm m}$ and
  $\nu \sim 10^{-2}\ {\rm cm}^2\ {\rm s}^{-1}$, one obtains
  $\tau _\eta \sim 10^{-6}$ s, whereas according to the experimental data discussed above
  $k \sim 10^2$, which yields
  $\tau _{nucl}\sim 10^{-4}$ s. This value of
  $k$ is intrinsically linked to the turbulence generation near the bottom of an impacting drop. First of all, the generation process would cease when the characteristic Reynolds number
  $Re_{i}$ would diminish to the level characteristic of a laminar flow, say to
  $Re_{{i}l}\sim 10^4$. Taking for the estimate the drop impact velocity
  $U_0 \sim 10^2\ {\rm cm}\ {\rm s}^{-1}$, the drop diameter
  $D_0\sim 3$ mm, and the kinematic viscosity
  $\nu \sim 10^{-2}\ {\rm cm}^2\ {\rm s}^{-1}$, one finds that the angle between the slope of the drop generatrix and the underlying horizontal
  $\gamma = \gamma_l \approx 10^{\circ }$ corresponds to
 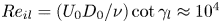 $Re_{{i}l}= (U_0 D_0/\nu )\cot \gamma _l \approx 10^4$. Accordingly, the duration of the turbulence generation process is
  $\tau _{gen}\sim D_0/(2U_0\cot \gamma _l)\sim 10^{-4}$ s. During the period of
  $\tau _{gen}$, ‘large’ turbulent eddies are generated and then undergo a cascade of instabilities breaking them into Kolmogorov dissipative eddies. The characteristic time scale
  $\tau _0$ of these ‘large’ eddies is related to the characteristic time scale of Kolmogorov dissipative eddies
  $\tau _\eta$ by the following expression:
 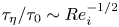 $\tau _\eta /\tau _0 \sim Re_{i}^{-1/2}$ (Pope Reference Pope2000). Accordingly, during the turbulence generation regime, say at
  $Re_{i}\sim 10^5, \tau _0 \sim \tau _\eta \,Re_{i}^{1/2} \sim 3 \times 10^{-4}$ s. This estimate shows that during the time of the order of
  $\tau _{gen}+\tau _0 \sim 4 \times 10^{-4}$ s, Kolmogorov eddies would be formed, swept into the corona and, acting collectively, nucleate supercritical spontaneously growing holes. On the other hand,
 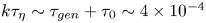 $k\tau _\eta \sim \tau _{gen}+\tau _0 \sim 4 \times 10^{-4}$ s, because the critical hole nuclei of the order of
 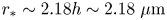 $r_* \sim 2.18 h \sim 2.18\ \mathrm {\mu }{\rm m}$ are still invisible in the experiment, and only holes of the order
  $19\unicode{x2013}37\ \mathrm {\mu }{\rm m}$ could be resolved by the camera. Taking for the estimate the least visible hole radius as
  $R\sim (20\unicode{x2013}40)h$, one finds the time required for such a hole to grow as
  $\tau _{hole} \sim R/u_{TC}^{\vphantom{2}}$, which with the help of (4.31) yields
  $\tau _{hole} \sim (20\unicode{x2013}40)h^{3/2}\rho ^{1/2}/(2\sigma )^{1/2} \sim 10^{-5}$ s (according to table 1 the values of
  $\rho \sim 10^3\ {\rm kg}\ {\rm m}^{-3}$ and
  $\sigma \sim 18\ {\rm mN}\ {\rm m}^{-1}$ were used for the estimate). This time is to be added to
  $\tau _{gen}+\tau _0$ and, thus, the corona detachment time is estimated as
  $t_{d}=\tau _{gen}+\tau _0+\tau _{hole} \sim 4.1 \times 10^{-4}$ s. On the other hand, the data in figures 3 and 9 reveal
  $t_d \sim 1$ ms, in reasonable agreement with the estimate.
Note also that the above estimates reveal that  $k \sim (\tau _{gen}+\tau _0)/\tau _\eta$. Because
  $\tau _{gen}\sim \nu ^{-1}$,
  $\tau _0 \sim \nu ^{-1}$ and
  $\tau _\eta \sim \nu ^{-1}$, the theoretical estimate of
  $k$ reveals that it is practically independent of the kinematic viscosity of fluid, which agrees with the fact that a single value of
  $k=73.43$ corresponds closely to the data for the fluids S5, S10 and S20 with different viscosities, as shown in figure 3. The theoretically estimated value is
  $k\approx 10^2$.
The predicted dependence of the corona detachment time  $t_d$ on the physical parameters of the problem is quite peculiar: it does not involve any parameters related to the impacting drop (neither its diameter
  $D_0$ nor velocity
  $U_0$). This is a manifestation of the fact that the generation of turbulent eddies happens in a narrow layer near the wall, whereas hole nucleation and growth happen already in the corona wall, at the ‘remote’ stage of the process, where the details of the original flow are already ‘forgotten’. In a sense, this resembles the drop splashing condition, which does not depend on the impacting drop diameter
  $D_0$, because the splashing process is fully determined by the flow within liquid lamella on the wall, whereas the ‘memory’ of the flow in the drop has already faded (Yarin & Weiss Reference Yarin and Weiss1995; Yarin Reference Yarin2006).
Note that the number of physical parameters that determine the corona detachment time  $t_d$ is now reduced to only four: the density
  $\rho$, the kinematic viscosity
  $\nu$, the surface tension
  $\sigma$ and the film thickness at the wall
  $H_{f0}$. These four parameters involve three independent units, and thus, according to the Buckingham Pi-theorem (Yarin Reference Yarin2012), the dimensionless corona detachment time
  $\bar {t}_{d}=t_{d}/(H^2_{f0}/\nu )$ should depend on a single dimensionless group, denoted here as the corona number
  $Co$. Accordingly, (4.45) yields
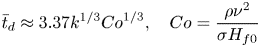 \begin{equation} \bar{t}_d \approx 3.37 k^{1/3}{Co}^{1/3}, \quad {Co} =\frac{\rho \nu^2}{\sigma H_{f0}} \end{equation}
 To test this dimensionless law, the dimensionless detachment time  $\bar {t}_d$ is plotted against the right-hand side of (4.46a,b) using the value
  $k=73.43$ in figure 12. As this figure indicates, the main dependency of
  $\bar {t}_d$ is indeed captured by the corona number, although the scatter seen in this diagram suggests that a further second-order dependence is not yet fully captured with this scaling.
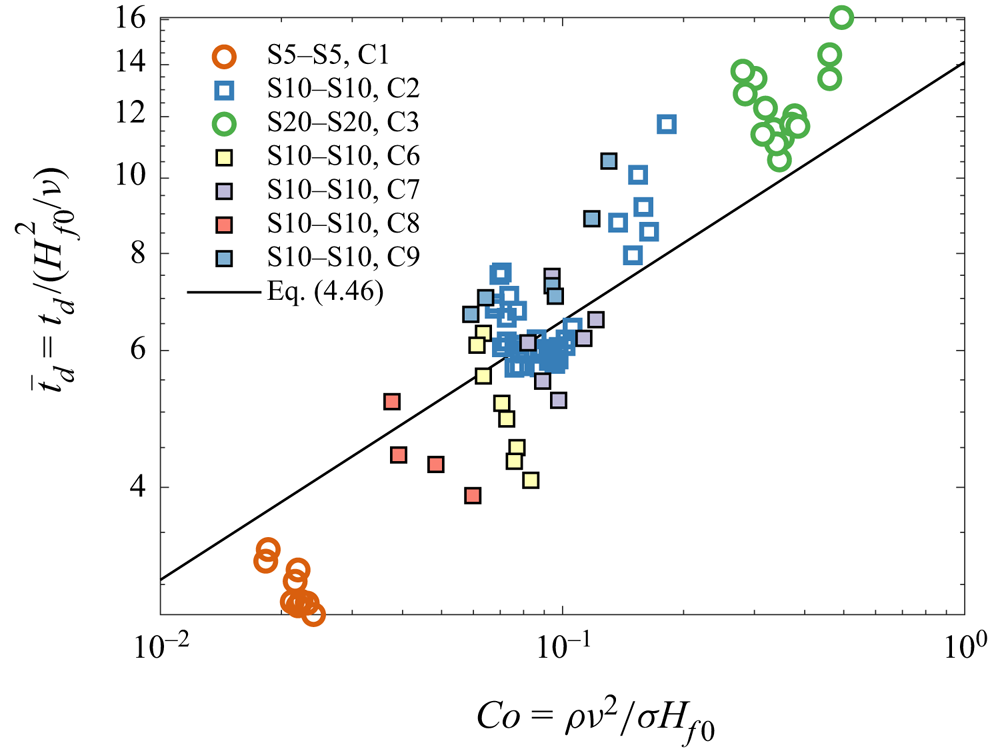
Figure 12. Dimensionless time of detachment  $\bar{t}_d$ over the corona number Co. The black line represents (4.46a,b) with
  $k=73.43$.
Finally, should a small air disc be entrapped at the centre between the drop and film surfaces (Thoraval et al. Reference Thoraval, Takehara, Etoh, Popinet, Ray, Josserand, Zaleski and Thoroddsen2012; Li et al. Reference Li, Thoraval, Marston and Thoroddsen2018), the singularity of the type discussed here inevitably happens at the first contact between the two liquid surfaces, with all the same consequences following.
4.5. Detachment of the corona formed by drop impact onto a layer of another liquid
When a drop impacts onto a liquid layer, it transforms into a disk practically without viscous losses (Yarin & Weiss Reference Yarin and Weiss1995). This transformation takes time of the order of  $D_0/U_0$. Because viscous losses are neglected, the radial velocity of spreading is still of the order of
  $U_0$. Accordingly, the resulting disk radius is equal to
  $D_0$. Then, the initial disk thickness
  $H_{fd0}$ is found from the volume conservation condition
  ${\rm \pi} D_0^2 H_{fd0}={\rm \pi} D_0^3/6$ as
 \begin{equation} H_{fd0}=\frac{D_0}{6}. \end{equation}
Taking for the estimate  $D_0 \sim 10^{-1}\ \text {cm}$, one finds that
  $H_{fd0}=170\ \mathrm {\mu }\text {m}$, which is comparable or thicker than many pre-existing liquid films on the wall. Because of the appropriate profile of the radial velocity in this disk-like film, corona formation will be driven by it, and liquid radially outflowing from the impact point will be propelled into the corona. However, if (and only if) a different liquid is contained in the pre-existing liquid film, then, the velocity and shear stresses should be continuous at the liquid–liquid interface, which yields the condition
 \begin{equation} \mu_1\frac{U_{1{s}}}{\delta_1}=\mu_2\frac{U_{2{s}}-U_{1{s}}}{\delta_2}, \end{equation}
where subscript 1 corresponds to the pre-existing liquid film and subscript 2 corresponds to the film formed by the drop liquid. Also, the dynamic viscosities of the liquids are denoted as  $\mu _1$ and
  $\mu _2$, the dimensional interfacial velocity is denoted as
  $U_{1{s}}$ and the velocity at the free surface as
  $U_{2{s}}$. In addition, the dimensional viscous lengths are denoted as
  $\delta _1$ and
  $\delta _2$. It should be emphasized that (4.48) is invalid if the liquids in the drop and the pre-existing liquid film are the same.
Note that approximately
 \begin{equation} \delta_1=\sqrt{\nu_1 (t-t_0)}, \quad \delta_2=\sqrt{\nu_2 (t-t_0)}, \end{equation}
where  $\nu _1$ and
  $\nu _2$ are the kinematic viscosities, and
  $t$ is dimensional time. Accordingly,
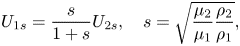 \begin{equation} U_{1{s}}=\frac{s}{1+s}U_{2{s}}, \quad s=\sqrt{\frac{\mu_2}{\mu_1}\frac{\rho_2}{\rho_1}}, \end{equation}
where  $\rho _1$ and
  $\rho _2$ are liquid densities, and the velocities can either still be dimensional or rendered dimensionless by the same velocity scale.
Consider entrainment of liquid from the pre-existing film on the wall. The radial velocity profile in it can be taken in the first approximation as
 \begin{equation} v_r=U_{1{s}}\frac{\tilde{y}}{\tilde{\delta}_1}, \end{equation}
where  $\tilde {y}$ is the normal coordinate reckoned from the wall (where
  $\tilde {y}=0$), and
  $\tilde {y}$ and
  $\tilde {\delta }_1$ are rendered dimensionless by
  $H_{f0}$ and velocities with
  $U_0$. Accordingly, in dimensionless form the first expression from (4.49a,b) reads
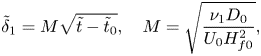 \begin{equation} \tilde{\delta}_1=M\sqrt{\tilde{t}-\tilde{t}_0}, \quad M=\sqrt{\frac{\nu_1 D_0}{U_0 H_{{f0}}^2}}, \end{equation}
using the same scale for time as in § 4 or in Yarin & Weiss (Reference Yarin and Weiss1995). Then, at the corona,  $\tilde {U}_{2{s}}=\tilde {U}_c$, with the latter being given by (4.18), i.e.
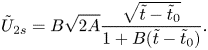 \begin{equation} \tilde{U}_{2{s}}=B\sqrt{2A}\frac{\sqrt{\tilde{t}-\tilde{t}_0}}{1+B(\tilde{t}-\tilde{t}_0)}. \end{equation}
The dimensionless volumetric flow rate of liquid from the pre-existing liquid film entrained into the radial motion and ultimately propelled into the corona is found as
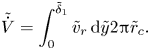 \begin{equation} \tilde{\dot{V}}=\int_0^{\tilde{\delta}_1}\tilde{v}_r\,{\rm d}\tilde{y}2{\rm \pi} \tilde{r}_c. \end{equation}
The volumetric flow rate is rendered dimensionless by  $U_0D_0H_{{f0}}$. Using (4.50a,b)–(4.53) and (4.17), the latter yields
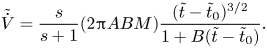 \begin{equation} \tilde{\dot{V}}=\frac{s}{s+1}(2{\rm \pi} ABM)\frac{(\tilde{t}-\tilde{t}_0)^{3/2}}{1+B(\tilde{t}-\tilde{t}_0)}. \end{equation}
Using (4.55), one finds the dimensionless volume of the pre-existing liquid film entrained into the corona by time  $\tilde {t}$ as
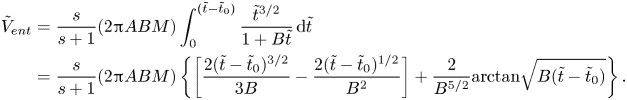 \begin{align} \tilde{V}_{ent} &=\frac{s}{s+1}(2{\rm \pi} ABM) \int_{0}^{(\tilde{t}-\tilde{t}_0)}\frac{\tilde{t}^{3/2}}{1+B \tilde{t}}\,{\rm d}\tilde{t} \nonumber\\ &=\frac{s}{s+1}(2{\rm \pi} ABM)\left\{\left[\frac{2(\tilde{t}-\tilde{t}_0)^{3/2}}{3B}-\frac{2(\tilde{t}-\tilde{t}_0)^{1/2}}{B^2} \right]+\frac{2}{B^{5/2}}\text{arctan}\sqrt{B(\tilde{t}-\tilde{t}_0)}\right\}. \end{align}
This volume is rendered dimensionless by  $D_0^2H_{\textrm {f0}}$. In the short-time limit of interest here, (4.56) yields
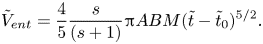 \begin{equation} \tilde{V}_{ent}=\frac{4}{5}\frac{s}{(s+1)}{\rm \pi} ABM(\tilde{t}-\tilde{t}_0)^{5/2}. \end{equation}
The dimensionless thickness of the corona wall formed by liquid 1 entrained from the pre-existing film at the wall,  $h_1$, is found from the condition employing (4.57) as
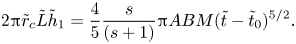 \begin{equation} 2{\rm \pi} \tilde{r}_c \tilde{L} \tilde{h}_1=\frac{4}{5}\frac{s}{(s+1)}{\rm \pi} ABM(\tilde{t}-\tilde{t}_0)^{5/2}. \end{equation}
The thickness  $h_1$ is rendered dimensionless by
  $H_{\textrm {f0}}$. Using (4.17) and (4.21), one finds from (4.58) that
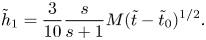 \begin{equation} \tilde{h}_1=\frac{3}{10}\frac{s}{s+1}M(\tilde{t}-\tilde{t}_0)^{1/2}. \end{equation}
The corresponding dimensional expression takes the form
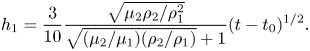 \begin{equation} h_1=\frac{3}{10}\frac{\sqrt{\mu_2 \rho_2 / \rho_1^2}}{\sqrt{(\mu_2/\mu_1)(\rho_2/\rho_1)}+1}(t-t_0)^{1/2}. \end{equation}
The latter shows that if the drop liquid is much more viscous than the liquid in the pre-existing liquid film on the wall, i.e.  $\mu _2 /\mu _1 \gg 1$, then
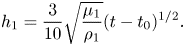 \begin{equation} h_1=\frac{3}{10}\sqrt{\frac{\mu_1}{\rho_1}}(t-t_0)^{1/2}. \end{equation}
In the opposite limit,  $\mu _2/\mu _1 \ll 1$, where the drop liquid is much less viscous than the liquid in the pre-existing film on the wall, (4.60) yields
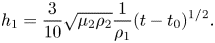 \begin{equation} h_1=\frac{3}{10}\sqrt{\mu_2\rho_2}\frac{1}{\rho_1}(t-t_0)^{1/2}. \end{equation}
Equations (4.61) and (4.62) express therefore the part of the corona wall thickness comprised of liquid from the pre-existing wall film depending on the ratio of dynamic viscosities. In both cases the thickness increases with the same time dependence. This theoretical result is not straightforward to confirm experimentally, but is the subject of further investigation.
5. Conclusions
In this study the impact of a liquid drop onto a solid substrate pre-wetted by a film of the same or another liquid is studied, and a fascinating phenomenon of a complete, almost instantaneous detachment of the cylindrical corona sheet from the pre-existing liquid film on the wall is observed. The viscosity and the viscosity ratio of these liquids is varied over a wide range, through which conditions for a detachment of the corona liquid sheet from the wall film could be experimentally investigated. Focus was then placed on the physics behind the almost instantaneous and uniform corona detachment and a theory was proposed to predict the time of corona detachment, based on the thinning rate of the corona wall. The breakup of liquid sheets is a fundamental step in numerous atomizers, such as pressure swirl, flat fan nozzles or as a limiting factor in thin-film coating processes. Knowing the instant of liquid sheet breakup is a first step to predicting drop size distributions in atomization processes. This will undoubtedly involve adjustment of perturbation characteristics, accounting for the disturbance levels present in the liquid sheet; however, the approach could remain unchanged (cf. Bang et al. Reference Bang, Ahn, Yoon and Yarin2023).
Even though liquid is permanently propelled into the corona sheet and gravity plays practically no role, the thinning of the corona sheet with time is predicted theoretically, exhibiting excellent agreement with experimental findings. This is related to the fact that the corona radius expansion in time appears to be the dominant process, which determines the corona sheet thinning. For this comparison between the theory and experiment, the Taylor–Culick relation was employed as a means for measuring the local, instantaneous thickness of the corona sheet at or near the time of rupture. This was made possible by the use of high-speed videos, which could capture the movement of the free rim at the perimeter of the rupture holes in the corona sheet. This method can easily be applied as a film thickness measurement of other rupturing liquid films.
It is shown that an ongoing thinning of the corona sheet with time makes the nucleation of ‘supercritical’ (by radius) holes more probable, i.e. those holes whose growth in time is sustained by a decrease in the total surface energy in the system ‘corona sheet with a hole surrounded by a free rim’. Accordingly, growth of supercritical holes is shown to be energetically favourable. The hole nuclei are attributed to Kolmogorov eddies resulting from the strong shear field at the interface of the impacting drop and the pre-existing liquid film on the wall. Being entrained in the corona sheet, these random velocity fluctuations rupture the hole nuclei with a high probability if the sheet is sufficiently thin ( ${\sim }1\ \mathrm {\mu }{\rm m}$). This explains why a ‘perfect corona detachment’ (with a sharp uniform cutoff) happens at its base, where the disturbances are entrained, resulting almost instantaneously in hole nuclei, which rapidly increase in size and merge. The probability of a system of ‘velocity fluctuations and a critical hole’ is given by the Gibbs distribution rooted in the microcanonic
  $\delta$-functional distribution of thermodynamics.
Moreover, the growth process of the supercritical holes in time is described using the Taylor–Culick formula for the velocity of propagation of a free rim over a corona sheet, and thus, the time required for supercritical holes to break the intact corona sheet up is predicted in the framework of the percolation theory. This is the time of corona detachment  $t_d$, and it is shown theoretically that this time is related to the thickness of the pre-existing liquid film on the wall
  $H_{f0}$ by the following scaling law:
  $t_d \sim H_{f0}^{5/3}$. This theoretical scaling appears to be reliable if the drop and film liquid are the same, but does not properly predict the detachment time for dissimilar liquids. In the case of dissimilar liquids in the impacting drop and the pre-existing liquid film on the wall, the experimental data show that the scaling apparently changes slightly depending on the viscosity ratio. Note that the predicted dependence of the corona detachment time
  $t_d$ on the physical parameters of the problem depends neither on diameter
  $D_0$ nor velocity
  $U_0$ of the impacting drop. This result stems from the fact that generation of turbulent eddies is localized in a narrow layer near the wall, while hole nucleation and growth are localized in the corona wall, i.e. at the ‘remote’ stage when the ‘memory’ of the original flow has already faded.
It should be emphasized that the notion of the ‘kinematic thinning mechanism’ leading to hole formation (Villermaux Reference Villermaux2020) does not contradict the present model, because it implies spontaneous hole nucleation (without further elaboration), exactly as it is done in the present work. Such a hole nucleation is illustrated by multiple spectacular images collected in the review of Villermaux (Reference Villermaux2020). The present model reveals that the predicted detachment time of a locally uniform film (on the scale of a hole nucleus) is in reasonably good agreement with the experimental data.
The case of dissimilar liquids is also studied theoretically and the thickness of the part of the corona sheet comprised of the liquid from the pre-existing liquid film on the wall is predicted as a function of time and the viscosities and densities of both liquids (in the pre-existing film and the impacting drop). This theoretical result is not currently straightforward to verify experimentally, but can probably be tackled in future research.
In the broader context a ‘perfect corona detachment’ observed and explained in this work is a manifestation of the almost instantaneous rupture processes characteristic of liquid and solid bodies with high ‘frozen-in’ skin or body stresses. In the present case this is a very thin corona sheet, which is almost instantaneously cut off from the pre-existing liquid film at the wall by the ‘frozen-in’ surface tension, which rapidly increases supercritical holes nucleated by entrained turbulent eddies. A solid-state analog is provided by Scirpus plants (reed, club-rush, wood club-rush or bulrush) whose ripe ‘flowers’ on top of a dry cane are brown cylindrical tightly packed clusters of small spikelets. After being slightly touched, the spikelets release themselves from the pack practically instantaneously in a sparkling champagne-like way and immediately become airborne.
Funding
This research was supported by the German Research Foundation (Deutsche Forschungsgemeinschaft) in the framework of the SFB-TRR 150 collaborative research center, subproject A02, project number 237267381.
Declaration of interests
The authors report no conflict of interest.


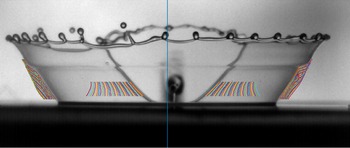


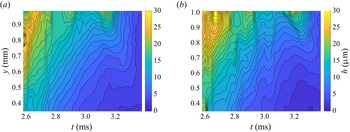


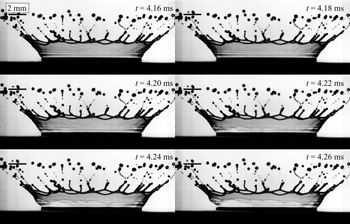


 Open access