


Introduction
Carnivore populations are undergoing range contractions globally (Wolf & Ripple, Reference Wolf and Ripple2017), with declines largely a result of anthropogenic threats, including persecution, hunting, poaching, habitat loss and insufficient prey (Wolf & Ripple, Reference Wolf and Ripple2016). As such, protected areas are considered essential for effective species conservation (Le Saout et al., Reference Le Saout, Hoffmann, Shi, Hughes, Bernard and Brooks2013). However, there is evidence of cross-boundary impacts of human activities on protected areas, ranging from edge effects on specific species (Balme et al., Reference Balme, Slotow and Hunter2010) to system-wide changes in ecosystem processes (Veldhuis et al., Reference Veldhuis, Ritchie, Ogutu, Morrison, Beale and Estes2019). Unprotected areas may provide favourable habitat and connectivity for various species (Kent & Hill, Reference Kent and Hill2013; Swanepoel et al., Reference Swanepoel, Lindsey, Somers, van Hoven and Dalerum2013; Pitman et al., Reference Pitman, Fattebert, Williams, Williams, Hill and Hunter2017a). Consequently, there is increasing interest in conservation and mitigation actions in buffer areas around protected areas and in the broader agricultural matrix (Woodroffe & Ginsberg, Reference Woodroffe and Ginsberg1998; van der Meer et al., Reference van der Meer, Fritz, Blinston and Rasmussen2014).
There is growing evidence of the importance of the agricultural matrix to wildlife and landscape conservation. For example, small carnivores persist in rural smallholder agroecosystems (Nogeire et al., Reference Nogeire, Davis, Duggan, Crooks and Boydston2013; Williams et al., Reference Williams, Maree, Taylor, Belmain, Keith and Swanepoel2018a) where they provide important ecosystem services (Ćirović et al., Reference Ćirović, Penezić and Krofel2016; Williams et al., Reference Williams, Maree, Taylor, Belmain, Keith and Swanepoel2018a). Similarly, the agricultural matrix can provide stepping stones in species migration or dispersal (Davies-Mostert et al., Reference Davies-Mostert, Kamler, Mills, Jackson, Rasmussen and Groom2012; Fattebert et al., Reference Fattebert, Dickerson, Balme, Slotow and Hunter2013) or form corridors to connect protected areas (Pitman et al., Reference Pitman, Fattebert, Williams, Williams, Hill and Hunter2017a). Although protected areas cover c. 15% of the terrestrial surface (Geldmann et al., Reference Geldmann, Manica, Burgess, Coad and Balmford2019), pressures from human activities (especially land conversion for agriculture) inside protected areas may often be significantly higher than outside these areas in South America, South-east Asia and sub-Saharan Africa (Geldmann et al., Reference Geldmann, Manica, Burgess, Coad and Balmford2019). In South Africa, c. 9.2% of land is protected formally, with 25.6% of this area comprising privately owned protected areas (De Vos & Cumming, Reference De Vos and Cumming2019). However, protected areas are not impervious to the landscapes within which they exist, or to changes in and demands from society (De Vos et al., Reference De Vos, Clements, Biggs and Cumming2019), in some cases even resulting in protected area downgrading, downsizing and degazettement (Mascia & Pailler, Reference Mascia and Pailler2011).
Carnivores are vulnerable to anthropogenic landscape alterations such as land conversion for agriculture. Agricultural intensification leads to habitat loss and fragmentation, one of the most serious threats to biodiversity (Šálek et al., Reference Šálek, Červinka, Pavluvčík, Poláková and Tkadlec2014). Globally, the growth of human populations and per capita consumption generates increasing agricultural pressure on natural resources (Dobrovolski et al., Reference Dobrovolski, Diniz-Filho and Loyola, R.D. & De Marco2011). Understanding how biodiversity is affected by agricultural landscapes is therefore of particular importance to species conservation (Shamoon et al., Reference Shamoon, Saltz and Dayan2017). Nonetheless, these landscapes may be of considerable value for carnivore species (Kent & Hill, Reference Kent and Hill2013). In South Africa, carnivores in agricultural landscapes face threats in addition to habitat fragmentation. For example, in some areas the natural prey base has been depleted by bushmeat poaching or unsustainable hunting (Wolf & Ripple, Reference Wolf and Ripple2016; Rogan et al., Reference Rogan, Lindsey, Tambling, Golabek, Chase and Collins2017), or replaced with livestock or game farming (Grossmann et al., Reference Grossmann, Holden, Collinson and Tainton1999). Legal and illegal persecution where carnivores compete for food with people can often result in trapping, poisoning or shooting to mitigate conflict (Nattrass & Conradie, Reference Nattrass and Conradie2018). Consequently, habitats shared between people and carnivores can function as a population sink, in which persistence is compromised by unsustainable offtake (Abade et al., Reference Abade, Cusack, Moll, Strampelli, Dickman, Macdonald and Montgomery2018). However, crop farming areas may offer certain carnivore species alternative food sources. For example, small- to medium-sized carnivores may benefit from rodent populations in agricultural cropping areas (Williams et al., Reference Williams, Maree, Taylor, Belmain, Keith and Swanepoel2018a), whereas in livestock farming areas some scavenging species may take advantage of livestock mortalities and so provide organic waste disposal services (O'Bryan et al., Reference O'Bryan, Braczkowski, Beyer, Carter, Watson and McDonald-Madden2018). Kent & Hill (Reference Kent and Hill2013) suggest that a significant proportion of the global brown hyaena population lives in unprotected areas such as livestock farms. Protected areas are not always large enough to conserve viable populations of animals, especially for wide-ranging species such as the leopard Panthera pardus, hyaena Crocuta crocuta and Parahyaena brunnea and African wild dog Lycaon pictus (Swanepoel et al., Reference Swanepoel, Lindsey, Somers, van Hoven and Dalerum2013). Furthermore, c. 68% of the habitat most suitable for leopards in South Africa lies outside protected areas (Swanepoel et al., Reference Swanepoel, Lindsey, Somers, van Hoven and Dalerum2013).
Although unprotected areas and the agricultural matrix can play an important role in carnivore conservation, little research has focused on this (Shamoon et al., Reference Shamoon, Saltz and Dayan2017). Here we use an intensively utilized agricultural landscape as a model to estimate the density of four sympatric carnivore species: the African leopard, spotted and brown hyaenas, and African civet Civettictis civetta. We focus on these species because they have unique coat patterns that facilitate individual recognition and robust density estimates, and they are exposed to varying levels of human–carnivore conflict. African leopards and spotted hyaenas are frequently subjected to persecution (Gusset et al., Reference Gusset, Swarner, Mponwane, Keletile and McNutt2009; Thorn et al., Reference Thorn, Green, Dalerum, Bateman and Scott2012; Constant et al., Reference Constant, Bell and Hill2015), and we expect their densities to be low in comparison to similar habitats in protected areas. Brown hyaenas may experience less conflict than leopards (Constant et al., Reference Constant, Bell and Hill2015), but we still expect their densities to be low as they are persecuted using the same non-selective trapping techniques, and may rely on leopard kills for scavenging opportunities (Williams et al., Reference Williams, Williams, Fitzgerald, Sheppard and Hill2018b). The African civet is the least conflict-prone species, although occasionally subjected to conflict where poultry farming occurs (Croes et al., Reference Croes, Buij, van Dalen, de Iongh, Croes, Bauer, de Iongh, Croes, Buij, de Iongh and Bauer2008), and we expect its density to be similar to that in protected areas. Locating our study in a livestock, game and crop farming area enables us to investigate carnivore densities in a human-dominated landscape where there is conflict with carnivores. We compare our density estimates for the four species to density estimates in both protected and unprotected areas elsewhere in southern Africa, to gauge the conservation value of the agricultural matrix.
Study area
The study area is in Platjan, in northern Limpopo Province, South Africa, where it borders Botswana (Fig. 1), within the Blouberg (Ward 20) Municipal Area, which has an estimated human population of 9,154 (240 people per 100 km2; Statistics South Africa, 2011). Forty-eight per cent of the population is unemployed and only 15.9% have completed high school (Statistics South Africa, 2011). Forty-three per cent of this region's population is aged 0–19 years, 33% 20–39, and 24% > 40 years (Statistics South Africa, 2011).
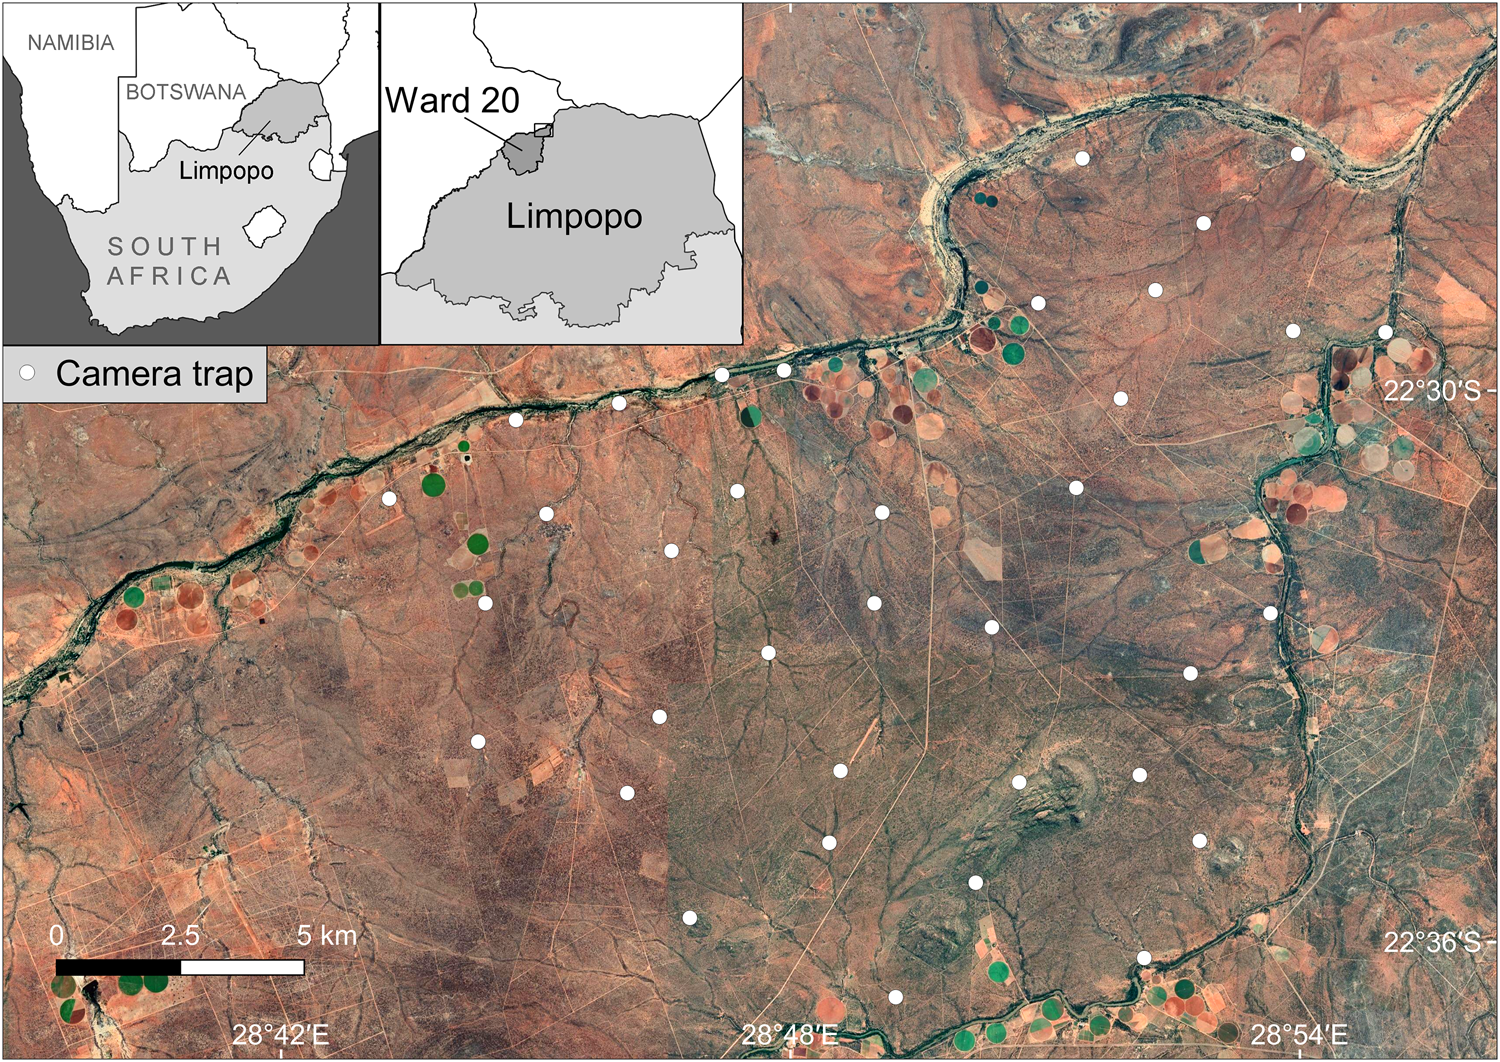
Fig. 1 Study area, with camera-trap locations in the Platjan area, Limpopo Province, South Africa (background map © 2021 Google, Maxar Technologies, CNES/Airbus).
The vegetation is classified as Limpopo Sweet Bushveld (Mucina & Rutherford, Reference Mucina and Rutherford2006), and altitude is 600–1,000 m. It is a summer (December–February) rainfall region with dry winters (June–August) and a mean annual rainfall of 300–400 mm (Mucina & Rutherford, Reference Mucina and Rutherford2006).
The area comprises a mixed land-use system, predominantly commercial crop farming (dominated by butternut squash, onion, potato and corn), livestock farming (mostly cattle and goats), game farming for hunting, and one eco-tourism reserve. The camera-trapping grid lies within 29 privately owned farms, owned by 18 landowners; 41.4% of the properties were utilized for hunting and game farming, 34.5% for mixed agricultural farming practices (crop and livestock), 10.3% for livestock farming and hunting, 7% for mixed land uses (crop, livestock and hunting), 3.4% for crop farming, and 3.4% for ecotourism. All of the properties are surrounded by fencing, with the majority being electrified and c. 1.8 m high to keep game species in. Nonetheless, most of the fences have multiple holes, often created by warthogs Phacochoerus africanus, providing some connectivity between properties.
Wildlife and habitat within the area are exposed to various anthropogenic threats and disturbances such as legal and illegal, selective and non-selective predator control (such as trapping, poisoning, shooting and snaring), and the transformation of habitat for agricultural practices. This reflects the situation in the province more broadly (Thorn et al., Reference Thorn, Green, Dalerum, Bateman and Scott2012; Pitman et al., Reference Pitman, Swanepoel, Hunter, Slotow and Balme2015).
Methods
We surveyed carnivores using camera traps during 1 August–29 October 2017, deploying 72 camera traps at 36 stations on average 2.04 km apart, with a maximum spacing of 2.86 km (Fig. 1). This spacing minimized chances of gaps between camera traps being large enough to encompass the entire home range of an individual of one of our study species, so that all individuals had a probability of capture > 0. Roads and trails were actively searched for carnivore scats and tracks, to guide selection of sites for camera traps, thereby maximizing the probability of detecting the four carnivore species. Camera traps were set at c. 40 cm above the ground, in pairs, perpendicular to the trail and level with the ground, to maximize chances of detection. No bait or lures were used. Trigger time between consecutive photographic captures was set to the minimum possible time for each camera, to maximize the possibility of obtaining suitable images of both flanks for individual identification from pelage patterns. The most suitable area for individual identification of leopards, spotted hyaenas and African civets is their flanks, whereas brown hyaenas can be identified by the stripe patterns on their legs. We used a Reconyx (either a HC500 or HC600 model; Reconyx, Holmen, USA) camera at each station, paired with either another Reconyx or a Bushnell Trophy Camera (Bushnell, Overland Park, USA), Browning Recon Force (Browning Trail Cameras, St. Louis, USA), or Cuddeback Long Range C2 camera (Cuddeback, Green Bay, USA). The total area covered by the camera-trapping grid was 195 km2. We considered this an adequate size for spatial capture–recapture analyses as it is large enough to cover estimates of mean home range for our study species from similar environments (Supplementary Table 1). We visited the camera traps at least once per month to change batteries and memory cards, clear vegetation in front of the camera's field of view, and to ensure proper functioning. The survey period was limited to 90 days so as not to violate the capture–recapture closure assumption (Kery & Royle, Reference Kery and Royle2016).
Individuals of the focal species were identified based on their unique coat patterns, using the open-source pattern recognition software Hotspotter (Crall et al., Reference Crall, Stewart, Berger-Wolf, Rubenstein and Sundaresan2013), and then verified manually. We selected our sampling occasions to stretch across midnight (from 12.00 to 11.59 the following day) as all our study species are predominantly nocturnal, with sampling occasions set to 1-day periods. We constructed spatial capture histories for all the identified individuals for the 90 sampling occasions. As we did not obtain images of both flanks of all individuals, we estimated density first by excluding individuals for which we only had left-flank images, and then by excluding those for which we only had right-flank images, and compared the results.
We used a maximum likelihood modelling approach to fit spatial capture–recapture models to estimate population densities of the four species. Models were implemented using the package secr 4.2.0 in R 3.6.2 (R Development Core Team, Reference Development Core Team2016). Density was estimated within the state space, which consists of an explicit spatial region within which sampling occurs. This area includes the trapping grid and a buffer zone, to ensure that the activity centres of all individuals potentially exposed to sampling would be included in the buffer area (Kery & Royle, Reference Kery and Royle2016). We used the number of days a camera station was active (i.e. trap-nights) as a variable in the detection process. We examined the effect of varying the buffer size (5–45 km, with 2.5 km increments; Supplementary Fig. 1) to test its influence on predicted density estimates, using buffer sizes that were sufficiently large to include all activity centres of individuals exposed to trapping. We assumed buffers were large enough if the density estimates began to plateau with increasing buffer size and if the model's buffer was at least 3 times the size of σ (the spatial scale parameter). We used a buffer of 25 km for the civet and leopard, 30 km for the brown hyaena and 40 km for the spotted hyaena. The state space was described by 14,500 (civet and leopard), 19,119 (brown hyaena), and 30,219 (spotted hyaena) equally spaced points in a regular grid with a mesh size of 0.25 km2. We assumed carnivores could utilize anthropogenically modified areas (e.g. agricultural fields) in the study area, and consequently all possible home range centres in the state space were marked as suitable habitat in the input files.
Results
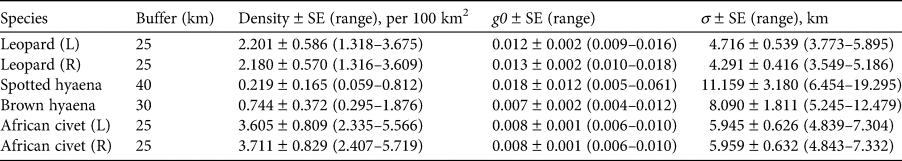
The 90-day camera-trap survey period comprised 2,988 trap-nights, with each individual camera-trap station active for a mean of 88 days (range: 49–90 days). We captured leopards at 28 camera-trap stations (78% of the total) and obtained on average 3.03 ± SE 0.84 and 3.08 ± SE 0.85 independent captures for left and right flank data at each station, respectively (Table 1). For the spotted and brown hyaenas there were no identification discrepancies between the left and right flank data. Spotted hyaenas were captured at 17 camera-trap stations (47%) and we obtained on average 1.89 ± SE 0.64 independent captures. Brown hyaenas were captured at 23 camera-trap stations (64%) and we obtained on average 2.36 ± SE 0.51 independent captures. African civets were captured at 32 camera-trap stations (89%) and we obtained on average 5.00 ± SE 0.95 left flank and 4.78 ± SE 0.94 right flank independent captures. We identified 21 and 19 individual adult leopards (left and right flank data, respectively), nine spotted hyaenas, 14 brown hyaenas, and 43 and 44 civets (left and right flank data, respectively). We identified one subadult leopard and one subadult spotted hyaena but no juveniles. For leopards, we recorded nine adult males, eight adult females, and five individuals of unknown sex. We could not reliably sex spotted hyaenas, brown hyaenas or African civets. Leopards had the highest baseline detection rate (i.e. the probability of detecting an individual at its activity centre), g0, and the two hyaena species had the largest estimated spatial scale parameter (i.e. the rate of decrease in encounter probability as a function of distance to the camera trap), σ. Density estimates ranged from 0.22 spotted hyaenas per 100 km2 to 3.71 African civets per 100 km2 (Table 2).
Table 1 Total number of captures, number of captured individuals, number of individuals recaptured 0–8 times, and the mean ± SE of the mean maximum distance moved (MMDM) for four carnivore species in Platjan, South Africa (Fig. 1). Left and right flank data are denoted by L and R, respectively.
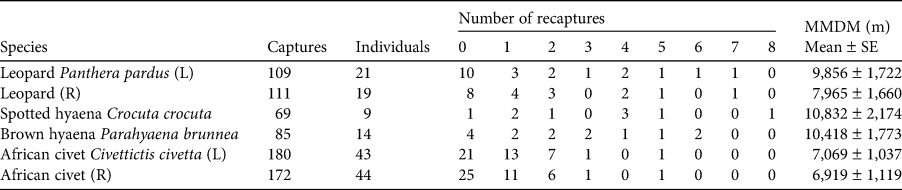
Table 2 The buffer width, and estimated mean parameter values ± SE and range from spatial capture–recapture models for four carnivore species in Platjan: estimated density, detection rate (g0), and spatial scale parameter (σ). Left and right flank data are denoted by L and R, respectively.
Discussion
Our results indicate that carnivores can co-occur with humans in agricultural areas and thus illustrates the potential importance of such areas for the conservation of free-ranging carnivore species. Although our estimates of density fall within the range of densities reported for the leopard, brown hyaena and African civet in both protected and unprotected areas, these estimates were lower in comparison to similar environments elsewhere, and closer to estimates reported for more arid regions.
The estimate of 2.2 leopards per 100 km2 is at the lower end of the range reported from 21 camera-trapping surveys in seven protected areas in Limpopo Province, South Africa (0.87–6.55 per 100 km2; Rogan et al., Reference Rogan, Balme, Distiller, Pitman, Broadfield and Mann2019). Although some of the highest recorded densities of southern African leopards came from unprotected land (Chase Grey et al., Reference Chase Grey, Kent and Hill2013, but see Williams et al., Reference Williams, Williams, Lewis and Hill2017) our density estimates are similar to those for other farming areas and slightly below those in protected areas (Fig. 2).

Fig. 2 Estimates of density ranges (individuals/100 km2) from spatial capture–recapture studies of (a) the African civet Civettictis civetta, (b) brown hyaena Parahyaena brunnea, (c) spotted hyaena Crocuta crocuta and (d) leopard Panthera pardus in protected and unprotected areas across southern Africa, including this study (top bar in each case). See Supplementary Table 2 for details of sources. GR, Game Reserve; NR, Nature Reserve.
The estimate of 0.219 spotted hyaenas per 100 km2 was much lower than previous studies in similar environments such as the Ngamiland District (Rich et al., Reference Rich, Miller, Muñoz, Robinson, McNutt and Kelly2019) and central Tuli, Botswana (Vissia et al., Reference Vissia, Wadhwa and van Langevelde2021), but similar to estimates from farmlands in the Tsauchab River Valley, Namibia (Fouché et al., Reference Fouché, Reilly, de Crom, Baeumchen and Forberger2020; Fig. 2). Call-up surveys in different vegetation types in Kruger National Park, South Africa recorded densities of 2.6–21.1 individuals per 100 km2 (Mills et al., Reference Mills, Juritz and Zucchini2001), and clans of up to 133 individuals per 100 km2 have been estimated in Ngorongoro, Tanzania (Höner et al., Reference Höner, Wachter, East, Runyoro and Hofer2005). Although density estimates from call-up studies and spatial capture–recapture cannot be compared directly, the results nevertheless suggest substantial differences between areas, suggesting significant anthropogenic influence on the Platjan population.
The estimate of 0.74 brown hyaenas per 100 km2 was similar to numbers extrapolated from occupancy estimates in the North-West Province, South Africa (Thorn et al., Reference Thorn, Green, Bateman, Waite and Scott2011), but lower than in similar environments such as the Ghanzi District, Botswana (although within the 95% confidence intervals; Kent & Hill, Reference Kent and Hill2013), Pilanesberg National Park, South Africa (Thorn et al., Reference Thorn, Scott, Green, Bateman and Cameron2009), and Central Kalahari Game Reserve, Botswana (Winterbach et al., Reference Winterbach, Maude, Neo-Mahupeleng, Klein, Boast, Rich and Somers2017; Fig. 2). The highest recorded densities are from reserves in Namibia (Okonjima Nature Reserve; Edwards et al., Reference Edwards, Noack, Heyns and Rodenwoldt2019), South Africa (Kwandwe Nature Reserve; Welch & Parker, Reference Welch and Parker2016), and the central Tuli block, Botswana (Vissia et al., Reference Vissia, Wadhwa and van Langevelde2021). These far exceed our density estimate (Supplementary Table 2), although assumptions about fence permeability may account for some of these differences (Williams et al., Reference Williams, Williams, Welch, Marneweck, Mann and Pitman2021). Although there are challenges in comparing density estimates given some of the methods used (occupancy models and track counts; Balme et al., Reference Balme, Hunter and Slotow2009; Rich et al., Reference Rich, Kelly, Sollmann, Noss, Maffei and Arispe2014; Rogan et al., Reference Rogan, Balme, Distiller, Pitman, Broadfield and Mann2019), our densities are similar to brown hyaena densities in similar habitats where spatial capture–recapture methods have been used (Williams et al., Reference Williams, Williams, Welch, Marneweck, Mann and Pitman2021; Fig. 2, Supplementary Table 2).
Contrary to our expectations, the density of 3.6–3.7 civets per 100 km2 is lower than other recorded densities (Fig. 2), although within the range of densities from three sites in the Waterberg Biosphere Reserve (Isaacs et al., Reference Isaacs, Somers, Swanepoel, Do Linh San, Sato, Belant and Somersin press). Higher densities recorded in South Africa (Amiard, Reference Amiard2014) and Botswana (Rich et al., Reference Rich, Miller, Muñoz, Robinson, McNutt and Kelly2019) suggest that civets may be subject to significant anthropogenic pressure in our study area.
Several factors may be driving carnivore population densities. Unlike previous studies that were predominantly in protected areas, the Blouberg Ward 20 region within which our study was conducted had a human population of 240 people per 100 km2 (Statistics South Africa, 2011), and there was frequent traffic such as crop and livestock transportation, and movement of agricultural vehicles. Roads may have negative impacts on wildlife habitat use and cause habitat loss, fragmentation and degradation (van der Ree et al., Reference van der Ree, Jaeger, van der Grift and Clevenger2011; Shannon et al., Reference Shannon, Angeloni, Wittemyer, Fristrup and Crooks2014). The high human population and associated anthropogenic disturbances may be negatively affecting carnivore survival and space use in our study area, and could explain the lower than expected densities of the four study species. Moreover, carnivores are persecuted where they compete for wild prey (Pitman et al., Reference Pitman, Fattebert, Williams, Williams, Hill and Hunter2017b) or livestock (Constant et al., Reference Constant, Bell and Hill2015) with humans, and in areas where there is a lack of inexpensive protein substitutes for people, carnivores may be affected by bushmeat poaching activities (Lindsey et al., Reference Lindsey, Balme, Becker, Begg, Bento and Bocchino2013; Rogan et al., Reference Rogan, Lindsey, Tambling, Golabek, Chase and Collins2017).
Fencing has been widely used in South Africa to protect livestock and game species from carnivores, creating barriers that impede movement and ranging behaviour, contributing to habitat fragmentation, and influencing long-term survival of carnivore populations (Cozzi et al., Reference Cozzi, Broekhuis, Mcnutt and Schmid2013). In our study area most of the properties are fenced. Although we recorded multiple recaptures of the same individuals at different camera-trap stations, demonstrating that movement between fenced properties does occur, carnivore densities may still be negatively influenced by the impediment to movement imposed by fencing.
Carnivore densities are also related to the abundance and biomass of prey (Hayward et al., Reference Hayward, O'Brien and Kerley2007). Even though game farming may provide increased hunting and scavenging opportunities for carnivores it may also be detrimental for their conservation, especially where carnivore species compete with people for prey (Pitman et al., Reference Pitman, Fattebert, Williams, Williams, Hill and Hunter2017b). Higher densities of brown hyaenas on cattle farms than in neighbouring protected areas (Kent & Hill, Reference Kent and Hill2013) may be a result of scavenging opportunities from larger predators in these areas or of livestock mortalities, possibly related to disease (Maude & Mills, Reference Maude and Mills2005). Three of our study species are known to scavenge (spotted hyaenas: Cooper et al., Reference Cooper, Holekamp and Smale1999; brown hyaenas: Faure et al., Reference Faure, Holmes, Watson and Hill2019; African civet: Daniel et al., Reference Daniel, Eniang, Bekelle, Balakrishnan and Egwali2008), and the leopard, although not characterized as a scavenger, may take advantage of opportunities to scavenge (Hayward et al., Reference Hayward, Henschel, O'Brien, Hofmeyr, Balme and Kerley2006). Thus, the agricultural matrix appears to present both opportunities and threats for carnivores.
There are several caveats to our research. We assumed that all home range centres within the state space were suitable habitat, but some areas may be more suitable than others (e.g. the small ecotourism reserve vs crop farming areas with more human activity). Spatial capture–recapture models assume there is a decline in detection probability with increasing distance between the detector and an animal's home range centre (Kery & Royle, Reference Kery and Royle2016). However, heterogeneity in an animal's use of space may be a further source of variation in detection probability, and failure to account for this may bias density estimates (Efford, Reference Efford2014); our study did not account for any heterogeneity in animal space use or test for any significant influence of this. Our study area is subject to higher human activity during the day, from agricultural practices, than at night, which could affect the times when carnivores were detected (Gaynor et al., Reference Gaynor, Hojnowski, Carter and Brashares2018). However, as the four carnivore species are nocturnal, and our sampling occasions incorporated the full duration of the night (overcoming the so-called midnight problem; Jordan et al., Reference Jordan, Barrett and Purcell2011), we assumed that human activity did not affect the detection process within a spatial capture–recapture framework, but this assumption may not hold for other systems.
Although the estimates of the density of our four study carnivore species were lower than estimates for protected areas, our research highlights the potential value of the agricultural matrix for biodiversity conservation. The majority of data available on population sizes and trends of carnivores are for protected areas (Swanepoel et al., Reference Swanepoel, Somers and Dalerum2015), an issue that could bias conservation strategies. Human-dominated and altered landscapes can have negative effects on some wildlife populations (Ramesh & Downs, Reference Ramesh and Downs2015), and there is evidence of human pressure on the carnivore populations in Platjan (D. Cilliers, unpubl. data). Nevertheless, our findings demonstrate that people and carnivores can coexist in shared landscapes, and therefore the agricultural community could potentially play an important role in carnivore conservation.
Acknowledgements
We thank Earthwatch through the Neville Shulman Award, and Nelson Mandela University, for funding; Marc Engler, Annie Casey, Nadine-Josie Holmes, Jessica Jones, Chris Duff, Anasthasia Sanchez De Launay, Maya Broadbank, Sarah Marsh, Max Hargreaves, Aaron Eastwood, and Joe Jacobs for assistance with camera-trap image classification and fieldwork; Platjan landowners for permission to access their properties; Markus Jebsen, Riley De Charmoy Bouchet, Syanne Kirby, and the Limpokwena Nature Reserve for their hospitality during data collection; and a reviewer and the Editor for their constructive feedback.
Author contributions
Study design, fieldwork: JPBF, RAH; data analysis: JPBF, RAH, LHS; writing: JPBF, RAH, LHS, JAV, DC.
Conflicts of interest
None.
Ethical standards
This research abided by the Oryx guidelines on ethical standards. Permission was obtained from all landowners to conduct camera-trap research on their respective properties, and, according to Nelson Mandela University's ethical criteria, the research design did not require approval.


 Open access