


Introduction
Invasions by exotic species have been cited as one of the leading causes of environmental change and decreases in biodiversity (Vitousek et al. Reference Vitousek, D’Antonio, Loope and Westbrooks1996). Pimentel et al. (Reference Pimentel, Zuniga and Morrison2005) estimated that nonindigenous species in the United States cause damages of $137 billion annually, with nonnative plants making up $34 billion of that cost. On rangelands, these economic impacts are associated with livestock production; in particular, noxious weeds reduce yield and quality of forage and can poison livestock (DiTomaso Reference DiTomaso2000). In addition, landowners incur expenses when they implement noxious weed management strategies aimed at limiting weed invasions or managing current infestations (Olson Reference Olson1999). Overall, reductions in rangeland carrying capacity for livestock and increases in operating and management costs lead to reduced land value (Olson Reference Olson1999).
Box 1 Management Implications
Using livestock producer survey data and empirical weed impact data, we estimated the direct economic impacts of noxious weeds on privately owned rangeland in Montana. We estimated the average economic loss, including both the costs of control and lost forage to be $3.54 ha−1 yr−1, or $7,243 annually, for the average grazing unit in Montana (i.e., 2,046 ha [5,055 ac]). These costs are likely a lower bound on true costs, because we considered only direct costs; indirect costs, such as reduced economic activity associated with lower livestock production–based revenue, have often been included in other noxious weed economic impact assessments. The most commonly reported noxious weeds were Canada thistle [Cirsium arvense (L.) Scop.], leafy spurge (Euphorbia esula L.), and houndstongue (Cynoglossum officinale L.), while E. esula, C. arvense, and both spotted and diffuse knapweed (Centaurea stoebe L. and Centaurea diffusa Lam.) were reported as causing the largest decreases in livestock production. The top three strategies used to control established noxious weeds were chemical control, grazing, and biological control. Survey respondents estimated about 12% of their land is covered with noxious weeds, indicating noxious weeds are a common problem in Montana. Spending time and money on noxious weed management reduces household income, retail trade, and agricultural crop production, thus magnifying the direct economic impacts that we evaluated in our study.
Information on the environmental, economic, and societal losses caused by invasive plants is scarce, and the economic impacts of most noxious weeds are poorly documented (Duncan et al. Reference Duncan, Jachetta, Brown, Carrithers, Clark, DiTomaso, Lym, McDaniel, Renz and Rice2004). The state of Oregon conducted an initial analysis of economic losses due to 21 noxious weeds in 2000, and updated the analysis to include impacts from 25 noxious weeds in 2014. The estimated annual loss was about $83.5 million in personal income, with Himilayan blackberry (Rubus armeniacus Focke) and Scotch broom [Cytisus scoparius (L.) Link] accounting for nearly 95% of the loss (Research Group Reference Research Group2014). A recent analysis in the state of Washington estimated the direct economic impact of noxious weeds on the livestock industry to be about $120 million annually (Community Attributes, Inc. [CAI] 2017).
Hirsch and Leitch (Reference Hirsch and Leitch1996) conducted an in-depth economic analysis of the economic impacts of spotted, diffuse, and Russian knapweed [Centaurea stoebe L., Centaurea diffusa Lam., and Rhaponticum repens (L.) Hidalgo] in Montana. Using published data and a survey of county weed boards, they estimated the direct negative impacts of knapweeds on rangelands and wildlands amounted to more than $14 million annually. Combined direct and secondary economic impacts were estimated at $42 million annually. Direct economic impacts included reductions in personal income, livestock production, wildlife-associated recreation, and soil and water conservation (Hirsch and Leitch Reference Hirsch and Leitch1996). These direct impacts can have secondary impacts on the economy; for example, reduced grazing capacity can affect household income, which in turn can affect local and retail trade (Hirsch and Leitch Reference Hirsch and Leitch1996). In another study, Leitch et al. (Reference Leitch, Leistritz and Bangsund1996) used published data to assess the economic impact of leafy spurge (Euphorbia esula L.) on grazing land and wildlands in Montana, Wyoming, North Dakota, and South Dakota. Combined direct and secondary impacts for the four-state region were about $129 million annually, and for Montana, the impacts were estimated to be about $18.6 million.
Efforts to contain or reduce existing infestations and prevent new infestations hinge on a clear understanding of what is being lost due to weeds—for example, livestock forage production—and what is being spent to control weeds. Our study combined social science and empirical field data to focus on the economic impacts of noxious weeds on privately owned rangeland in Montana. More specifically, we estimated economic losses due to noxious weeds by using data obtained from a survey that measured perceptions of livestock producers and empirical models that quantified impacts of noxious weeds on forage production.
Materials and Methods
In spring 2015, we developed a 16-question survey concerning noxious weed management and associated costs. The target audience for the survey was livestock producers who were grazing their livestock on privately owned or privately leased rangeland in Montana. The survey was publicized and distributed online, with hard copies available as requested through agricultural extension faculty at Montana State University (MSU) and contacts at the Montana Stock Growers Association (MSGA) and Montana Wool Growers Association (MWGA) from November 17, 2015, to February 2, 2016. Additionally, the survey was administered at booths during the MSGA and MWGA meetings in December 2015. A link to the survey was also included in the MSU Extension Cow Sense Chronicle, an online newsletter.
The survey pertained to the largest contiguous block of privately owned or leased land on which respondents grazed livestock, referred to here as an “average grazing unit.” Survey questions measured perceptions of livestock producers and covered topics such as noxious weed presence and abundance; noxious weed management strategies; cost of noxious weed control, including materials and labor; and views of noxious weeds (Supplementary Material). Survey participation was voluntary, and respondents could choose not to answer individual questions. Because some respondents did not answer all questions, sample sizes varied among questions.
Our estimate of the economic impacts of noxious weeds was based on costs of materials and labor associated with controlling noxious weeds and foregone production due to noxious weeds. Respondents were asked to estimate material costs associated with controlling noxious weeds with various management strategies on their average grazing unit. Labor costs were estimated based on hours respondents (including family members and/or employees) reported managing noxious weeds on an average grazing unit. We used the Montana average labor rate for farmworkers who work with animals (e.g., ranchers) of $12.54 h−1 (U.S. Bureau of Labor Statistics 2015). Based on the average size of respondents’ largest grazing units, we calculated the average cost per hectare of both materials and labor. The average cost per hectare was calculated as the sum of costs divided by the total number of hectares reported by respondents.
To quantitatively estimate noxious weed impacts on forage production, we combined our survey data on percent cover of noxious weeds with output from empirically based weed impact models developed for E. esula and C. stoebe. The E. esula model is described by Rinella and Luschei (Reference Rinella and Luschei2007). This model has two components, one that estimates E. esula biomass per unit area on infested sites, and another that estimates how forage production per unit area is impacted by a given biomass of E. esula. We re-parameterized the E. esula model with C. stoebe data to develop a C. stoebe model with the same two components. To develop the component that estimated C. stoebe biomass per unit area on infested sites, we used C. stoebe biomass data from 10 study sites reported in the literature (Jacobs and Sheley Reference Jacobs and Sheley1999a, Reference Jacobs and Sheley1999b; Rice et al. Reference Rice, Toney, Beduna and Carlson1997; Sheley et al. Reference Sheley, Jacobs and Martin2004; Story et al. Reference Story, Boggs, Keith and Graham1989; Thrift et al. Reference Thrift, Mosley, Brewer, Roeder, Olson and Kott2008). To develop the component that estimated how forage production per unit area is impacted by a given biomass of C. stoebe, we used data from three studies. One study quantified impacts of C. stoebe on forage production by applying or not applying herbicides to field plots on grasslands and early successional forests (Rice et al. Reference Rice, Toney, Beduna and Carlson1997). The other studies quantified C. stoebe impacts by planting or not planting this species in plots supporting forage species in a fallow field (Maron and Marler Reference Maron and Marler2008) or on rangelands (Rinella et al. Reference Rinella, Pokorny and Rekaya2007).
To estimate forage losses caused by C. stoebe and E. esula within respondents’ individual grazing units, we multiplied the model predictions of percent forage reductions by the percentage of the grazing unit infested by these noxious weeds for respondents with C. stoebe or E. esula present on their properties, as well across all respondents (including those without either weed). Then we estimated the corresponding average reduction in stocking rates (i.e., foregone production), assuming a 50% utilization rate by livestock (i.e., livestock would remain in the grazing unit until they consumed half the current year’s forage production) (Holechek et al. Reference Holechek, Pieper and Herbel1989). Next, we estimated the resulting value of foregone lease revenue using a range of stocking rates of 0.49 to 0.82 animal unit months (AUMs) ha−1 (0.20 to 0.33 AUM ac−1) (J Mosley, MSU Extension Range Management Specialist, personal communication). We calculated the value of foregone lease revenue by multiplying each lower and upper stocking rate by our estimates of foregone production and by the inflation-adjusted 5-yr (2011 to 2016) average lease rate in Montana of $21.96 AUM−1 (National Agricultural Statistics Service [NASS] 2017). To translate our monthly estimates of foregone lease revenue due to C. stoebe and E. esula into annual estimates, we assumed a 9-mo grazing season, given that at least 3 mo of winter feeding is typical for livestock production systems in Montana. To summarize, we estimated the value of the foregone production as the reduction in animal units per acre, multiplied by the value of those animal units for the months the animals would have been on pasture. We calculated the foregone production as estimated percent forage loss (discussed in the “Results and Discussion” section), multiplied by the utilization factor (0.5), multiplied by the stocking rate (0.49 to 0.82 ha−1). The total value of an animal unit for the 9-mo grazing season was the AUM value ($21.96) multiplied by the number of months on pasture (9).
Results and Discussion
Describing Rangeland Managers and Managed Land
We received 182 survey responses from 45 counties within Montana. Our results pertain to 129 respondents who indicated they managed livestock. The average size of livestock managers’ largest grazing units, the units we focused on in our study, was 2,046 ha. Respondents who grazed on privately owned land (71% of respondents) reported an average of 2,167 ha, while those who leased land (29% of respondents) averaged 2,057 ha; most respondents used a combination of privately owned and leased land. The majority of respondents were solely responsible for noxious weed management on their average grazing units (74%), while others shared responsibility (18%) or were not responsible at all (8%) (n=115). For respondents using privately leased land, 40% indicated the lease included agreements about noxious weed management or control, while 60% did not (n=57). Cattle were the most frequently used grazing animal (88% of respondents), while sheep (29%), horses (23%), and goats or other animals (<4%) were also used.
Noxious Weed Presence and Abundance
Respondents were divided fairly equally on whether noxious weeds on the average grazing unit have increased (30%), decreased (33%), or remained the same (31%) over the last 5 yr; approximately 5% reported that they did not know. The top three noxious weeds reported as present were (1) Canada thistle (C. arvense (L.) Scop.) (64% of respondents), (2) E. esula (45% of respondents), and (3) houndstongue (Cynoglossum officinale L.) (39% of respondents) (n=114) (Figure 1). Only 6% reported having no noxious weeds on their grazing units. Respondents were also asked to estimate the percent of their grazing unit that was “covered” by noxious weeds. The total, respondent-estimated cover of grazing units by noxious weeds (regardless of species) was 32,266 ha or roughly 12% of total grazing unit area represented in the survey. The Montana Department of Agriculture estimated that about 9% of Montana land is infested with noxious weeds (Montana Department of Agriculture 2017), slightly lower than our survey results but still reasonably similar considering the uncertainty that accompanies such estimates and landowners’ perceptions of weed cover. In terms of specific species’ cover estimates, (1) St. Johnswort (Hypericum perforatum L.), (2) Russian knapweed [Rhaponticum repens (L.) Hidalgo], and (3) yellow toadflax (Linaria vulgaris Mill.) were reported as having the highest average cover (Figure 1). However, in terms of effect, (1) E. esula, (2) C. arvense, and (3) C. stoebe and/or C. diffusa were reported as causing the largest decrease in livestock production (Figure 2). Sheley et al. (Reference Sheley, Jacobs and Floyd1996) found that C. stoebe, E. esula, and C. arvense were most commonly named when the general population in Montana was surveyed and asked to name two most damaging noxious weeds in the state. In terms of perceived impact, these three species remain high on the list across time and across sectors of the Montana population.
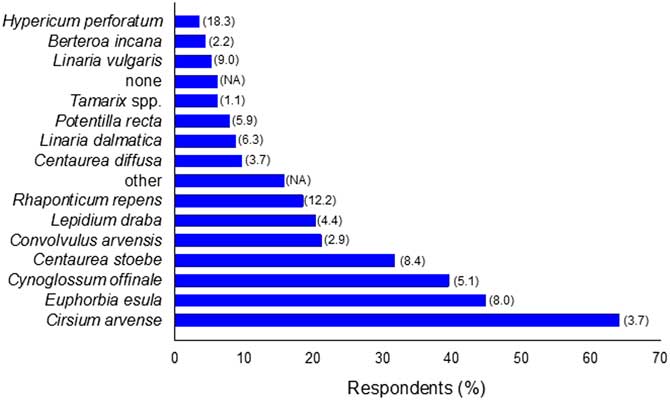
Figure 1 Percentage of respondents reporting a noxious weed species on their average grazing units (n=114). Number in parentheses to right of each bar is the respondent-estimated average cover of each species. Average cover is based on the total respondents reporting the presence and cover value of the specific weed.
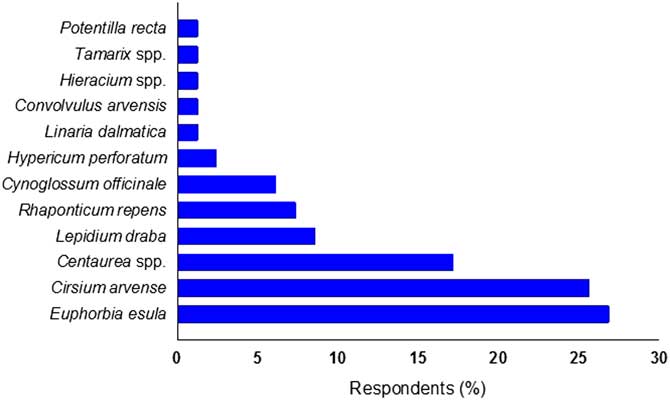
Figure 2 Percentage of respondents reporting a noxious weed species as causing the largest decrease in livestock production on their average grazing unit (n=82). The “knapweed” label refers to either Centaurea stoebe or Centaurea diffusa.
Noxious Weed Management Strategies
The top three strategies used to manage established noxious weeds by livestock producers represented in our survey were (1) chemical control, (2) grazing, and (3) biological control (Table 1). Our respondents’ top management strategy, chemical control, is the primary method of weed control in most rangelands (DiTomaso Reference DiTomaso2000). Similarly, chemical control is the most studied management strategy, according to a recent meta-analysis of invasive plant control methods (Kettenring and Adams Reference Kettenring and Adams2011). The popularity of grazing and biological control reported here (28% and 26%, respectively) is in contrast to a survey of landowners from two rural valleys in western Montana where fewer than 10% grazed sheep or goats or used biological control insects (Yung et al. Reference Yung, Chandler and Haverhals2015). However, the majority of landowners in Yung et al. (Reference Yung, Chandler and Haverhals2015) were small-parcel owners (9 to 20 ha) compared with our survey respondents’ average grazing unit size of 2,046 ha. The most commonly used strategies in that same study were hand pulling, spraying chemicals, or mowing (greater than 70% of respondents) (Yung et al. Reference Yung, Chandler and Haverhals2015). Our survey determined that 46% of respondents used more than one control strategy (i.e., integrated weed management). Approximately 7% reported using no management strategies to control established noxious weeds. This is lower than survey results from Yung et al. (Reference Yung, Chandler and Haverhals2015), who determined that 22% of rural landowners do not control weeds.
Table 1 Respondent-reported use of noxious weed management strategies and associated costs on privately owned or leased grazing land in Montana.
a Excluding labor costs. Sample size included in parentheses.
Costs of Noxious Weeds
Costs of Management Strategies
Respondents conducting noxious weed management estimated spending $1.61 ha−1 yr−1 on materials (n=102). When examining individual management strategy costs as perceived by livestock producers in our study, grazing was highest, at an average of $3.88 ha−1 (Table 1). Average cost per hectare was $0.77 for chemical control, $0.37 for mechanical control, and $0.07 for biological control. These averages are based on the respondents who used that specific strategy and reported an associated cost. Included in these averages are 22 instances in which respondents reported using a certain strategy, but with a cost of $0 (mechanical control, biological control, grazing, and seeding). We believe at least some of these are cases in which extension agents, county weed coordinators, or others are providing this service free of charge to the rangeland manager (e.g., biological control insects) or rangeland managers already had access to the animals or equipment needed to conduct that strategy. On the other hand, some averages may be inflated due to a small number of respondents reporting a very high cost for a specific management strategy relative to what other respondents reported for the same management strategy. For example, three respondents estimated spending from $12.36 to $16.85 ha−1 on grazing, while estimates from other respondents who used grazing ranged from $0 to $8.23 ha−1.
Respondents estimated spending 0.05 h ha−1 (0.02 h ac−1) on noxious weed management in 1 yr, which equates to a cost of $0.63 ha−1 yr−1, or $1,294 annually for the average grazing unit (n=71). Notably, this average includes individuals who reported spending 0 h managing weeds. The total cost of noxious weed control, including materials and labor, averaged $2.24 ha−1 yr−1, or $4,583 annually for the average grazing unit.
Costs of Lost Forage Due to C. stoebe and E. esula
For the percent annual reduction in forage for respondents with C. stoebe or E. esula on their properties (n=34 and n=50, respectively), the models estimated a 2.7% (95% CI, 2.1% to 3.2%) reduction from the presence of C. stoebe and a 2.0% (95% CI, 1.1% to 3.0%) reduction from E. esula, or a total estimate of 4.7% loss across both species. Accordingly, the value of foregone production is estimated between $2.28 and $3.81 ha−1 yr−1 across both species or between $4,665 and $7,795 annually per grazing unit using our range of stocking rates.
For the percent annual reduction in forage across all 114 respondents, which included 84 respondents who reported C. stoebe and/or E. esula plus 30 respondents who reported having other noxious weeds, the models estimated an average forage loss of 0.8% (95% CI, 0.6 to 1.0) from C. stoebe and 0.8% (95% CI, 0.5 to 1.3) from E. esula across all grazing units of our study. Using the estimate of total annual loss of 1.6% for the full sample, the value of foregone production is estimated between $0.77 and $1.30 ha−1 yr−1, or between $1,575 and $2,660 annually per grazing unit using our range of stocking rates. We used the midpoint of these two values ($1.04 ha−1 yr−1 over all respondents) in the following calculation of total costs.
Total Costs
Combining management costs with foregone production costs due to C. stoebe and E. esula, we estimated the total economic loss due to noxious weeds to be $3.54 ha−1 yr−1, or $7,243 annually for the average grazing unit. Our estimates are clearly a lower bound on true costs for several reasons. First, while we estimated forage production losses for two of the three weeds reported as causing the largest decrease in livestock production, we were unable to estimate forage reductions for the third most commonly reported weed, C. arvense, and other weeds for which we lack models. Additionally, the average cost includes individuals reporting that they do not have noxious weeds and therefore do not experience losses.
Our estimates of economic loss due to noxious weeds on a per-unit area basis are lower than most estimates of previous studies (e.g., CAI 2017; Hirsh and Leitch 1996; Leitch et al. Reference Leitch, Leistritz and Bangsund1996; Research Group Reference Research Group2014). For example, Hirsh and Leitch (1996) estimated direct impacts of C. stoebe and C. diffusa on infested grazing lands in Montana at $26.27 ha−1 yr−1, nearly eight times higher than our estimates. In addition to specific reasons stated earlier regarding management costs and costs of forage loss, our study used responses from a relatively small sample of individuals, who undoubtedly have different levels of knowledge and perceptions about the rangeland they manage, noxious weed identification, and corresponding effects on production. Future studies could be improved upon by using a probability approach (one that involves randomization) for determining a sample population. Given the budget constraints in this initial survey, we were limited in our sampling techniques, as probability sampling is typically much more expensive. We did take steps to reduce sampling bias. For example, we did not send our survey to any noxious weed–related lists or hold booths at any conferences with a noxious weed focus out of concern that such sampling could bias estimates of noxious weed occurrence and costs upward.
Many other studies (e.g., CAI 2017; Hirsh and Leitch 1996; Leitch et al. Reference Leitch, Leistritz and Bangsund1996; Research Group Reference Research Group2014) also considered secondary impacts or “multiplier effects” of noxious weed presence, which we did not estimate. These secondary impacts measure changes in economic activity as money circulates within an economy and can increase estimates of economic losses substantially. For example, if noxious weeds reduce a rancher’s revenue, the rancher may have less money to spend in town, which would produce the secondary effect of reduced revenue to local businesses. We chose to focus on first-round, direct effects, which are more easily defined and estimated. Nonetheless, our estimates are substantial. To put them in perspective, the (inflation-adjusted) average lease rate for Montana pasture land over the last 5 yr is $15.00 ha−1 (NASS 2017). Our estimated total economic cost of noxious weed presence in Montana ranges was $3.54 ha−1, or roughly 24% of that rate.
Acknowledgments
We are grateful to county extension agents and weed coordinators Mike Schuldt, Darren Crawford, Jerry Marks, Steve Lackman, Brent Roeder, and Bryce Christiaens, as well as Keri Hayes, Anton Bekkerman, Rachel Endecott, Ryan Goodman, Whit Stewart, and the survey participants. Thank you to Celestine Duncan and the anonymous reviewers for feedback on an earlier version of this article. This project was supported with funding from the Montana Noxious Weed Trust Fund (grant #2015-006).
Supplementary Material
To view supplementary material for this article, please visit https://doi.org/10.1017/inp.2018.10


