


In 2019, an estimated 463 million adults were living with diabetes worldwide and the prevalence is expected to increase to 700 million by 2045(1). Roughly, nine out of ten diabetes cases worldwide are of type 2. The estimated global health expenditure due to diabetes is currently about 760 billion US dollars annually.
Diet is one of the main modifiable risk factors for type 2 diabetes, due to its effect on post-prandial glucose levels, insulin resistance and obesity(Reference Augustin, Kendall and Jenkins2). Dietary carbohydrates have long been predicted to be associated with risk of type 2 diabetes; however, the metabolic effect differs between different carbohydrates and carbohydrate-rich foods. For example, a higher intake of sugar-sweetened beverages has been associated with greater risk of type 2 diabetes, while a higher intake of whole grains has been found to be protective(Reference Schwingshackl, Hoffmann and Lampousi3–Reference Ericson, Hindy and Drake5). Apart from these findings, however, most associations between carbohydrates and carbohydrate-rich foods with incident type 2 diabetes remain largely inconclusive(Reference Tsilas, de Souza and Mejia6,Reference Sluijs, Beulens and van der Schouw7) . For example, few studies have examined different sugars in relation to type 2 diabetes risk, and they have shown conflicting results(Reference Tsilas, de Souza and Mejia6,Reference Lean and Te Morenga8) . Similarly, evidence of a protective effect from vegetable and fruit intake is still inadequate(Reference Schwingshackl, Hoffmann and Lampousi3).
Studies on dietary carbohydrates are often focused on individual nutrients, for example, fibres and sugars, as well as foods and food groups with a high carbohydrate content(Reference Ley, Hamdy and Mohan9). Adapting a broad approach, studying the effects of multiple carbohydrates and carbohydrate-rich foods on health outcomes, can provide a better understanding of healthy dietary patterns. Findings from large-scale studies with long follow-up are needed to provide further evidence of the associations with type 2 diabetes risk(Reference Tsilas, de Souza and Mejia6,Reference Lean and Te Morenga8,Reference Zheng, Ley and Hu10) . The aim of this study was to analyse the associations between intake of different types of carbohydrates and carbohydrate-rich foods with incidence of type 2 diabetes in a large, prospective cohort of middle-aged and older adults in southern Sweden.
Methods
Population
The population in this study consists of participants in the Malmö Diet and Cancer Study, a prospective cohort study in southern Sweden (n 28 098). Recruitment and baseline examinations were carried out from January 1991 to September 1996 in men born between 1923 and 1945, and women born between 1923 and 1950, in Malmö, Sweden. The source population consisted of 74 138 individuals, and the recruitment was carried out through advertisements and invitation letters. The only exclusion criteria were limited Swedish proficiency and mental disability that prevented them from filling out the baseline questionnaire. The recruitment process of this study has been described in full detail elsewhere(Reference Manjer, Carlsson and Elmstahl11). Further exclusion criteria for this specific study were prevalent diabetes at baseline (n 1230), or missing data on physical activity, smoking habits or level of education (n 246). The total study population was thus 26 622 participants (61 % women). Ethical approval for the Malmö Diet and Cancer Study was granted by the Regional Ethics Committee (LU 90-51).
Baseline examinations
The participants visited the study centre on two occasions(Reference Berglund, Elmstahl and Janzon12). During their first visit, participants were introduced to the aim of the study and the different parts of the baseline examinations and gave their informed written consent. All participants had their blood pressure, height (to the nearest cm), weight (to the nearest 0·1 kg, without shoes and trousers), waist circumference and body fat percentage (with a bioelectrical impedance method) measured, and 45 ml blood samples were collected. They were asked to fill out a self-administered questionnaire, which collected information on level of education, occupation, physical activity, social network, smoking habits, alcohol consumption, current health, medical history, current medication and disease in close relatives. The participants were also instructed how to fill out a diet questionnaire and a food diary. During their second visit, generally 2 weeks later, the questionnaires were collected and checked for missing values and a diet interview was conducted.
A random 50 % sample of participants, who entered the study between November 1991 and February 1994 (n 12 445), were also invited to participate in a sub-cohort; the Malmö Diet and Cancer – Cardiovascular Cohort(Reference Hedblad, Nilsson and Janzon13). In the 5540 participants who accepted the invitation, additional blood analyses were conducted, including plasma glucose, insulin and HbA1c. Homoeostatic model assessment of insulin resistance was calculated with the following formula: fasting plasma insulin (mU/l) × blood glucose (mmol/l)/22·5.
Dietary assessment
The dietary assessment was conducted as part of the baseline examinations, using a validated, modified diet history method that consisted of three parts(Reference Riboli, Elmstahl and Saracci14,Reference Elmstahl, Riboli and Lindgarde15) : (1) Participants filled out a food diary for seven consecutive days, in which they recorded intakes of cooked meals (usually lunch and dinner meals), cold beverages and nutrient supplements. (2) The food diary was complemented by a 168-item FFQ, assessing the consumption frequencies and portion-sizes of regularly eaten foods that were not covered in the food diary. The reference period for the FFQ was the preceding year. (3) The dietary assessment was completed during a 60-min interview at the second visit. The purpose of the interview was to further assess food choices, portion-sizes and methods of cooking. Recipes for cooked meals registered in the food diary were identified through the interactive computer software KOSTSVAR (AIVO AB). Adjustments were made according to the information provided by the participant in the interview. There was also an option to create new recipes during the interview. The food diary and the FFQ were checked, according to pre-defined instructions, to ensure that the registered food consumption was not overlapping. In September 1994, the interview was shortened from 60 to 45 min as a result of slightly altered coding routines of dietary data. This adjustment was found to have no major impact on the ranking of participants(Reference Wirfalt, Mattisson and Johansson16). The modified diet history method was found to have good ranking validity compared with a reference method of 18 d weighed food records, with energy-adjusted Pearson correlation coefficients for carbohydrate intake of 0·66 and 0·70, for fibre intake of 0·74 and 0·69 and for sugar intake of 0·60 and 0·74, for men and women, respectively(Reference Riboli, Elmstahl and Saracci14,Reference Elmstahl, Riboli and Lindgarde15) .
Dietary data
Information on food intake in the food diary and the FFQ was summarised and recorded as average intake of g/d of individual foods. Extreme portion-sizes, as well as extreme and median values of total energy, nutrients and major food groups, were routinely attended to and checked for errors. Energy and nutrient intakes (including total carbohydrate, monosaccharides, disaccharides and sucrose) were calculated using the food composition database from the Swedish National Food Agency with about 1600 food items, with additional recipes and food codes added specifically for this cohort.
Variables on total carbohydrate, monosaccharide, disaccharide, sucrose and added sugar intake were expressed as percentage of the non-alcohol energy intake. Added sugar was calculated by adding all intake of sucrose and monosaccharides and then excluding the amount of sugars in fruits and vegetables (including juices)(Reference Ramne, Alves Dias and Gonzalez-Padilla17). Fibre was expressed as intake in g/4184 kJ (g/1000 kcal). Variables on intake of whole grains and refined grains combined the intakes of grains, cereals and bread and were expressed as servings/d. Servings were calculated using standard serving sizes from the Swedish National Food Agency: fibre-rich soft bread (50 g/serving), fibre-rich crisp bread (30 g/serving), breakfast cereals (25 g/serving), low-fibre soft bread (50 g/serving), low-fibre crisp bread (30 g/serving), pasta and rice (60 g dry product/serving). All other food variables were expressed as g/d: potato (boiled, baked and fried), fruits, vegetables, juice (from fruits and vegetables), sugar-sweetened beverages (all carbonated and non-carbonated beverages; except juices, dairy products and alcoholic beverages), table sugar (all sugar products added to foods and drinks after preparation), sweets (all sugar-sweetened candy, except chocolate), chocolate, ice cream, pastries (all sweetened baked goods) and marmalade/honey/jam (including apple sauce).
Covariate data
Leisure-time physical activity was assessed in the questionnaire as time spent per week on seventeen different activities. The activities were multiplied with their respective metabolic equivalent intensity factor, and the individuals were divided into five categories of metabolic equivalent of task hours (MET-hours) per week(Reference Mutie, Drake and Ericson18). Alcohol consumption was divided into six categories of reported intake (non-consumers and sex-specific quintiles of consumers), and smoking habits were divided into three categories: current smokers, former smokers and never smokers. Education was divided into six categories corresponding to the highest reported level of education achieved. Season was divided into four categories: winter (January–March), spring (April–June), summer (July–September) and fall (October–December). Diet method version was introduced as a variable with two categories (old and new) due to a minor adjustment of the coding routines of dietary data in September 1994. Potential misreporters of energy intake were defined as participants having a ratio of reported energy intake:BMR outside the 95 % CI of their calculated physical activity level, while diet changers were defined as participants who during baseline examinations reported that they had made substantial changes to their diet in the past(Reference Sonestedt, Wirfalt and Gullberg19,Reference Mattisson, Wirfalt and Aronsson20) .
Endpoint data
Participants with diabetes were identified through several different registers and rescreening of the cohort during the follow-up period (until 31 December 2016). The mean time of follow-up was 18·4 (sd 6·4) years. The Regional Diabetes 2000 Registry of Scania and the Swedish National Diabetes Register required a diagnosis by a physician, according to the established diagnostic criteria (a fasting plasma glucose concentration of ≥7·0 mmol/l, or a fasting whole blood concentration of ≥6·1 mmol/l, on two different occasions)(21,22) . Additionally, cases were identified through the HbA1c Registry at Clinical Chemistry, Malmö, of individuals with at least two HbA1c values ≥6·0 % and through four national registries managed by the National Board of Health and Welfare: the Cause-of-Death Registry, the Swedish Hospital-based Outpatient Care, the Swedish National Inpatient Registry (ICD10 codes E10-E14 and O244-O249) and the Swedish Prescribed Drug Registry (ATC code A10)(23–25). Cases were also identified through rescreening of sub-samples of participants in the Malmö Diet and Cancer Study cohort (1997–2001 and 2007–2012), as well as screening in the Malmö Preventive Project Cohort (2002–2006) with overlapping participants. We excluded cases with registered incident type 1 diabetes, latent autoimmune diabetes in adults, secondary diabetes and other diabetes conditions. The participants contributed person-time from date of enrolment until first occurrence of diabetes diagnosis, migration from Sweden, death or until the end of follow-up. In total, 4046 incident cases of type 2 diabetes (1936 men, 2110 women) were identified during 489 185 person-years of follow-up.
Statistical analysis
All statistical analyses were performed using IBM SPSS Statistics (version 24.0; IBM Corp.). Analyses were performed for total participants, as well as for men and women separately. The baseline characteristics of cases and non-cases of type 2 diabetes in men and women were analysed by applying the general linear model for continuous variables (adjusted for age, diet method version, season and energy intake, when applicable) and the χ 2 test for categorical variables. The Cox proportional hazard regression model was used to calculate hazard ratios (HR) of the association between type 2 diabetes incidence and quintiles of dietary intake, with the first quintile used as the reference. Due to a large proportion of non-consumers, the variables for juice, sugar-sweetened beverages and sweets were divided into non-consumers and tertiles of intake, with non-consumers used as the reference. Years of follow-up were used as the time-dependent variable. The covariates included in the model were chosen on the basis of known associations with type 2 diabetes from literature and were collected during baseline examinations. In the basic model, adjustments were made for sex, age (continuous), diet method version, season and total energy intake (continuous). The first extended model was further adjusted for physical activity, alcohol habits, smoking habits and education. The second extended model included further adjustment for BMI (continuous). The fully adjusted model added further adjustment for dietary covariates: coffee (continuous), meat (continuous), whole grains and sugar-sweetened beverages. Interaction for sex was calculated by adding an interaction term in the model, combining the dietary variable with the sex variable.
Several sensitivity analyses were conducted in order to confirm and explore the findings. First, analyses of the fully adjusted model were performed, excluding potential misreporters of energy in one analysis, and diet changers in the other. Second, in order to analyse the robustness of the sex-specific findings, new analyses of the fully adjusted model were performed after calculating the quintiles of intakes of nutrients and foods for men and women separately. Third, new analyses of all models with energy-adjusted dietary variables (in g/4184 kJ (g/1000 kcal)) were performed. Spearman correlation was used to investigate the degree of correlation between the dietary variables.
Results
Baseline characteristics
A larger proportion of male participants (18·8 %) than female participants (12·9 %) developed type 2 diabetes during 18 years of follow-up (Table 1). In both men and women, type 2 diabetes cases had a greater BMI, greater waist circumference and higher percentage of body fat, than non-cases. Type 2 diabetes cases were also more likely to report low physical activity and zero consumption of alcohol and were less likely to have a university degree, compared with non-cases.
Table 1. Baseline characteristics of participants in the Malmö Diet and Cancer cohort divided by cases and non-cases of type 2 diabetes (T2D) during follow-up*†
(Mean values and 95 % confidence intervals; numbers and percentages, n 26 622)
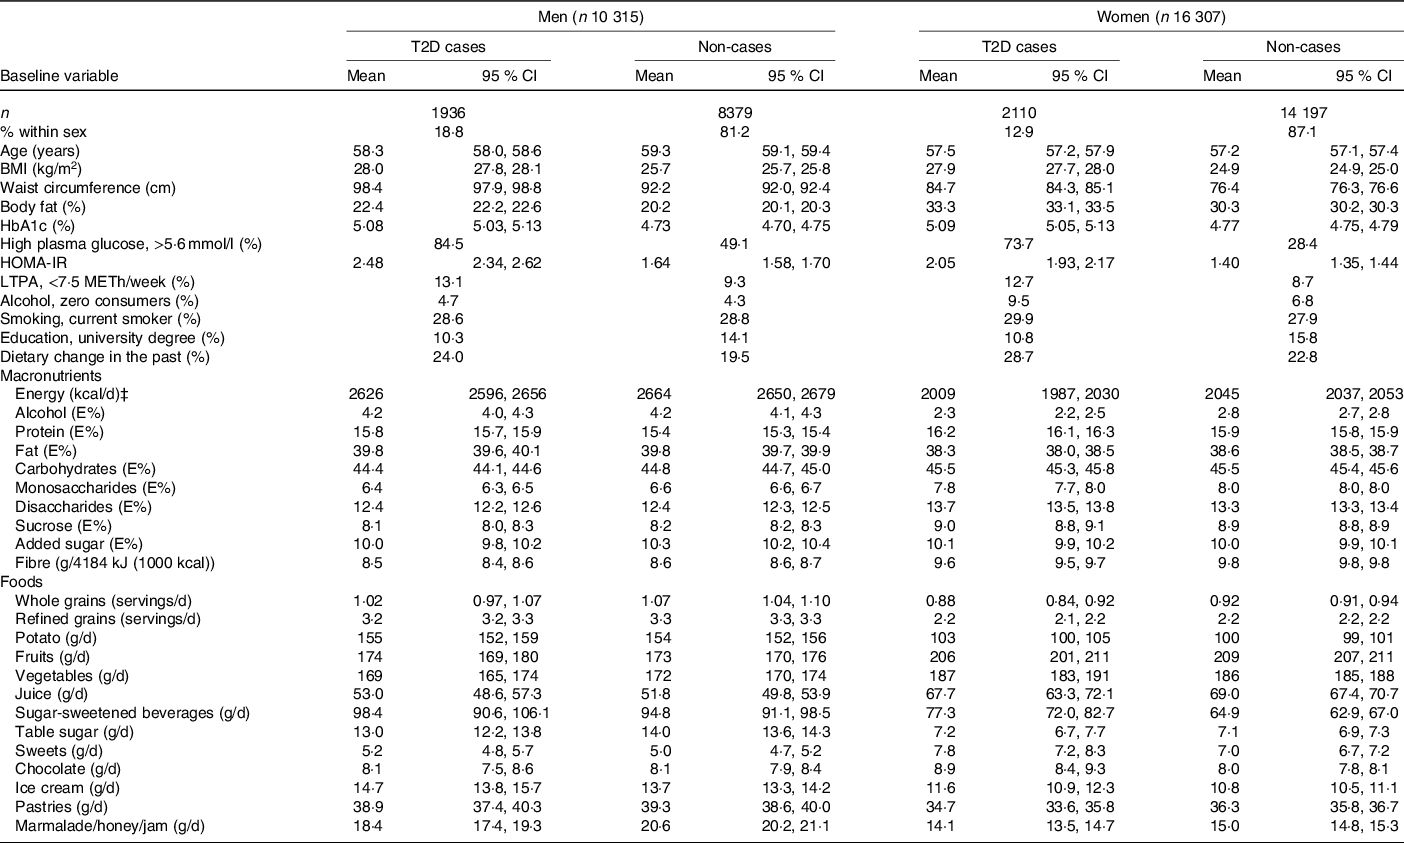
HOMA-IR, homoeostatic model assessment of insulin resistance; LTPA, leisure-time physical activity; METh, hours of metabolic equivalent of task; E%, percentage energy intake.
* A general linear model was used for continuous variables. Values are expressed in means and CI and were adjusted for age. Energy (kcal/d) was adjusted for age, diet method version and season. All other diet-related variables were adjusted for age, diet method version, season and energy intake. χ 2 was used for categorical variables, and values are expressed in percentages.
† n 26 587 for BMI, n 26 576 for waist circumference, n 26 468 for body fat, n 5046 for HbA1c, n 5045 for high plasma glucose, n 4654 for HOMA-IR and n 26 597 for dietary change in the past.
‡ To convert kcal to kJ, multiply by 4·184.
Associations between carbohydrates and type 2 diabetes
Total carbohydrate intake was not associated with risk of type 2 diabetes after adjusting for potential confounders (P trend = 0·30). While intake of monosaccharides was inversely associated with risk of type 2 diabetes (HR in the highest v. lowest quintile 0·88; 95 % CI 0·79, 0·98; P trend = 0·02), intake of disaccharides was positively associated with type 2 diabetes risk (HR 1·17; 95 % CI 1·04, 1·30; P trend = 0·002). Neither sucrose (P trend = 0·41) nor added sugar intake (P trend = 0·65) was associated with type 2 diabetes risk, although a significant inverse association was identified for added sugar before adjusting for BMI and diet (P trend < 0·001). Fibre intake was not associated with type 2 diabetes risk in the fully adjusted model (P trend = 0·77). However, an inverse association was identified in the basic model (HR 0·85; 95 % CI 0·76, 0·94; P trend < 0·001) (Table 2).
Table 2. Incident type 2 diabetes by quintiles (Q) of nutrients and foods in participants in the Malmö Diet and Cancer cohort
(Hazard ratios (HR) and 95 % confidence intervals; numbers and percentages, n 26 622)

E%, percentage of energy intake.
* Adjusted for sex, age, diet method version, season and total energy intake.
† Adjusted for sex, age, diet method version, season, total energy intake, physical activity, alcohol habits, smoking and education.
‡ Adjusted for sex, age, diet method version, season, total energy intake, physical activity, alcohol habits, smoking, education and BMI.
§ Adjusted for sex, age, diet method version, season, total energy intake, physical activity, alcohol habits, smoking, education, coffee, meat, whole grains (except for when whole grains were used as the main variable), sugar-sweetened beverages (except for when sugar-sweetened beverages were used as the main variable) and BMI.
|| P for interaction with sex.
¶ Divided into non-consumers and tertiles of consumers, with non-consumers as reference.
Associations between carbohydrate-rich foods and type 2 diabetes
There was a significant inverse association between intake of whole grains and type 2 diabetes risk before adjusting for dietary variables (P trend = 0·02), which was attenuated in the main model after adjustment (P trend = 0·07) (Table 2). For intake of refined grains, a tendency of an interaction with sex was identified (P interaction = 0·05); however, there were no significant associations in the fully adjusted model in neither men nor women (online Supplementary Table S1). No significant association was identified for potato intake with type 2 diabetes risk (P trend = 0·65) (Table 2). Intake of fruits, however, showed an inverse association with type 2 diabetes risk (P trend = 0·03). For vegetable intake, there was no significant association with type 2 diabetes risk overall (P trend = 0·75). Still, there was a tendency of an interaction with sex (P interaction = 0·06), with an inverse association in men (HR 0·85; 95 % CI 0·73, 0·98; P trend = 0·06) but not in women (HR 1·05; 95 % CI 0·91, 1·21; P trend = 0·28) (online Supplementary Table S1). No significant association was identified for juice intake with type 2 diabetes risk (P trend = 0·57) (Table 2).
Likewise, there was no significant association between intake of sugar-sweetened beverages and type 2 diabetes risk in the fully adjusted model (HR 1·05; 95 % CI 0·96, 1·14; P trend = 0·23). However, a significant positive association was identified before adjusting for BMI and diet (HR 1·14; 95 % CI 1·05, 1·25; P trend = 0·001). While there was a significant interaction for table sugar intake with sex (P interaction = 0·05), no associations were identified in neither men (HR 0·95; 95 % CI 0·83, 1·10; P trend = 0·87) nor women (HR 1·13; 95 % CI 0·96, 1·32; P trend = 0·32) (online Supplementary Table S1). Both intakes of sweets (P trend = 0·02) and chocolate (P trend = 0·04) were positively associated with type 2 diabetes risk (Table 2). An interaction with sex (P interaction = 0·001) was observed for chocolate, with a positive association in women (HR 1·26; 95 % CI 1·09, 1·46; P trend < 0·001) but not in men (HR 0·92; 95 % CI 0·80, 1·06; P trend = 0·37) (online Supplementary Table S1). There was no significant association for ice cream intake with type 2 diabetes risk (P trend = 0·79) (Table 2). For pastries, meanwhile, there was a tendency of an inverse association with type 2 diabetes risk (HR 0·92; 95 % CI 0·82, 1·02; P trend = 0·06). Furthermore, intake of marmalade/honey/jam was significantly and inversely associated with type 2 diabetes risk (HR 0·87; 95 % CI 0·78, 0·96; P trend < 0·001). However, there was also a significant interaction with sex (P interaction = 0·03), and after stratification, the association was observed in men only (HR 0·82; 95 % CI 0·72, 0·94; P trend < 0·001) (online Supplementary Table S1). There were modest to high correlations between several of the dietary variables included in the study (online Supplementary Table S2).
Sensitivity analysis
Excluding potential energy misreporters (18 % of the study sample) or diet changers (22 % of the study sample) did not influence the results substantially (online Supplementary Table S3). Similarly, using sex-specific quintiles of intakes of nutrients and foods for men and women did not alter the findings (online Supplementary Table S4). Moreover, using energy-adjusted food variables had no substantial influence on the results (online Supplementary Table S5).
Discussion
In this large cohort of middle-aged and older adults in southern Sweden, we identified several associations between carbohydrates and carbohydrate-rich foods with incident type 2 diabetes. Intakes of monosaccharides and fruits were inversely associated with type 2 diabetes risk, while intakes of disaccharides and sweets were positively associated. When stratifying for sex, intakes of vegetables and marmalade/honey/jam were inversely associated with type 2 diabetes risk in men, while intake of chocolate was positively associated in women. We also identified tendencies of inverse associations between intakes of pastries and of whole grains with type 2 diabetes risk. Intakes of carbohydrates, sucrose, added sugar, fibre, refined grains, potato, sugar-sweetened beverages, table sugar and ice cream were not significantly associated with incident type 2 diabetes after adjusting for potential confounders, including lifestyle, BMI and dietary factors.
The inverse association between intakes of monosaccharides with incident type 2 diabetes could be partly related to intake of fruits. We found a relatively strong correlation between intake of monosaccharides and fruits, and fruit intake was also found to be inversely associated with type 2 diabetes risk. However, the associations between fruit intake and type 2 diabetes risk are somewhat inconclusive in the scientific literature(Reference Schwingshackl, Hoffmann and Lampousi3,Reference Mamluk, O’Doherty and Orfanos26–Reference Li, Miao and Huang29) . In a meta-analysis published in 2017, the authors identified only a borderline inverse association for fruit intake with risk of type 2 diabetes(Reference Schwingshackl, Hoffmann and Lampousi3). The association was stronger in studies with longer follow-up (≥10 years), and there was a dose–response benefit with intakes of up to 200–300 g/d, with no additional benefit with higher intakes. In our study, the median intake in the highest quintile was 357 g/d, so we cannot conclude from the data in our population whether there is a threshold effect with higher intakes.
Our lack of overall association for vegetable intake with type 2 diabetes risk is similar to findings in meta-analyses by Mamluk et al. published in 2017(Reference Mamluk, O’Doherty and Orfanos26) and Cooper et al. published in 2012(Reference Cooper, Forouhi and Ye27). However, there is some evidence in the literature of a possible dose–response association with a decreased type 2 diabetes risk with intakes of up to 300 g/d(Reference Schwingshackl, Hoffmann and Lampousi3). In our study, we found a significant decreased risk in men only, with a median intake of 301 g/d in the highest quintile. Thus, as for fruits, we cannot determine whether there are additional benefits with higher intakes. In addition, since green leafy vegetables have been shown to have a protective effect in some studies(Reference Cooper, Forouhi and Ye27,Reference Li, Fan and Zhang28) , it might be of importance to study different vegetables separately.
Protective effects from fruits and vegetables are likely to be due to their low energy density and content of fibre and polyphenols, in particular flavonoids. A recent meta-analysis by Rienks et al. (Reference Rienks, Barbaresko and Oluwagbemigun30) found a non-linear inverse association with type 2 diabetes risk for both polyphenols and flavonoids, but concluded that more studies are needed. The association of fruit and vegetable intake with a reduced risk of other non-communicable diseases, as well as all-cause mortality, has already been well established(Reference Yip, Chan and Fielding31).
Sucrose and added sugar intake were not associated with risk of type 2 diabetes in this population. This could be explained by different associations with different foods high in sugar. While both sweets and chocolate were positively associated with type 2 diabetes risk (for chocolate in women only), some sugar-rich foods were inversely associated with risk of type 2 diabetes, that is, marmalade/honey/jam and pastries. For sugar-sweetened beverages, we identified positive associations in the models that excluded adjustment for BMI. Previous studies have shown conflicting results for different sugars in relation to type 2 diabetes risk, and it is believed that a potential increased risk may largely be due to sugars’ contribution to weight gain(Reference Tsilas, de Souza and Mejia6,Reference Lean and Te Morenga8) .
There is limited evidence of the association of chocolate intake with type 2 diabetes risk. While there may be an anti-diabetic effect of cocoa flavanols that could make the consumption of chocolate potentially protective against type 2 diabetes and is worth investigating further, most chocolates consumed contain low amounts of flavanols, are energy dense and have high amounts of sugar(Reference Rienks, Barbaresko and Oluwagbemigun30,Reference Ramos, Martin and Goya32–Reference Yuan, Li and Jin34) .
Associations between intake of marmalade, honey and jam with type 2 diabetes risk are not well-studied. In Sweden, jam and apple sauce are popular toppings on oatmeal, and other types of porridge, and may thus be indicative of an overall higher intake of whole grains. However, there was no strong correlation between intake of marmalade/honey/jam with intake of whole grains in our study, and we only observed a tendency of inverse association between whole grains and type 2 diabetes risk after adjusting for other dietary factors. Due to their low contribution to the overall diet, the inverse association for marmalade/honey/jam in our study could be due to covariance with other dietary variables or other residual confounding.
The tendency of an inverse association for intake of pastries with risk of type 2 diabetes in our study may be due to the social interaction associated with the Swedish tradition of consuming coffee and pastries during work breaks and leisure time. Social interaction and greater social networks have previously been associated with a lower risk of type 2 diabetes(Reference Hilding, Shen and Ostenson35–Reference Brinkhues, Dukers-Muijrers and Hoebe37).
Although we did not identify any association for sucrose intake and risk of type 2 diabetes, we did identify a positive association for intake of disaccharides. Hence, the positive association for disaccharides might instead be explained by intakes of maltose and lactose. These sugars, however, could not be studied independently in our study. They are also not known from the literature to be positively associated with type 2 diabetes risk. Maltose is mainly found in foods such as bread, breakfast cereals and alcoholic beverages (such as beer), while lactose is mainly found in dairy products. Intakes of milk, yoghurt and cheese, as well as of fibre-rich bread and cereals, and refined cereals, have previously been found not to be associated with type 2 diabetes risk in our cohort(Reference Ericson, Sonestedt and Gullberg38).
As previously mentioned, the inverse association for monosaccharides may be explained by the intake of fruits and is probably due to other nutrients in fruits. Whereas the scientific evidence for an association between dietary fructose and type 2 diabetes is inconclusive, there is some evidence of a possible inverse association for dietary glucose(Reference Tsilas, de Souza and Mejia6,Reference Biggelaar, Eussen and Sep39) . The associations between specific sugars and type 2 diabetes risk, however, necessitate further studies.
The non-significant findings regarding sugar-sweetened beverages and whole grains in our fully adjusted model differ from previous findings in our cohort, where significant positive and inverse associations were identified(Reference Ericson, Hindy and Drake5). This may be due to a longer follow-up time, a larger number of quantiles in the analyses, and food intakes being presented in absolute intakes per day in our study.
Strengths and limitations
The prospective design is a major strength that limits the risk of reverse causation and reduces selection bias in our study. The large cohort and the long follow-up time, resulting in a large number of type 2 diabetes cases, increased the ability to identify associations. Although the three-part diet method is of relatively high validity, this study relied on self-reported dietary data which was only collected at one point in time. In one of the sensitivity analyses, past diet changers were excluded. However, due to the long follow-up time, there may still be participants who have altered their diets over time. Furthermore, the risk of measurement error from misreporting is a well-known limitation in self-reported dietary data, leading to misclassification of exposure. Taking this into account, we performed another sensitivity analysis excluding misreporters of energy intake.
The extensive data on well-known possible confounders provided the ability to make ample adjustments in the fully adjusted model. We could show that several associations were attenuated after adjusting for confounders, most specifically after adjusting for BMI, indicating that associations between dietary factors and type 2 diabetes risk are often mediated by BMI. For example, intake of sugar-sweetened beverages was associated with incident type 2 diabetes in the basic and the extended model, but not in the models where BMI was included. However, the possibility of residual confounding due to unknown factors cannot be excluded.
Lack of available data on specific mono- and disaccharides, as well as sub-types of dietary fibre, meant that we could not study these in detail. Different types of dietary fibre have shown different associations with type 2 diabetes risk and through different pathways(Reference Weickert and Pfeiffer40). While our study did include whole grains, as well as some of the most common food sources for both soluble and insoluble fibres, we acknowledge that it would have been beneficial to study specific types of dietary fibre.
Furthermore, the large number of dietary variables and the extensive statistical analyses could have resulted in some significant findings occurring simply by chance. Due to the likelihood of extensive correlation between many of the dietary variables, it is also difficult to deduce the true causal effect of any singular nutrient or food on type 2 diabetes risk. This needs to be explored further, for example, by identifying and analysing dietary patterns of carbohydrate intake.
Conclusion
In our study, higher intakes of monosaccharides and fruits were associated with a lowered risk of type 2 diabetes, while higher intakes of disaccharides and sweets were associated with an increased risk. Higher intakes of vegetables and marmalade/honey/jam were associated with a lowered risk in men only, and a higher intake of chocolate with an increased risk in women only. The findings provide additional evidence on the associations between dietary intake of carbohydrates and carbohydrate-rich foods with risk of type 2 diabetes and contribute knowledge to future dietary recommendations on diabetes prevention.
Acknowledgements
The authors would like to thank all the Malmö Diet and Cancer Study participants.
The study was funded by the Swedish Research Council (2016-01501), the Swedish Heart-Lung Foundation (2016-0267 and 2019-0555) and the Albert Påhlsson Foundation. We also acknowledge the support provided by the Swedish Foundation for Strategic Research (IRC15-0067).
K. O. and E. S. formulated the aim and the design of the study; K. O. performed the statistical analysis, interpreted the findings and drafted the manuscript; E. S., S. R., E. G. P. and U. E. assisted in interpreting the findings and in critically assessing and revising the manuscript. All authors read and approved the final manuscript.
The authors declare that there are no conflicts of interest.
Supplementary material
For supplementary material/s referred to in this article, please visit https://doi.org/10.1017/S0007114520005140


 Open access