


INTRODUCTION
Quaternary environmental change on the Arabian Peninsula has been characterized by shifts between pronounced arid conditions and phases of increased rainfall, the latter caused by strengthening of monsoonal circulation (Burns et al., Reference Burns, Matter, Frank and Mangini1998, Reference Burns, Fleitmann, Matter, Neff and Mangini2001, Fleitmann and Matter, Reference Fleitmann and Matter2009). While during arid phases the landscapes of Arabia resemble desert environments dominated by transport and deposition of aeolian sand (Goudie et al., Reference Goudie, Colls, Stokes, Parker, White and Al-Farraj2000; Preusser, Reference Preusser2009; Atkinson et al., Reference Atkinson, Thomas, Goudie and Parker2012; Farrant et al., Reference Farrant, Duller, Parker, Roberts, Parton, Knox and Bide2015), the amount of precipitation during wetter phases was sufficient to support savannah vegetation with permanent lakes and wetlands (Rosenberg et al., Reference Rosenberg, Preusser, Fleitmann, Schwalb, Penkman, Schmid, Al-Shanti, Kadi and Matter2011, Reference Rosenberg, Preusser, Blechschmidt, Fleitmann, Jagher and Matter2012, Reference Rosenberg, Preusser, Risberg, Plikk, Kadi, Matter and Fleitmann2013; Parton et al., Reference Parton, White, Parker, Breeze, Jennings, Groucutt and Petraglia2015a, Reference Parton, Clark-Balzan, Parker, Preston, Sung, Breeze and Leng2018; Engel et al., Reference Engel, Matter, Parker, Parton, Petraglia, Preston and Preusser2017). Another feature reflecting hydroclimatic changes is the widespread occurrence of fluvial sediments (Maizels, Reference Maizels, Frostick and Reid1987; Maizels and McBean, Reference Maizels, McBean, Robertson, Searle and Reis1990). These are particularly extensive along the western Hajar Mountains (Fig. 1), however, the number of independently dated fluvial deposits in Arabia is low, often with large distances between sites and variation across spatial and temporal records (Anderson, Reference Anderson2007; Blechschmidt et al., Reference Blechschmidt, Matter, Preusser and Rieke-Zapp2009; McLaren et al., Reference McLaren, Al-Juaidi, Bateman and Millington2009; Parker, Reference Parker, Petraglia and Rose2010; Delagnes et al., Reference Delagnes, Tribolo, Bertran, Brenet, Crassard, Jaubert and Khalidi2012; Farrant et al., Reference Farrant, Ellison, Thomas, Pharaoh, Newell, Goodenough, Lee and Knox2012; Atkinson et al., Reference Atkinson, Thomas, Parker and Goudie2013; Parton et al., Reference Parton, Farrant, Leng, Schwenninger, Rose, Uerpmann and Parker2013, Reference Parton, White, Parker, Breeze, Jennings, Groucutt and Petraglia2015a; Hoffmann et al., Reference Hoffmann, Rupprechter, Rahn and Preusser2015; Matter et al., Reference Matter, Mahjoub, Neubert, Preusser, Schwalb, Szidat and Wulf2016). Furthermore, few attempts have been made in this region so far towards systematic tracing of fluvial dynamics from source to sink along entire fluvial (wadi) drainage systems. Understanding fluvial records and the interaction between fluvial and aeolian environments, however, requires consideration of surface processes that occurred during the late Quaternary, including patterns of debris supply, transport, and accumulation (Guba and Glennie, Reference Guba, Glennie, Ghazanfar and Fisher1998). These are profoundly influenced by bedrock lithology and structure, which determine the nature of debris supply and location accommodation space by which alluvial and fluvial systems form.

Figure 1. Location of the wider study region (A) and the Wadi Iddayyah and Wadi Dhaid catchments (B). Modern (blue lines) and paleo-drainages (dashed blue lines) are shown for the catchments of Wadi Iddayyah (delineated in red) and Wadi Dhaid (delineated in orange). White dashed lines denote the extent of the mountain front and bajadas. Regional paleofluvial (blue circles), speleothem (blue triangle), aeolian (red circles), paleosol (brown circle), and both paleofluvial and aeolian (red/blue circles) records and locations are shown as mentioned in the text: 1. Sabkha Matti; 2. Liwa; 3. Remah; 4. Sibetah; 5. Al Ain; 6. Hoti Cave; 7. Wadi Mistal; 8. Saiwan; 9. Al-Mamla, Wahiba; 10. Mohadeb; 11. Tawi Asmar; 12. Fallaj al Moalla; and 13. Aqabah.
The dating of fluvial records offers the possibility to detect changes in hydroclimate dynamics, including under arid conditions, that are not necessarily captured in speleothem records. The latter are terrestrial proxies that rely on sufficient rainfall (~350 mm of annual precipitation) to initiate growth (Vaks et al., Reference Vaks, Bar-Matthews, Matthews, Ayalon and Frumkin2010; Fleitmann et al., Reference Fleitmann, Burns, Pekala, Mangini, Al-Subbary, Al-Aowah, Kramers and Matter2011) and are compromised or absent during periods of increased aridity. As such, there is a considerable range of rainfall that remains undetectable from these records. Such levels of rainfall might be insufficient for the formation of particularly large water bodies and speleothem growth, yet capable of triggering the widespread activation of ephemeral drainage networks within the upper catchments (proximal), medial drainage areas, and lower (distal) end members.
Occupying an area of 600,000 km2, the Rub’ al-Khali is the largest sandy desert on Earth (Besler, Reference Besler1982; Goudie, Reference Goudie2002). While this region is largely characterized by aeolian dune systems, it also features an extensive paleo-drainage network (Edgell, Reference Edgell2006). Previous work on fluvial sediments, though limited in nature, provides some insights into the chronology of wadi activation and sediment deposition. In central Saudi Arabia, fluvial deposits were deposited during short-lived wetter periods at ca. 54, ca. 39, and ca. 0.8 ka (McLaren et al., Reference McLaren, Al-Juaidi, Bateman and Millington2009). Using a combination of radiocarbon and optically stimulated luminescence (OSL) dating, Matter et al. (Reference Matter, Mahjoub, Neubert, Preusser, Schwalb, Szidat and Wulf2016) demonstrated the presence of perennial streams and a permanent freshwater lake in the distal reach of the Dawasir drainage system in the Rub’ al-Khali desert region of Saudi Arabia, synchronous with fluvial accumulation in the headwaters of its major tributary, Wadi Tathlith. Increased runoff during the Early Holocene (10–6 ka) led to a re-activation of streams that largely followed pre-existing Pleistocene courses. In Wadi Sana, Yemen, Anderson (Reference Anderson2007) dated fluvial sediment deposition between 12 and 7 ka, with continued aggradation until ca. 5 ka.
In southeast (SE) Arabia, Atkinson et al. (Reference Atkinson, Thomas, Parker and Goudie2013) demonstrated that phases of alluvial and fluvial activation occurred in marine isotope stage (MIS) 5e (ca. 130–115 ka), 5a (ca. 90–76 ka), and the Early Holocene. The fluvial Hili Formation shows evidence for perennial river flow during MIS 5e and 5a, with channels up to 20 m across and water depths of at least 2 m. In addition, extensive accumulation of fan gravel occurred at the mountain front (Atkinson et al., Reference Atkinson, Thomas, Parker and Goudie2013; Farrant et al., Reference Farrant, Duller, Parker, Roberts, Parton, Knox and Bide2015; Parton et al., Reference Parton, Farrant, Leng, Telfer, Groucutt, Petraglia and Parker2015b) and apparently reaches back several 100 ka (Blechschmidt et al., Reference Blechschmidt, Matter, Preusser and Rieke-Zapp2009).
The aim of this study is to provide additional chronological data using OSL dating to further decipher the complex interplay of Quaternary alluvial, fluvial, and aeolian sedimentary systems in SE Arabia. However, OSL dating of fluvial sediments has been proven to be sometimes challenging due to the problem of partial bleaching (see Wallinga, Reference Wallinga2002; Rittenour, Reference Rittenour2008). In order to distinguish grains on aliquots that have been affected by partial bleaching, a statistical approach is used to identify the fraction of aliquots in which the signal was fully reset at the time of deposition for which a sufficient number of aliquots has to be measured (Galbraith and Roberts, Reference Galbraith and Roberts2012). This is an elaborate and time-consuming process, which can be significantly reduced by the application of a standardized growth curve (SGC) approach (Li et al., Reference Li, Roberts, Jacobs and Li2015, Reference Li, Jacobs and Roberts2016). This approach uses the full single aliquot regenerative dose (SAR) protocol (Murray and Wintle, Reference Murray and Wintle2000) only for a limited number of aliquots while the remaining aliquots are measured with a reduced protocol. The aim of this procedure, which is to reduce the measuring time without compromising accuracy or precision, was shown to reduce measurement times by up to 70% (Mueller and Preusser, Reference Mueller and Preusser2022). The SGC method was first proposed for luminescence dating by Roberts and Duller (Reference Roberts and Duller2004), and has since been refined and applied for the dating of sediments from a broad range of environmental contexts (e.g., Hu et al., Reference Hu, Marwick, Zhang, Rui, Hou, Yue, Chen, Huang and Li2019; Fu et al., Reference Fu, Li, Jacobs, Jankowski, Cohen and Roberts2020; Mueller and Preusser, Reference Mueller and Preusser2022). Nevertheless, as yet there has been no systematic work published using this approach on sediments from Arabia.
To achieve the ultimate goal of the study (i.e., improve the understanding of Quaternary sedimentary system dynamics in response to climate change), we first focus on assessment of the luminescence properties and measurement protocol performance, and verify application of the SGC approach from sediments along the proximal, medial, and distal end members of two wadi systems in the United Arab Emirates (UAE). The new data are then discussed in the context of previously published information regarding the timing of both environmental change and sedimentary dynamics in SE Arabia.
Regional setting and site description
SE Arabia (Fig. 1) lies at the interface between the hot desert climate of the Rub' al-Khali desert and the Hajar (Oman) Mountains (Parker et al., Reference Parker, Eckersley, Smith, Goudie, Stokes, Ward, White and Hodson2004). The region is influenced by both the mid-latitude Westerlies and the Indian and African monsoons, which form part of one of the most dynamic climate systems on the planet (Clemens et al., Reference Clemens, Prell, Murray, Shimmield and Weedon1991). Consequently, SE Arabia is a key region for assessing hydroclimatic changes at the monsoon-westerly interface during the past. The area is located north of the summer position of the Intertropical Convergence Zone, with monsoon-sourced rainfall presently limited to southern and western margins of the Arabian Peninsula (Parker and Goudie, Reference Parker and Goudie2008; Herold and Lohmann, Reference Herold and Lohmann2009; Jennings et al., Reference Jennings, Singarayer, Stone, Krebs-Kanzow, Khon, Nisancioglu, Pfeiffer and Zhang2015; Parton et al., Reference Parton, White, Parker, Breeze, Jennings, Groucutt and Petraglia2015a).
The Hajar Mountains are characterized by steep relief, low rainfall, and high evapotranspiration (Parker et al., Reference Parker, Eckersley, Smith, Goudie, Stokes, Ward, White and Hodson2004). The maximum elevation, the Hajar at Jebel Shams in Oman, is 3028 m asl (Fig 1b), whereas the maximum elevation in the catchments of the study area is 2042 m asl. Although much of the mountain area has little or no vegetation cover, it does represent a center of relict biodiversity with strong floristic ties to southwest Asia, but is now isolated from this area by the Arabian Gulf and the lowland desert areas (Ghazanfar, Reference Ghazanfar1991). Farther to the south in Oman, where the topography exceeds 2000 m asl, there is a sufficient elevation change to represent a significantly different climate zone, with associated floral changes in comparison to the desert lowlands areas (Ghazanfar, Reference Ghazanfar1991). Rainfall enhanced by the orographic effects of the Hajar Mountains occurs in the winter months (December to February) and is associated with mid-latitude Westerlies (Fisher and Membery, Reference Fisher, Membery, Ghazanfar and Fisher1998) that originate as cyclonic depressions in the eastern Mediterranean, penetrating into the Persian Gulf, and hemmed in by the Zagros Mountain range in Iran to the north (Parker et al., Reference Parker, Eckersley, Smith, Goudie, Stokes, Ward, White and Hodson2004; Parton et al., Reference Parton, Farrant, Leng, Telfer, Groucutt, Petraglia and Parker2015b). Rainfall is characteristically low (~120 mm/yr), with a strong precipitation gradient across the region between the Hajar Mountains (~140 mm/yr) and Abu Dhabi (<50 mm/yr) (Parker and Goudie, Reference Parker and Goudie2008; Pain and Abdelfattah, Reference Pain and Abdelfattah2015). The wind regime across the region is complex, with 52% of sand-moving winds blowing from the west and northwest, driven by Shamal winds, 28% of sand-moving winds blowing from the southeast, and the remainder across a range of directions (Goudie et al., Reference Goudie, Colls, Stokes, Parker, White and Al-Farraj2000; White et al., Reference White, Goudie, Parker and Al-Farraj2001).
Within the study area, the geology of the Hajar Mountains is dominated by a Late Cretaceous Ophiolite succession, including mantle peridotites, typically harzburgite, and gabbros, with some polydeformed metamorphic rocks. On the western flank of the mountains, Late Cretaceous to Paleogene shallow water marine limestones are found (Thomas et al., Reference Thomas, Schofield, Goodenough, Styles and Farrant2006).
A series of coalesced alluvial fans (bajadas) of Miocene to Quaternary age forms a vast geomorphic system that stretches along the southwestern margin of the Hajar Mountains from the northern UAE (Al Farraj and Harvey, Reference Al Farraj and Harvey2000, Reference Al Farraj and Harvey2004, Reference Al Farraj and Harvey2005; Farrant et al., Reference Farrant, Arkley, Ellison, Styles and Phillips2006, Reference Farrant, Ellison, Thomas, Pharaoh, Newell, Goodenough, Lee and Knox2012) through northern Oman (Abrams and Chadwick, Reference Abrams and Chadwick1994; Blechschmidt et al., Reference Blechschmidt, Matter, Preusser and Rieke-Zapp2009) to the Wahiba Sands (Maizels, Reference Maizels, Frostick and Reid1987) (Fig. 1). In the UAE, these bajadas are largely of Quaternary age and mainly constructed of gravel deposits; but in northern Oman, most of the system consists of a dissected older fan sequence of Miocene to Pliocene age (Macklin et al., Reference Macklin, Ellison, Manning, Farrant and Lorenti2012) that is locally buried beneath more recent Quaternary gravels (Blechschmidt et al., Reference Blechschmidt, Matter, Preusser and Rieke-Zapp2009). Under current climatic conditions, these bajadas are almost completely inactive, with only minor surface reworking and channel incision occurring during rare flood events (Al Farraj and Harvey, Reference Al Farraj and Harvey2004; Farrant et al., Reference Farrant, Ellison, Thomas, Pharaoh, Newell, Goodenough, Lee and Knox2012; Parton et al., Reference Parton, Farrant, Leng, Telfer, Groucutt, Petraglia and Parker2015b). The largest fans occur in northern Oman (Abrams and Chadwick, Reference Abrams and Chadwick1994; Blechschmidt et al., Reference Blechschmidt, Matter, Preusser and Rieke-Zapp2009), where a vast alluvial plain consisting of coalescing low-gradient (<0.3°) fans exceeding 100 km in length formed along the southwestern margin of the Hajar Mountains. In the UAE, the Quaternary fans form an array of almost continuous deposits between Al Ain and Ras al Khaimah (Fig. 1), which are in some places ~50 m thick (Al Farraj and Harvey, Reference Al Farraj and Harvey2004; Parton et al., Reference Parton, Farrant, Leng, Telfer, Groucutt, Petraglia and Parker2015b). The size and morphology of the Quaternary alluvial fans depend on the size of the catchment area, climate, and the dominant lithology of the fan gravels. The local geology, the steep relief of the Hajar Mountains, and the low frequency but high intensity nature of the flooding of the watercourses are key in the formation of the distinctive wadi geomorphology and series of fluvial/alluvial deposits (Parker and Goudie, Reference Parker and Goudie2008).
Wadi systems drain into the Rub’ al-Khali dune field, which is the largest active sand sea in the world, covering ~560 000 km2 (White et al., Reference White, Goudie, Parker and Al-Farraj2001). The dunes in this part of the Rub’ al-Khali mostly comprise linear megaridges, up 80 m high, formed initially by winds blowing from southwest to northeast. Under current wind conditions, however, the megadunes are more or less transverse to the prevailing shamal winds, so that the linear megaridges are overlain by secondary patterns (Goudie et al., Reference Goudie, Colls, Stokes, Parker, White and Al-Farraj2000; Farrant et al., Reference Farrant, Duller, Parker, Roberts, Parton, Knox and Bide2015). Dune geochemistry has revealed the mixing of two major sources of sediment: a terrestrial source of reddened quartz grains, and a marine carbonate source (White et al., Reference White, Goudie, Parker and Al-Farraj2001). Material derived from fluvial sources, originating from the mountains, contributes only a minor component into the dune field owing to the low quartz components found in regional limestone and mantle rocks (Garzanti et al., Reference Garzanti, Vermeesch, Andò, Vezzoli, Valagussa, Allen, Kadi and Al-Juboury2013). The major source for the dune sands comes from reworked carbonate-rich Pleistocene aeolianite from as far as 80 km inland, or from Miocene siliciclastic strata coming from the west (Farrant et al., Reference Farrant, Duller, Parker, Roberts, Parton, Knox and Bide2015). Within the study area, the linear megaridges of the dune system are truncated or disrupted by several wadi courses.
For this study, two Wadi systems (Wadi Iddayyah and Wadi Dhaid) and a dune adjacent to the archaeological site at Jebel Faya (FAY-NE1) (Armitage et al., Reference Armitage, Jasim, Marks, Parker, Usik and Uerpmann2011) were investigated (Fig. 1). The dune (FDU) is located at the foot of Jebel Faya, which is part of the 20 km Al Faya anticline, a limestone outlier of the Hajar Mountains, and was sampled to characterize the nature of dune sediments from a fresh exposure in close proximity to the wadis. The site, situated between the Persian Gulf in the west and the Gulf of Oman in the east, is ~60 km inland from either coast. The headwaters of both wadi systems are located in the Hajar Mountains. In the piedmont area, a series of extensive, low gradient, alluvial fans coalesce along the western margin of the Hajar Mountains, forming a vast system, which extends up to 20 km westward from the mountain front. The fans spread out towards the Jebel Faya Anticline where alluvial channels merge into wadi systems. From the apex of the alluvial fans, the main wadi systems split to form a complex series of anastomosing as well as braided distributary channels that keep their form for several kilometers before becoming more diffuse in the mid-portion of the fan. The wadis vary in width, but are typically tens of meters wide with flat floors. The channels tend to be braided with lenses of finer-grained material, while coarser gravels and boulders extend across the wadi floors, especially in the proximal part of the fluvial systems. Along the wadi systems, clast size generally decreases downstream of the alluvial fans, where the material in active transport is generally fine gravel and sand.
Wadi Iddayyah, the main drainage system within the Jebel Faya Anticline area, extends >170 km from its headwater source in a northwest direction towards the coast, but terminates in the desert ~30 km before reaching the Gulf. En route, it passes to the west of Jebel Aqabah and Jebel Faya (site FDU) where the channel merges with its main feeder channel, Wadi Baraq (Parton et al., Reference Parton, Farrant, Leng, Schwenninger, Rose, Uerpmann and Parker2013; site AQP of this study; Fig. 1). Together the two systems then run as a single channel in a northwest direction through the Rub‘ al-Khali dune field (IDD1 and IDD2, this study) towards the Persian Gulf coast (SHAC, this study). Approximately 20 km to the north, the neighboring wadi system of Wadi Dhaid flows from the Hajar Mountains in the UAE for ~102 km in approximately the same northwest direction as Wadi Iddayyah.
Unlike Wadi Iddayyah, Wadi Dhaid reaches the Persian Gulf. It is fed by the large braid plains featuring several fluvial systems, including Wadi Shawkah (KAD, this study; Fig. 1), Wadi al-Yitaymah, and Wadi al-Qorad, which merge to form a larger wadi course that flows northwards for several kilometers along the western edge of the inland basin towards Wadi al-Dhaid/Wadi Madsah (Drechsler, Reference Drechsler, Uerpmann, Uerpmann and Jasim2008). The middle and lower parts of Wadi Dhaid, locally termed Wadi Limhah, cuts through the dunes and meets the sea to the north of Umm al Qaiwain. However, it is evident from exposures at Tawi Asmar (25°25′N, 55°45′E) (Atkinson et al., Reference Atkinson, Thomas, Parker and Goudie2013) and at a series of oases at Fallaj al Moalla and Mohadeb, that wadi gravels underlie large tracts of the dune field (Farrant et al., Reference Farrant, Arkley, Ellison, Styles and Phillips2006; Parker and Rose, Reference Parker and Rose2008; Parker, Reference Parker, Petraglia and Rose2010). The gravels were deposited under conditions of higher runoff and sediment transport than occur today. Such past depositional regimes were likely far more consistent than today, because even under modern flash flood conditions, the middle and lower stretches of these wadis are inactive while the deposition of cohesive, stratified sediments is almost entirely absent.
Within both wadis, the proximal part of the alluvial fan system is characterized by a small number of deeply incised alluvial channels, up to 5–10 m into the fan surface. The gravel deposits here are usually extremely poorly sorted and are generally massively bedded channel fills and debris flows with occasional cut-and-fill structures. The deposits generally contain very few sedimentary structures other than imbrication and channels. Farther down the fans, gravels contain both stream-flow and sheet-flood sediments, typically characterized by 1–5 m thick, graded, fining-up sequences and channelized beds of gravel, interbedded with coarse, cross-bedded ophiolite-dominated gravelly sand. Sheet-flood deposits, which become increasingly common lower down the fan, consist of gravel/sand couplets that display both planar and trough cross-bedding. In the medial parts of the wadi systems, the sediment is typically dominated by medium- to coarse-grained, moderately sorted sand, locally interbedded with fine gravel, fine-grained sand, or laminated silt. There is an increase in the component of quartz derived/reworked from the surrounding dune fields. The distal end of the wadi systems largely comprises sand and silt of sheet-flood origin with sedimentary structures associated with ephemeral streams, including climbing ripples, rip-up clasts, slump structures, collapsed blocks from channel undercutting, erosional channel cut and fill features, cross-bedding, and planar-bedding. Locally, beds of fine-grained sand and silt with mud cracks and curls occur, representing waning flow and desiccation. Much of the sediment appears to be reworked quartz-rich aeolian sand from the surrounding dune field rather than being derived from the ophiolite rocks in the headwaters of the catchment, with coarser lithic grains and many rip-up clasts of laminated silt (Farrant et al., Reference Farrant, Arkley, Ellison, Styles and Phillips2006). Locally the sand is derived from three sources: (1) transported down from the mountains by fluvial action; (2) eroded from the underlying bedrock (often cemented calcarenites from alluvial fan sand or cemented aeolianite); and (3) a significant aeolian component of fine- to medium-grained, sub-rounded sand, blown in from the neighboring dune-fields. Clast size generally decreases downstream, and downstream of the alluvial fans, the material in active transport is bed-load dominated and generally consists of fine gravel and sand.
The locations of sampling sites are shown on Figure 1 and sedimentary logs are provided in Figure 2. Samples were collected from the proximal part of Wadi Dhaid and medial and distal parts of Wadi Iddayyah from quarry and natural exposures cutting through exposed alluvial/fluvial and aeolian sediment deposits. In addition, samples were collected from a dune exposure on the flank of Jebel Faya. At each site, the sediment units were logged and described in detail in the field and samples collected for sedimentological analyses and for age determination (Table 1, see Supplementary Figs. 1–6 and Supplementary Tables 1–8 for details of each site).

Figure 2. Sediment logs of all investigated sites. Note, y- and x-axes vary for each of the shown logs (C/Si = clay/silt; S = sand; G = gravel; C = cobbles; Bo = boulders). OSL ages are given as described in the text. *The derived age for SHAC6 was rejected (see subsection “Luminescence chronology”).

Figure 3. De(t) plots of two representative aliquots of FDU4. De values were derived from either successive 0.2 s intervals with stimulation time (A, C) or for intervals with integration limits that were subsequently extended by 0.2 s (B, D).
Table 1. Overview of sampling sites, samples, facies, and depositional environments.

MATERIAL AND METHODS
Samples and sample preparation
Twenty-two samples were obtained at six sites (Figs. 1, 2; Table 1), including outcrops (IDD1, IDD2, AQP, SHAC), an excavated trench (FDU), and a gravel pit (KAD). For this, the surfaces were cleaned and opaque plastic tubes were driven horizontally into the exposures at most sites. Due to sediment cementation, three blocks of sediment (SHAC2, SHAC4, SHAC6) were cut out of one outcrop and covered in opaque wrap. At site KAD, deposits predominantly consist of gravel, so to increase the amount of sediment collected in the preferred grain size range for OSL dating, sample material was pre-sieved in the field. Therefore, sampling was conducted at night, material was removed from the exposure, sieved, and only the <200 μm fraction was transferred to opaque bags. For this site, additional bags with pristine, un-sieved material were collected for dose rate determination.
All samples were opened and handled under subdued red-light conditions at the Freiburg Luminescence Laboratory (Germany). Tube ends (3–4 cm) and the outer rind of the block samples were removed, dried, and pulverized for dose rate determination. Collected bags for KAD were processed equally.
The remaining material was prepared for equivalent dose (De) determination following standard laboratory procedures, including wet-sieving, carbonate removal with 20% hydrochloric acid (HCl), and density separation using sodium polytungstate (<2.70 g/cm3; >2.58 g/cm3) to isolate the quartz fraction. Quartz grains were etched in 40% hydrofluoric acid (HF) for one hour to remove the alpha-irradiated rinds and any remaining feldspar grains. Any fluorides that may have precipitated during this process were dissolved by one hour treatment with 20% HCl. Purified and dried quartz grains (100–150 μm, 150–200 μm; Table 2) were mounted onto stainless-steel cups using silicon oil stamp with a diameter of 2 mm (~170 and 90 grains, respectively).
Table 2. De determination data for all samples. nacc/nmeas = number of accepted and totally measured aliquots; DR = dose rate; OD = overdispersion. De values and ages accepted for geochronological consideration are presented in bold. # Samples with truncated distributions for which CAM De values and ages are considered to be minimum estimates.

Measurement equipment and protocols
De values were obtained with a Freiberg Instruments Lexsyg Standard reader (Richter et al., Reference Richter, Richter and Dornich2013) using LEDs with peak emission at 525 nm (green range). The emitted OSL signals were detected by an H7360-02 photomultiplier tube filtered through a 3 mm BG 39 Schott glass and a 5 mm Delta-BP 365/50 EX-interference filter. Laboratory irradiation was given by a 90Sr/90Y beta source mounted into the reader. The beta source was calibrated using LexCal2014 calibration quartz (90–160 μm; 3 Gy) to ~0.07 Gy/s.
All measurements were conducted using preheating prior to the natural (Ln), regenerative (Lx) and test doses (Tn, Tx) for which the aliquots were heated at 5°C/s to the preheat temperature and held for 10 s. An adequate preheat temperature combination of 260°C (Ln, Lx) and 200°C (Tn, Tx) was found. For the ease of reading, details of performance tests and their results are given in section “Luminescence properties and performance.” De measurements were conducted following the SAR protocol (Murray and Wintle, Reference Murray and Wintle2000) with a test dose of ~14 Gy. Full SAR measurements were performed on 7–12 aliquots per sample (Supplementary Table 9). Aliquots that suffered from poor recycling, depletion after infrared stimulation (>20%), or recuperation issues (Lx/Tx [0 Gy dose] >5% of Ln/Tn) were rejected (Supplementary Table 9). In addition, poor fitting of the dose response curve (DRC) as determined by the figure of merit (FOM) was applied as a rejection criteria. Following Peng and Li (Reference Peng and Li2017), an FOM of <10 indicates an accurate fit of the DRC. The FOM is a measure of goodness-of-fit ($FOM = \Sigma \vert {y_i^o -y_i^f } \vert \;/\;\Sigma y_i^f \ast 100$ ) that accounts for the normalized differences between observed ($y_i^o ; \;L_x^{} /T_x^{}$
 ) and fitted ($y_i^f ; \;DRC$
 ) data. The SAR dataset was subsequently used to determine a SGC for each sample following Li et al. (Reference Li, Jacobs and Roberts2016). For this, the SAR datasets were least-square (LS) normalized by iteratively scaling and fitting of Lx/Tx (for details see Li et al., Reference Li, Jacobs and Roberts2016) and fitted with a single-saturating exponential function.
In addition to the SAR dataset, simplified measurements (SM) were conducted on 31–43 aliquots per sample (Supplementary Table 9). This reduces the measurement time for one aliquot by ~60%. The SM dataset consists of the Ln/Tn and one Lx/Tx measurement (~55 Gy) of each aliquot. The latter was used to individually re-normalize the SGC and Ln/Tn value for every measurement. To account for uncertainty of the SGC, the average deviation of the established SGC is combined in quadrature with the uncertainty of Ln/Tn to calculate the De uncertainty. De values were then determined for both the SAR and SM datasets. Ln/Tn measurements that failed to intersect with the SGC were regarded in saturation, are listed in Supplementary Table 9, and were rejected from De determination.
While performance of the SGC was assessed for all samples, SAR performance was investigated in depth for one expectedly well-bleached aeolian sample (FDU2). In addition, the chosen SAR protocol was tested for one representative sample per site to verify the regional applicability. Decay curves were assessed and the initial signal was set to be derived from the first 1 s of the OSL decay from which the last 15 s were subtracted (see subsection “Signal properties”). SAR and SGC De values were calculated using the numOSL package for R (Peng and Li, Reference Peng and Li2017; Peng et al., Reference Peng, Li, More, Garbow, Hillstrom, Burkhardt, Gilbert and Varadhan2018) and age models (central age model [CAM] and minimum age model [MAM]; Galbraith et al., Reference Galbraith, Roberts, Laslett, Yoshida and Olley1999) were applied with the Luminescence package for R (Burow Reference Burow2020a, Reference Burowb). For the MAM, an expected overdispersion (σb) of the well-reset proportion of the sample of 20% is assumed.
For dose rate determination (DR), radionuclide concentrations were determined by high-resolution gamma-ray spectrometry at VKTA (Dresden, Germany; Supplementary Table 10). No evidence for radioactive disequilibrium was reported (Degering and Degering, Reference Degering and Degering2020). The cosmic contribution was determined for present-day depths (i.e., overburden) following Prescott and Hutton (Reference Prescott and Hutton1994). A representative long-term water content of 3 ± 3% was assumed and used for DR determination of all samples, which was calculated together with the OSL ages using ADELE 2017 software (Degering and Degering, Reference Degering and Degering2020).
LUMINESCENCE PROPERTIES AND PERFORMANCE
Signal properties
Quartz grains from all investigated sites presented bright OSL signals (Tn signal > 3 × background, Tn error <20%). However, the green light stimulated decay signals only reduced to ~20% after ca. 3 s and De(t)-plots (Bailey, Reference Bailey2000) were produced to ensure that only the fast component is used to determine De values. For this, De values were determined for (1) 0.2 s intervals with stimulation time, and (2) for intervals with integration limits that were subsequently extended by 0.2 s. Results for two representative aliquots of FDU4 (Fig. 3) show that De values derived over the first 6 s of the signal are consistent. Neither interval position nor interval length have a significant influence on De determination, which indicates that the signal is dominated by the fast component. Integration limits for the initial signal were set to the first 1 s of the OSL decay over which the De value determination was most consistent. In addition, a late background subtraction using the last 15 s of the signal was applied.
SAR performance tests
At first, performance tests were conducted in depth on one representative aeolian sample (FDU2) that is thought to have been well bleached and to provide insights into the expected spread of De values. SAR performance was assessed by the means of three tests: (1) preheat plateau, (2) dose recovery (~28 Gy given dose), and (3) thermal transfer (Fig. 4). These tests were conducted for three different preheat temperatures for Lx (220, 240, 260°C) with preheats of 200°C for Tx (5°C/s, held for 10 s). For preheat plateau and dose recovery tests, seven measurements per preheat temperature combination were performed while three aliquots were used for the thermal transfer test. The preheat plateau test was conducted on the natural signal; both other tests were carried out on sample material that was bleached three times successively for 200 s with green LEDs in the Lexsyg Standard reader.

Figure 4. (A) Dose recovery (28 Gy given dose; M/G-dose ratio shows the measured-to-given dose ratio) and preheat (PH) plateau test results of FDU2 (mean at 35.6 ± 1.2 Gy). Arrows indicate the y-axis referred to by each dataset. (B) Thermal transfer test results of FDU2; the dashed line indicates 0 Gy. (C) Dose recovery test results for one sample of each site for a preheat temperature of 260°C.
Natural De values and measured-to-given dose (M/G-dose) ratios are consistent across all tested preheat temperature combinations, with the best recovery for a preheat of 260°C (0.99 ± 0.03) and a mean De value of the natural at 35.6 ± 1.2 Gy. Thermal transfer is observed for all preheat combinations and ranges between 0.06 ± 0.03 Gy and 0.12 ± 0.06 Gy. However, this equates to <1% of the final De values for most samples and is regarded as negligible. Due to the best recovery results, a preheat combination of 260°C for Lx and 200°C for Tx was subsequently chosen. Further dose-recovery tests were conducted on six aliquots of one representative sample per site using the chosen preheat combination (Fig. 4). M/G-dose ratios were consistent with 1.00 ± 0.10 for all samples, confirming the applicability of the chosen SAR protocol.
SAR dose response curve shapes
Distinctly different DRC shapes have been observed for quartz samples in some (see Li et al., Reference Li, Jacobs and Roberts2016; Hu et al., Reference Hu, Marwick, Zhang, Rui, Hou, Yue, Chen, Huang and Li2019, Reference Hu, Li and Jacobs2020; Fu et al., Reference Fu, Li, Jacobs, Jankowski, Cohen and Roberts2020), but not all, recent studies (Mueller and Preusser, Reference Mueller and Preusser2022). Hence, it is essential to assess the characteristic shapes of the obtained DRCs prior to SGC construction. Li et al. (Reference Li, Jacobs and Roberts2016) suggested deriving the ratio between two regenerative dose points, the so-called signal growth ratio (SGR), and to evaluate the spread. Accordingly, SGRs were determined for all SAR measurements of this study using the two highest regenerative dose points. Differences of SGRs per sample range between 12–52% (Fig. 5). Much higher values of ~200% differences were reported for single-grain measurements by Hu et al. (Reference Hu, Marwick, Zhang, Rui, Hou, Yue, Chen, Huang and Li2019, Reference Hu, Li and Jacobs2020) and Fu et al. (Reference Fu, Li, Jacobs, Jankowski, Cohen and Roberts2020), and ~90% for aliquots by Li et al. (Reference Li, Jacobs and Roberts2016). Mueller and Preusser (Reference Mueller and Preusser2022) found a spread of 30% for samples from Switzerland. This was regarded as evidence for the lack of different DRC types, and hence, as negligible. Therefore, no type-specific SGCs and only a single SGC were calculated for each sample. The SGR spread observed here is rather small and can be reduced by LS-normalization during SGC determination (see subsection “SGC performance”). Additionally, De values of most samples are <50 Gy, a threshold below which only one shared shape of DRCs has been reported (e.g., Li et al., Reference Li, Jacobs and Roberts2016; Fu et al., Reference Fu, Li, Jacobs, Jankowski, Cohen and Roberts2020). Hence, only one SGC was derived using all SAR measurements for each sample.

Figure 5. Signal Growth Ratios (SGRs) for all measured full SAR measurements derived using the two highest regenerative dose points. The percentage of spread is given for each sample. SGRs are mainly consistent with each other, indicating that the dose response curves (DRCs) obtained for each sample have similar shapes.
SGC performance
For SGC determination, regenerative dose points of the SAR measurements were LS-normalized (Fig. 6), thereby significantly reducing scatter before being described by the SGR. SGCs are well fitted with single-saturating exponential function giving FOM values between 3.0–9.0, with an average fitting error <0.02 (Table 3). De values derived for the SAR dataset using (1) the SAR DRCs and (2) the SGCs were compared and consistent results were returned with ratios of between 0.97 ± 0.14 and 1.12 ± 0.14 for all but two samples. IDD1-1 yielded a ratio of 0.95 ± 0.30 and SHAC2 yielded a ratio of 1.30 ± 0.19, for which are both triggered by one extreme outlier. The general performance of the SGC is good, and hence its use was justified.
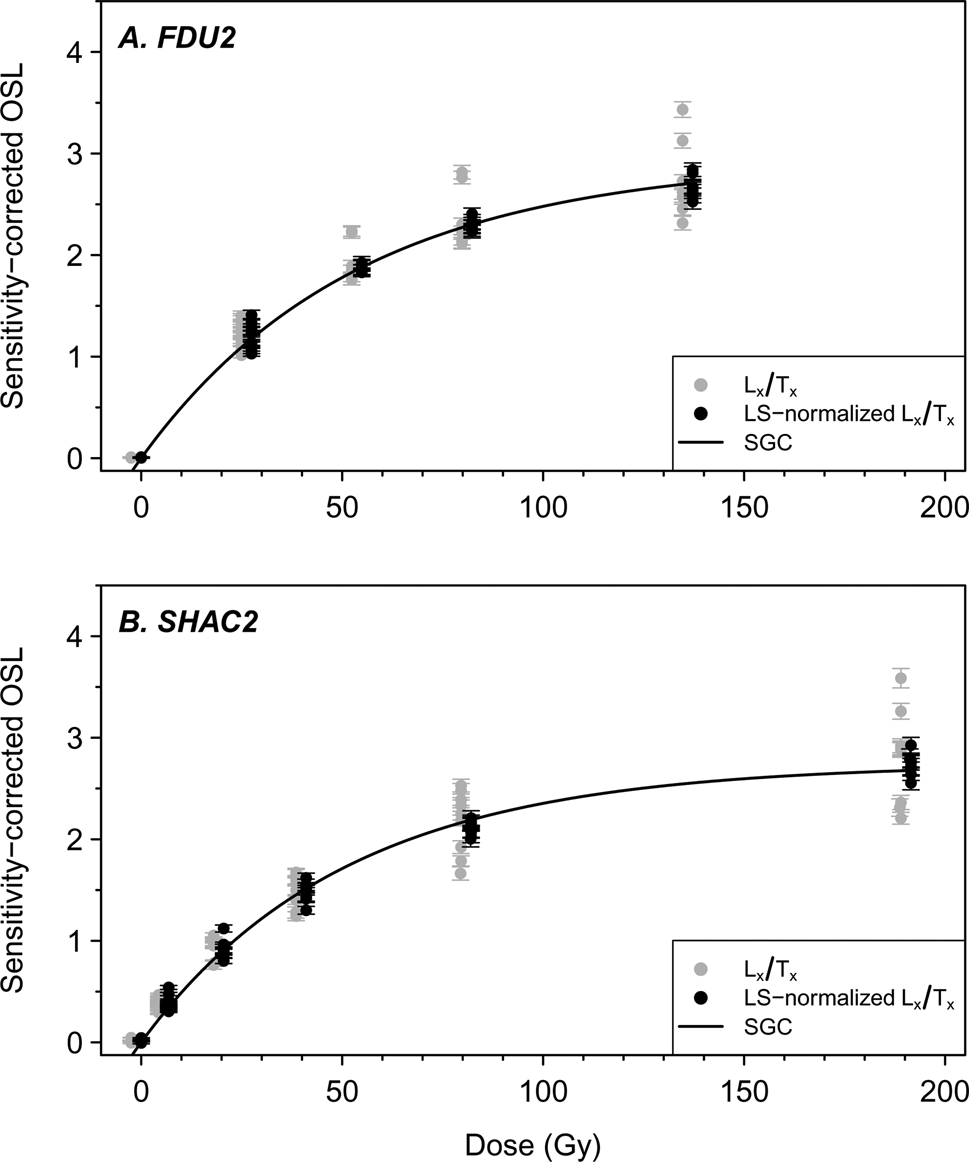
Figure 6. Two representative examples of regenerative dose points of the full SAR measurements before and after LS-normalization. The latter is used to derive the SGCs.
Table 3. SGC performance measurements.

* one extreme outlier.
RESULTS
De distributions
For all but one site (SHAC), which will be presented separately below, three types of De distributions were observed and representative examples are shown in Figure 7 (all plots in Supplementary Figure 1). Type 1 distributions are characterized by low-degree positive skew and overdispersion (OD) values ≤ 4%. Only a few outliers are observed at the upper and/or lower end of the distributions (Fig. 7). Most samples, aeolian and fluvial, fall into this group (FDU, KAD, AQP, IDD2), and CAM De values range between 21 ± 1 Gy (IDD2A) and 89 ± 3 Gy (AQP5; Table 2). Importantly, all three samples of FDU, which are expectedly well-bleached dune samples, present Type 1 distributions. MAM De values were calculated to assess whether a positive skew affects the De value determination; however, MAM De values are consistent with those derived using the CAM. This indicates that outliers on either end of the populations have little influence on final De values. Also, similar De distribution shapes of well-bleached aeolian samples (FDU) and fluvial samples (KAD, AQP1–AQP4, IDD2) point towards sufficient bleaching during fluvial transport and that derived De values represent post-depositional trapped charge.

Figure 7. Representative De distributions. Type 1 distributions were observed for all aeolian samples (FDU) and only some fluvial deposits (e.g., AQP1), while the other fluvial samples were of Type 2 and 3. Number of accepted measurements (n), CAM De, and overdispersion (OD) values are given for all samples except IDD1-1. For the latter, the denoted De value was derived using the MAM.
One distribution (IDD1-1), Type 2, is best described by a wide spread of De values, an OD value of ≥48%, and no obvious separate distribution is present (Fig. 7). In the absence of post-depositional disturbances, such a spread is likely caused by incomplete bleaching during transport. Therefore, only the lower part of the distribution may represent post-depositional trapped charge, and consequently only a MAM De value of 24 ± 3 Gy will describe an appropriate dose for this sample.
Another sample (IDD1-2) is characterized by a rather small OD value of 13 ± 4% and truncation because a number of aliquots were rejected due to being in saturation (Supplementary Table 9; Fig. 7). For this Type (3), a CAM De value of ≥104 ± 4 Gy (IDD1-2) was derived. This De value has to be regarded as a minimum estimate because only the lower, constrainable De values are used to derive the average.
For SHAC, De distributions are presented in Figure 8. Distributions of SHAC4, 5, and 7 are characterized by a very wide spread of De values and OD values between 64 ± 7% and 118 ± 13% (Table 2). These samples likely suffer from partial bleaching and are most similar to the Type 2 distribution. MAM De values of 16.3 ± 2.2 (SHAC4), 3.7 ± 0.8 (SHAC5), and 1.8 ± 0.4 Gy (SHAC7) were calculated. All other SHAC samples are characterized by truncated distributions with many (9–32) aliquots of these samples in saturation (Supplementary Table 9). SHAC2 is characterized by a De distribution similar to IDD1-2 (Type 3) with a much lower OD value of 24 ± 5%. A CAM minimum De estimate of ≥101 ± 7 Gy and MAM De value of 86 ± 11 Gy were calculated. For SHAC6, no distinct population at the lower end of the De distribution is reported. A CAM minimum De estimate of ≥92 ± 8 Gy and MAM De values of 41 ± 5 Gy were derived.

Figure 8. De distributions of samples from the site SHAC. Number of accepted measurements (n), MAM De, and CAM overdispersion (OD) values are given.
Dose rates and age calculations
For most samples, a DR of between 0.96 ± 0.07 (SHAC2) and 1.25 ± 0.11 Gy/ka (IDD1-1) was determined. Only the DR of the proximal gravelly samples KAD1, 3, and 7 are much lower with values between 0.33 ± 0.02 (KAD3) and 0.44 ± 0.03 Gy/ka (KAD7) (Supplementary Table 10).
For the dune site FDU, consistent (1σ) ages of 37 ± 2 (FDU2), 41 ± 3 (FDU3), and 41 ± 2 ka (FDU4) were obtained (Fig. 2). At the gravel pit of KAD, ages increase with depth from 134 ± 8 (KAD7) to 161 ± 8 ka (KAD1). Similarly, the fluvial sequence of AQP (AQP1–4), is dated to between 34 ± 2 (AQP1) to 43 ± 2 ka (AQP4), increasing with depth. These fluvial units are underlain by an aeolian sand unit of 76 ± 5 ka (AQP5).
All samples of fluvial origin along the IDD sections present consistent (1σ) ages of 20 ± 1 ka (IDD2C-1, IDD2C-2) and 19 ± 2 ka (IDD1-1). The latter is underlain by a much older aeolian unit (Fig. 2) that yielded a minimum age estimate of ≥83 ± 6 ka (IDD1-2). Ages of 20 ± 1 (IDD2B) and 17 ± 1 ka (IDD2A) were obtained for two additional aeolian units.
All five SHAC samples presented complex De distributions (see further discussion below in subsection “Luminescence chronology”). Minimum age estimates of ≥106 ± 8, ≥46 ± 5, ≥82 ± 7 ka (CAM), and MAM ages of 90 ± 12, 16 ± 2, and 36 ± 5 ka were obtained for samples from cemented units SHAC2, SHAC4, and SHAC6, respectively. For intervening units, ages of 3.5 ± 0.8 (SHAC5) and 1.6 ± 0.4 ka (SHAC7) were derived.
DISCUSSION
Luminescence chronology
OSL signal properties were assessed for the investigated samples and found to be suitable for dating (see subsection “Luminescence properties and performance”). SAR measurement protocol performance was ensured and the applicability of the SGC approach was confirmed. Obtained De distributions (see subsection ”De distributions”) were assessed for partial bleaching with most samples showing distributions and OD values similar to those of the expectedly well-bleached dune sands (Type 1). While for those samples average De values were calculated using a CAM, for one sample (IDD1-1; Type 2) partial bleaching was indicated by its De distribution and a MAM De value was obtained. However, the calculated age of the latter is consistent with CAM ages obtained for most other samples from this site (Table 2). Another sample (IDD1-2) has been shown to be at the saturation limit represented by truncated distribution (Type 3) and only a minimum age estimate was yielded using the CAM. Together with the overall consistent estimates, this gives confidence in the reported ages for all investigated sites with the exception of SHAC.
For the lowermost sample, SHAC2, the age represents a minimum estimate because it is derived from a truncated De distribution (Type 3), hampering assessment of partial bleaching in this particular case. This indicates that fluvial activity occurred at or prior to 106 ± 8 ka, but prohibits any further chronological conclusions. All other samples from the SHAC site show clear evidence for partial bleaching (high OD and pronounced positive skewness). Samples SHAC4, 5, and 7 show De distributions with a distinct population at the lower edge similar to those reported for most of the other fluvial samples of this study, which gives some confidence that these represent the fully bleached population of grains at the time of deposition (Fig. 8). In contrast, SHAC6 shows a tail of De values at the lower end of the distribution. We speculate that in this case, all De values represent partially bleached signals and the main population ~90 Gy might represent the original dose of the sediment prior to redeposition. This value is similar to that of the basal sample (SHAC2) and suggests that any age calculated for sample SHAC6 should be considered unreliable. Therefore, SHAC6 has been rejected for chronological interpretation. When applying the MAM to the remaining three samples, the dataset for this site is internally chronologically consistent. Accordingly, the lower part represents different phases of deposition during the Late Pleistocene, whereas the upper part of the sequence falls into the Late Holocene.
Implications for fluvial dynamics in SE Arabia
The OSL ages reported here for fluvial deposition mainly fall within three periods of time (Table 2; Figs. 2, 9). The first cluster has been determined for the coarse proximal gravel deposits from the Khadra Quarry (KAD) and falls into the second half of MIS 6 (Fig. 9); considering age uncertainties, the upper part of the sequence also could correspond to MIS 5e. In fact, deposition of 11 m of sediment at this site apparently comprises several thousand years, if not some tens of thousands of years (ca. 160–135 ka). The second time period of aggradation is represented by a cluster of ages that is observed at two sites, Faya Dune (FDU) and Aqabah Pylon (AQP), and represents deposition ca. 40–35 ka. Interestingly, these two sites represent quite different modes of deposition; aeolian (FDU) and fluvial (AQP), respectively. The third cluster of ages, found for the different sites along Wadi Iddayyah (IDD), is ca. 20 ka. Again, this includes both aeolian and fluvial deposits. Finally, there is evidence for fluvial deposition during the final parts of both the Pleistocene and Holocene, but without a clear clustering of ages.

Figure 9. Summary figure displaying fluvial sediment OSL deposition ages determined within the present study and those reported in the literature (Krbetschek et al., Reference Krbetschek, Uerpmann, Jasim, Uerpmann, Uerpmann and Jasim2008; Parker and Rose, Reference Parker and Rose2008; Atkinson et al., Reference Atkinson, Thomas, Goudie and Parker2012, Reference Atkinson, Thomas, Parker and Goudie2013; Farrant et al., Reference Farrant, Ellison, Thomas, Pharaoh, Newell, Goodenough, Lee and Knox2012, Reference Farrant, Duller, Parker, Roberts, Parton, Knox and Bide2015; Parton et al., Reference Parton, Farrant, Leng, Schwenninger, Rose, Uerpmann and Parker2013, Reference Parton, Farrant, Leng, Telfer, Groucutt, Petraglia and Parker2015b; Hoffmann et al., Reference Hoffmann, Rupprechter, Rahn and Preusser2015) for SE Arabia. Additionally, ages for aeolian deposits determined in the present study are displayed. The Marine Isotope Stack of Lisiecki and Raymo (Reference Lisiecki and Raymo2005) is shown as a measure of global climate conditions. The Monsoon Index (Leuschner and Sirocko, Reference Leuschner and Sirocko2003) is given as an expression of potential theoretical climate forcing.
The most striking and unexpected observation is the fact that OSL ages reported here do not occur during identified eccentricity-modulated interglacial periods, but rather fall into phases of insolation driven, orbital scale increases in rainfall reported in the literature (Parton et al., Reference Parton, Farrant, Leng, Telfer, Groucutt, Petraglia and Parker2015b) based on phases of speleothem growth at Hoti and Qunf caves, Oman and Mukalla, Yemen, respectively (Burns et al., Reference Burns, Fleitmann, Matter, Neff and Mangini2001; Fleitmann et al., Reference Fleitmann, Burns, Neff, Mangini and Matter2003, Reference Fleitmann, Burns, Pekala, Mangini, Al-Subbary, Al-Aowah, Kramers and Matter2011; Nicholson et al., Reference Nicholson, Pike, Hosfield, Roberts, Sahy, Woodhead and Cheng2020) and lake formation (Parker, Reference Parker, Petraglia and Rose2010; Parton et al., Reference Parton, Clark-Balzan, Parker, Preston, Sung, Breeze and Leng2018; Groucutt et al., Reference Groucutt, White, Scerri, Andrieux, Clark-Wilson, Breeze and Armitage2021). In addition, there appears to be only a loose correspondence between the timing of fluvial deposition and the monsoon index peaks (MIP) suggested as a reference system by Bretzke et al. (Reference Bretzke, Preusser, Jasim, Miller, Preston, Raith, Underdown, Parton and Parker2022) (Fig. 9). In the following, the OSL ages reported here are discussed in the context of the existing regional chronology.
The 11 m thick sequence Khadra (KAD) comprises in its basal part (Fig. 2; Supplementary Table 3, Unit 1) coarse, very poorly sorted, clast-supported gravel with imbricated cobbles and boulders up to 30–55 cm in size. These were deposited under high energy conditions. Unit 1 was dated to 161 ± 8 ka (KAD1), placing the onset of accumulation into late MIS 6, while Unit 1 B shows a fining-upwards sequence. The main sequence represents a series of channel fills with multiple fining-upwards sequences. Unit 3 is represented by alternating layers of fine, planar-bedded ophiolite gravels and sands dated to 149 ± 8 ka (KAD3). These are overlain by a high energy flood deposit (Unit 4) denoted by clast-supported cobbles and gravels with some imbrication. The upper part of the sequence (Units 5 and 6) comprises up to ten fining-upwards sequences with the uppermost dated to 134 ± 8 ka (KAD7).
The KAD record coincides with alluvial fan activation at Sibetah, 90 km to the south, also located at the foot of the Hajar Mountains. There, 20 m of fluvial and alluvial sediments were deposited (ca. 160–150 ka) due to activation of the drainage system during which conditions were wet enough for development of savannah-type grasslands with a woody component (Parton et al., Reference Parton, Farrant, Leng, Telfer, Groucutt, Petraglia and Parker2015b). Both of these records span a precessionally driven insolation peak within MIS 6 (MIP13) at ca. 150 ka (Fig. 9) (Bretzke et al., Reference Bretzke, Preusser, Jasim, Miller, Preston, Raith, Underdown, Parton and Parker2022).
In addition, fluvial silts and gravels, dated from Wadi Dhaid 45 km downstream from Khadra, correspond to fluvial discharge reaching the medial to distal end of the catchment during MIS 6 at 174 ± 24 and 152 ± 14 ka, respectively (Parker and Rose, Reference Parker and Rose2008). Interdunal lacustrine/wetland deposits also have been dated farther inland, in the Rub’ al-Khali desert interior, from Liwa (160 ± 8 ka), from fluvio-lacustrine sediments (147 ± 12 ka) in the Sabkha Matti (Goodall, Reference Goodall1995), and from lacustrine silts at Khujaymah, in the Rub’ al-Khali from Saudi Arabia at 147 ± 15 ka (Rosenberg et al., Reference Rosenberg, Preusser, Fleitmann, Schwalb, Penkman, Schmid, Al-Shanti, Kadi and Matter2011).
Although evidence for increased rainfall during MIS 6 has been reported from speleothems from the Levant, central Negev, and southern Jordan (Bar-Matthews et al., Reference Bar-Matthews, Ayalon, Gilmour, Matthews and Hawkesworth2003; Vaks et al., Reference Vaks, Bar-Matthews, Matthews, Ayalon and Frumkin2010), this has not been shown from southern Arabian cave records (Fleitmann et al., Reference Fleitmann, Burns, Pekala, Mangini, Al-Subbary, Al-Aowah, Kramers and Matter2011). Based on the lack of dated speleothems, it has been suggested that the region was under a continually hyper-arid climate during MIS 6, with monsoon rainfall displaced substantially south due to increased glacial boundary conditions (Fleitmann et al., Reference Fleitmann, Burns, Pekala, Mangini, Al-Subbary, Al-Aowah, Kramers and Matter2011). Interestingly, the middle of MIS 6 coincides with MIP 13, and incipient soil formation at this time has been reported at al-Mamla on the southwestern edge of the Wahiba Sands between ca. 160–140 ka (Preusser et al., Reference Preusser, Radies and Matter2002; Radies et al., Reference Radies, Preusser, Matter and Mange2004). Significantly, this period also coincides with occupation recorded at Jebel Faya, indicating that widespread ephemeral drainage activation during MIS 6 was sufficient to support early human populations in SE Arabia, despite an absence of supporting evidence from lacustrine and speleothem records (Bretzke et al., Reference Bretzke, Preusser, Jasim, Miller, Preston, Raith, Underdown, Parton and Parker2022). However, the overall picture of changing rainfall levels during MIS 6 remains poorly understood to this point.
Although not shown in the new ages presented here, evidence for active alluvial and fluvial deposition during MIS 5 corresponding with insolation maxima has been demonstrated from a number of sites across SE Arabia. At Al Ain (Atkinson et al., Reference Atkinson, Thomas, Parker and Goudie2013) and Sibetah (Parton et al., Reference Parton, Farrant, Leng, Telfer, Groucutt, Petraglia and Parker2015b), thick sequences of alluvial and fluvial sediments were deposited in MIS 5e (135–115 ka) and MIS 5a (90–76 ka). Within the study area, perennial channel flow was demonstrated at Tawi Asmar, in the medial to distal end of Wadi Dhaid (Atkinson et al., Reference Atkinson, Thomas, Parker and Goudie2013), where a >20 m thick meandering channel filled with gravels and sands was dated to 115–76 ka (MIS 5c–5a). Hili Formation fluvial gravels from a relict paleodrainage system, stretching over a distance of ~150 km from the Hajar Mountains near Al Ain to Abu Dhabi, also have been dated to between 133–77 ka (Farrant et al., Reference Farrant, Ellison, Thomas, Pharaoh, Newell, Goodenough, Lee and Knox2012, Reference Farrant, Duller, Parker, Roberts, Parton, Knox and Bide2015). In Oman, at the distal end of an alluvial fan drainage network from the Jebel Ahkdar region, paleolake sediments from Saiwan were dated between 132–104 ka (Rosenberg et al., Reference Rosenberg, Preusser, Blechschmidt, Fleitmann, Jagher and Matter2012). These phases of fluvial activation and channel flow correspond to speleothem formation in Oman and Yemen during MIS 5, indicating rainfall in excess of 350 mm/yr (Burns et al., Reference Burns, Fleitmann, Matter, Neff and Mangini2001; Fleitmann et al., Reference Fleitmann, Burns, Neff, Mangini and Matter2003). While evidence for enhanced fluvial activity for this period has not been found in the current study, this most likely is linked to the availability of sediment exposures and sampling strategy.
Across the region, MIS 4 has been suggested as arid. At the transition between late MIS 5 and the onset of MIS 4, aeolian sands dated at AQP5 (76 ± 5 ka; current study) agree well with those found at Sibetah (73 ± 7 ka) (Parton et al., Reference Parton, Farrant, Leng, Telfer, Groucutt, Petraglia and Parker2015b). Also, farther to the west, in the western region of Abu Dhabi in the Rub’ al Khali, aeolian sands from both the coastal region carbonate-rich Ghayathi Formation and the red quartz-rich sands of the Madinat Zayed Formation were dated to ca. 78–70 ka (Farrant et al., Reference Farrant, Ellison, Thomas, Pharaoh, Newell, Goodenough, Lee and Knox2012, Reference Farrant, Duller, Parker, Roberts, Parton, Knox and Bide2015). Within the Liwa region of the UAE, foreset dune sands were dated to 71 ± 5 ka (Wood et al., Reference Wood, Rizk and Alsharhan2003).
Evidence for a period of increased wetness, congruent with a precessionally paced insolation maxima (MIP 5), has been suggested based on data from the Wadi Iddayyah catchment area, by dating of lacustrine deposits and flood silts at Jebel Aqabah (61–58 ka; Parton et al., Reference Parton, Farrant, Leng, Schwenninger, Rose, Uerpmann and Parker2013). Farther to the south, redevelopment of a braided channel network during a subsequent phase was identified in distal exposures of the Al Sibetah fan at Remah, ~50 km southwest of the Hajar Mountains, dating to 67–61 ka and ca. 55 ka (Farrant et al., Reference Farrant, Ellison, Thomas, Pharaoh, Newell, Goodenough, Lee and Knox2012). These ages are corroborated by interdunal wetland deposits from the Liwa region of the Rub’ al Khali, dated to 64 ± 6 and 54 ± 4 ka, which corresponds to the same time interval (Wood et al., Reference Wood, Rizk and Alsharhan2003). In Wadi Mistal, Oman, Hoffmann et al. (Reference Hoffmann, Rupprechter, Rahn and Preusser2015) dated a suite of fine-grained playa-like sediments that formed behind a landslide-dammed ephemeral lake between ca. 57–43 ka. During this time, rather than continuous rainfall under a monsoonal regime, the authors proposed multiple strong, short-lived precipitation events. Farther south in Oman, evidence for activation of the distal part of the drainage network is recorded from alluvial fan deposits dated to 45 ± 5 ka (Blechschmidt et al., Reference Blechschmidt, Matter, Preusser and Rieke-Zapp2009).
For the late MIS 3 stage, our results show a complex interplay between aeolian and fluvial process. Within the catchment study area, at FDU, 4 m of dune sands were emplaced between 41–37 ka, preserving evidence for rainfall as several short ponding events with desiccation curls occurring towards the base of the sequence. At AQP, located 1 km south of the fluvio-lacustrine silts studied by Parton et al. (Reference Parton, Farrant, Leng, Schwenninger, Rose, Uerpmann and Parker2013), multiple fining-upwards sequences of fluvial sands and silts are dated between 43–34 ka (APQ4 to 1). Deposition of Unit 2 at AQP (Fig. 2) is linked to repeated phases of channel flow that led to the accumulation of fluvially deposited silts and planar-bedded sands that fine upwards into carbonate-rich sands, each indicating a gradual waning of stream flow and desiccation. At least four cycles of these aggradation phases are recorded in this unit. At the present time, it is not possible to determine whether these phases represent a series of strong, short-term precipitation events or a more-pronounced humid phase because three of the OSL ages at AQP overlap, potentially suggesting very rapid deposition. However, the OSL ages determined for the AQP fluvial sequence are close to the age calculated for a weak precessionally driven insolation maxima, corresponding with MIP 3 (Fig. 9).
Most paleoclimate evidence suggests that hyper-arid conditions prevailed throughout much of MIS 2, during which there was widespread dune mobilization and emplacement throughout SE Arabia (Goudie et al., Reference Goudie, Colls, Stokes, Parker, White and Al-Farraj2000; Parker and Goudie, Reference Parker and Goudie2008; Leighton et al., Reference Leighton, Bailey and Thomas2014; Farrant et al., Reference Farrant, Duller, Parker, Roberts, Parton, Knox and Bide2015). The main phase of dune accumulation occurred between 22–20 and 16–9 ka, respectively, and has been attributed to both high sediment availability and wind-driven transport capacity (Preusser et al., Reference Preusser, Radies and Matter2002; Preusser, Reference Preusser2009; Thomas and Bailey, Reference Thomas and Bailey2019). In Wadi Iddayyah, the complex interplay between aeolian and fluvial processes is also shown at ca. 20 ka by the current study. The accumulation of several distinct silt units in the medial to distal wadi at IDD1 and IDD2 implies that there was sufficient rainfall to generate low-energy channel flow or standing water during MIS 2 (ca. 20 ka), although the stability and duration of these phases remain unclear. This concurs well with fluvial sediments dated to 19 ± 2 and 18 ± 2 ka at paleolake Saiwan in Oman, located at the distal end of the alluvial fan drainage network (Rosenberg et al., Reference Rosenberg, Preusser, Blechschmidt, Fleitmann, Jagher and Matter2012). Along with similarly dated travertine deposition at Nizwa (Clark and Fontes, Reference Clark and Fontes1990), this implies some water availability at this time.
The three reliable OSL ages for the Sharjah Army Camp (SHAC) point towards episodic fluvial deposition in this distal part of the drainage network (at 16 ± 2, 3.5 ± 0.8, and 1.6 ± 0.4 ka). It should be noted that these likely do not record all phases of deposition at this site. Furthermore, it is interesting to recognize that so far no fluvial deposition has been dated for the pronounced humid period that occurred during early MIS 1 (ca. 11–6 ka). This suggests either no accumulation occurred during this time, or these sediments have not been preserved, or sediments falling into this period have not been sampled yet. The latter could be explained by the fact that these young sediments might be deeply buried and are not easily accessible. Indeed, the widespread evidence for lake formation and speleothem growth during the Early Holocene would appear to support this supposition.
CONCLUSIONS
Fluvial systems offer considerable potential to address the current gaps in knowledge that exist in understanding of late Quaternary environmental change in Arabia, with evidence from some key periods limited to just a handful of spatially dispersed, terrestrial records. The new OSL ages reported here for proximal to distal fluvial systems in SE Arabia fall into three main periods of fluvial activity of the drainage networks: 160–135 (MIS 6), 43–34 (MIS 3), and ca. 20 ka (MIS 2). These ages, as well as single ages determined for the Late Pleistocene and Late Holocene, all fall outside of previously proposed major wet periods from Arabia.
Alluvial fan and fluvial activation during MIS 6 could correspond with precessionally driven insolation and monsoon-driven maxima outside of global interglacials. The complex interplay between fluvial and aeolian dynamics is recorded during late MIS 3, with evidence for drainage activation and episodic channel flow ca. 43–34 ka (AQP), as well as aeolian dune accumulation ca. 41–37 ka (FDU). This is perhaps unsurprising given that relatively short-lived ephemeral drainage activation during MIS 3 would have occurred alongside dune accretion within a predominantly arid environment. Evidence from the late MIS 3 nonetheless corresponds to a period of weak insolation maxima. Sufficient rainfall to generate channel flow/standing water is also reported during MIS 2 (ca. 20 ka), thereby suggesting that the hyper-arid conditions that are widely thought to have prevailed throughout much of MIS 2 were punctuated by possibly short-lived periods of increased rainfall or possibly even phases of centuries to millennia.
The data presented here show that the eccentricity-timed insolation changes, as previously reported from lake (Groucutt et al., Reference Groucutt, White, Scerri, Andrieux, Clark-Wilson, Breeze and Armitage2021) and speleothem records elsewhere in Arabia (Fleitmann et al., Reference Fleitmann, Burns, Pekala, Mangini, Al-Subbary, Al-Aowah, Kramers and Matter2011), cannot alone account for the internal complexity of fluvial systems within the region. Such complexity is likely driven by a range of endogenic and exogenic factors, such as regional topography, underlying geological formations, and base-level changes, alongside regional synoptic climate variability. Future work will need to produce much larger data sets from a range of environments to decipher if certain peaks can be identified clearly and directly attributable to orbital forcing parameters. Furthermore, the occurrence of fluvial accumulation during periods of supposed hyper-aridity challenges a longstanding wet/dry dichotomy in Arabia, while simultaneously enhancing the debate regarding early human occupation of arid regions.
Acknowledgments
Funding to support OSL dating and laboratory analyses was kindly provided by the International Association for the Study of Arabia (IASA). We thank the Department of Culture and Information of the Emirate of Sharjah and the Directorate of Antiquities for permission to work in the region.
Supplementary Material
The supplementary material for this article can be found at https://doi.org/10.1017/qua.2022.51


 Open access