


Schizophrenia may arise from abnormal functioning of the prefrontal cortex, anterior cingulate, thalamus, cerebellum and hippocampus, along with the neuronal circuitry connecting these brain regions (Reference Lipska and WeinbergerLipska & Weinberger, 1993; Reference JonesJones, 1997; Reference BenesBenes, 1998; Reference Selemon and Goldman-RakicSelemon & Goldman-Rakic, 1999). In vivo 31-phosphorus magnetic resonance spectroscopy (31P–MRS; Reference Williamson, Drost, Glen and HorrobinWilliamson & Drost, 1999) measures levels of energy metabolites: phosphocreatine, inorganic phosphate and adenosine triphosphate; it also measures constituents of membrane synthesis – phosphomonoesters (phosphoethanolamine and phosphocholine) – and breakdown phosphodiesters (glycerophosphoethanolamine and glycerophosphocholine). An earlier 31P–MRS study (Reference Williamson, Drost, Glen and HorrobinWilliamson & Drost, 1999) examining patients with first-episode schizophrenia demonstrated decreased phosphomonoester and increased phosphodiester levels in the prefrontal regions. Findings in medicated patients with chronic illness have been inconsistent (Reference Williamson, Drost, Glen and HorrobinWilliamson & Drost, 1999). With optimised 31P–MRS three-dimensional chemical shift imaging at 4 Tesla, we obtained adequate spectral and spatial resolution to measure individual metabolites involved in energy or membrane metabolism from small voxels (15 cm3) in vivo (Reference Jensen, Drost and MenonJensen et al, 2002a ). Our hypothesis was that increased membrane breakdown occurs in the anterior cingulate of people with first-episode schizophrenia (compared with controls), consistent with the increased glutamate-mediated activity seen with proton MRS (1H–MRS) in such patients (Reference Theberge, Bartha and DrostTheberge et al, 2002). The hypothesis also predicts decreased membrane metabolite levels in hippocampal, thalamic and cerebellar regions, consistent with neurodevelopmental abnormalities (Reference Lipska and WeinbergerLipska & Weinberger, 1993; Reference JonesJones, 1997).
METHOD
Participants
Fifteen patients with first-episode schizophrenia and 15 healthy volunteers of comparable age, gender, handedness and parental educational level (Table 1), rated as in our previous study (Reference Jensen, Al-Semaan and DrostJensen et al, 2002b ), participated in the study after giving informed, written consent according to the guidelines of the Health Sciences Research Ethics Board at the University of Western Ontario. The DSM–IV diagnosis of schizophrenia (American Psychiatric Association, 1994) was established using the Structured Clinical Interview for DSM–IV (SCID; Reference First, Spitzer and GibbonFirst et al, 1997), administered by a psychiatrist (P.C.W.). Twelve cases were classified as having paranoid schizophrenia and three as having undifferentiated schizophrenia. Ten patients were neuroleptic-naïve, but three of the ten had received a benzodiazepine for sedation at the time of the scan and another three had been previously exposed to a selective serotonin reuptake inhibitor. Of the five patients receiving neuroleptic medication at the time of the scan, four were taking atypical antipsychotic agents and one a conventional neuroleptic, with two patients having had prior exposure to a selective serotonin reuptake inhibitor. The estimated mean duration of exposure to antipsychotic medication at the time of scanning for the five patients was 0.4 (s.d.=0.4) years. Ratings of symptoms on the Scale for the Assessment of Negative Symptoms (SANS; Reference AndreasenAndreasen, 1984a ) and the Scale for the Assessment of Positive Symptoms (SAPS; Reference AndreasenAndreasen, 1984b ) were 39 (s.d.=11) and 28 (s.d.=17), respectively. Mean duration of untreated psychosis since the onset of positive symptoms was 0.7 (s.d.=0.7) years (Reference Norman and MallaNorman & Malla, 2001). The healthy volunteers were recruited from the community by advertisement and were assessed by a psychiatrist (P.C.W.) using the SCID to exclude psychiatric diagnoses or a history of psychiatric disorders in a first- or second-degree relative. No patient or volunteer had a history of head injury or of drug or alcohol misuse in the 2 years before the scan, or had any current serious medical illness.
Table 1 Characteristics of the study participants
| Control group | Schizophrenia group | |
|---|---|---|
| Gender (n) | ||
| Male | 13 | 13 |
| Female | 2 | 2 |
| Right-handed (n) | 15 | 14 |
| Age, years (mean (s.d.)) | 22.1 (3.0) | 22.5 (3.4) |
| Parental education1 (mean (s.d.)) | 3 (1) | 3 (1) |
| Length of illness, years (mean (s.d.)) | 0.7 (0.7) | |
| Total SANS score (mean (s.d.)) | 39 (11) | |
| Total SAPS score (mean (s.d.)) | 28 (17) |
Imaging technique
All experiments were performed on a 4.0 Tesla Varian/Siemens/Unity Inova whole-body magnetic resonance scanner (Varian, Palo Alto, California, USA: Siemens, Erlangen, Germany) operating at 170.3 MHz. A single-tuned, proton quadrature hybrid-birdcage volume head coil was used for shimming and imaging. The individuals to be examined were positioned supine with their heads secured in a Plexiglas cradle and the global water resonance was manually shimmed. A two-dimensional fast low-angle shot imaging sequence acquired anatomical, sagittal and coronal images of the brain for 31P voxel positioning (repetition time 11 ms, echo time 6 ms, 256 phase-encodes, 0.93 mm × 0.93 mm pixels). Thirty-two T 1-weighted transverse images were acquired on the brain using a magnetisation-prepared (adiabatic inversion pulse 0.5 s prior to data collection) three-dimensional fast low angle shot imaging sequence (repetition time 11 ms, echo time 6.2 ms, total acquisition time <3 min) with a nominal slice thickness of 4.375 mm and 1.09 × 1.09 mm in-plane resolution. These images were used to calculate grey matter, white matter and cerebrospinal fluid ratios in the 31P chemical shift imaging volumes.
Image segmentation and partial volume estimation
The transverse image data-set for each brain examined was first separated into three distinct binary tissue maps – grey matter, white matter and cerebrospinal fluid – by thresholding the original high-contrast image set. Two thresholding values were obtained from the central slice of each image set, which best displayed the ventricles, corpus callosum and grey matter of the anterior cingulate. The thresholding coefficients were then varied until each segmented image type matched the corresponding anatomy in the original reference image. The thresholding values differed between the individuals examined since image signal intensity depended on receiver gain and coil loading. Extraneous tissue with signal intensities similar to neural tissue or cerebrospinal fluid, such as skin and subcutaneous lipid, was removed from the segmented images using commercial software (Analyze 4.0 for PC; Biomedical Imaging Resources, Mayo Clinic) to avoid it being counted as neuronal tissue in the final volumetric analysis. To obtain the tissue ratio contribution for each 31P region of interest, the three segmented image datasets were convolved with the calculated three-dimensional point spread function of the 31P chemical shift imaging acquisition (Reference Jensen, Drost and MenonJensen et al, 2002a ). The partial volume contribution for each tissue type was then expressed as a percentage of total tissue contribution for each region of interest (see Table 3).
Table 3 Voxel tissue partial volume estimates for brain regions predicted to show differences in phosphomonoester and phosphodiester levels between groups
| Region | Grey matter partial volume fractions (%) | White matter partial volume fractions (%) | Cerebrospinal fluid partial volume fractions (%) | |||
|---|---|---|---|---|---|---|
| Schizophrenia group mean (s.d.) | Control group mean (s.d.) | Schizophrenia group mean (s.d.) | Control group mean (s.d.) | Schizophrenia group mean (s.d.) | Control group mean (s.d.) | |
| Anterior cingulate | 43 (11) | 44 (16) | 39 (19) | 52 (16) | 17 (17) | 4 (3) |
| Left thalamus | 11 (10) | 5 (3) | 87 (11) | 93 (4) | 2 (2) | 1 (1) |
| Right thalamus | 11 (11) | 5 (3) | 87 (12) | 93 (4) | 2 (2) | 2 (1) |
| Left cerebellum | 26 (18) | 29 (20) | 72 (21) | 70 (20) | 3 (4) | 1 (1) |
| Right cerebellum | 28 (19) | 35 (21) | 69 (20) | 64 (21) | 2 (2) | 2 (2) |
| Left hippocampus | 23 (18) | 19 (16) | 74 (23) | 79 (16) | 4 (7) | 2 (1) |
| Right hippocampus | 21 (17) | 22 (17) | 77 (19) | 77 (17) | 2 (4) | 1 (1) |
| Left prefrontal | 38 (12) | 35 (8) | 52 (20) | 62 (10) | 10 (18) | 3 (4) |
| Right prefrontal | 42 (21) | 33 (9) | 45 (27) | 65 (9) | 13 (21) | 2 (3) |
In vivo 31P–MRS
Once the 1H shimming and imaging were completed, the 1H head coil was manually replaced with a single-tuned, 31P quadrature, 14 cm long birdcage head coil, with the person to be examined still in place in the Plexiglas cradle inside the magnet. Previous phantom experiments verified that manual coil replacement did not affect the shim. A 31P external reference standard – methylene diphosphonic acid, 270 mol/l, T 1 at 4.0 Tesla about 6 s – was fastened to the Plexiglas head cradle just to the left of the person's head. The 1.5 cm diameter reference tube was positioned so its length ran axially, spanning the sensitive region of the 31P radio frequency coil. Transmit/receive frequency was centred on phosphocreatine, as measured with a global free induction decay. Tip angle, optimised for the phosphomonoester/phosphodiester resonances at a 500 ms repetition time, was 32°. In vivo 31P–MRS used an optimised three-dimensional chemical shift imaging sequence (Reference Jensen, Drost and MenonJensen et al, 2002a ): repetition time 500 ms; sampling bandwidth ± 2 kHz; complex points 1600; readout duration 400 ms; pre-pulses 20; receiver gain 94 dB; pre-acquisition delay 1.905 ms; field of view (x,y,z) 280 mm; nominal volume 5.4 cm3; maximum phase-encode matrix dimension (x,y,z) 14 × 14 × 14 (zero-filled out to 16 × 16 × 16 prior to reconstruction). The three-dimensional chemical shift imaging sequence used a reduced phase-encoding scheme allowing for the inclusion of spherically bound, reduced point, weighted k-space acquisition, providing approximately 40% more signal-to-noise for a given scan time and effective voxel volume over conventional methods (Reference Jensen, Al-Semaan and DrostJensen et al, 2002b ).
In vivo post-processing and spectral analysis
All in vivo chemical shift imaging/image data were processed and viewed using Varian Nuclear Magnetic Resonance software (version 6.1B) and software designed and written on site. Prior to fast Fourier transform reconstruction to spatially resolve the chemical shift imaging spectra, the collected k-space data were centred in a 16 × 16 × 16 cubic matrix. Each time-domain free induction decay was then zero-filled out to 2048 complex points and left-shifted 5 points to remove residual bone and rigid membrane signal.
Using the 1H images, the three-dimensional chemical shift imaging data grid was shifted in the x, y and z dimensions in order to position each voxel in the appropriate 31P region of interest. For all brains examined, the Brodmann area and Talairach coordinates for voxel centres (x,y,z) were evaluated for every 31P region of interest using statistical parametric mapping (Table 2). Partial overlap with adjacent structures was unavoidable in many of the regions owing to voxel volume and shape (Fig. 1).
Table 2 Brodmann areas and Talairach coordinates for regions of interest
| Region | Brodmann area | Talairach coordinates1 | ||
|---|---|---|---|---|
| x | y | z | ||
| Anterior cingulate | 32 | 0 | 44 | 2 |
| Posterior cingulate | 23 | 0 | — 48 | 26 |
| Left prefrontal | 10 | — 22 | 42 | 2 |
| Right prefrontal | 10 | 22 | 42 | 2 |
| Left thalamus | — 9 | — 11 | 5 | |
| Right thalamus | 9 | — 11 | 5 | |
| Left parieto-occipital | 39 | — 31 | — 56 | 26 |
| Right parieto-occipital | 39 | 31 | — 56 | 26 |
| Left cerebellum | — 20 | — 61 | — 26 | |
| Right cerebellum | 20 | — 61 | — 26 | |
| Left hippocampus | — 24 | — 29 | — 12 | |
| Right hippocampus | 24 | — 29 | — 12 | |

Fig. 1 Voxel positions: regions of interest displayed on transverse localiser images. (A) Prefrontal, 1; anterior cingulate, 2; parieto-occipital, 3; posterior cingulate, 4. (B) Thalamus, 5; hippocampus, 6. (C) Cerebellum, 7. Corresponding voxel positions are displayed on sagittal (D) and coronal images (E, F). Effective voxels shown represent actual size with respect to images and are 3.1 cm in diameter (15 cm3 volume).
All in vivo spectra were fitted in the time domain using a non-linear, iterative fitting program developed on site (Fig. 2). The fitting routine is based on the Marquardt–Levenberg algorithm, using prior spectral knowledge for the relative amplitudes, line widths, line shapes, peak positions and J-coupling constants to model the in vivo 31P brain spectrum (Reference Jensen, Drost and MenonJensen et al, 2002a ). Since it was positioned along the inner face of the coil, the reference standard was subject to different radio frequency power from that used for the brain, and was volume-bound by the x and y tube dimensions (1.5 cm diameter), both requiring correction. Therefore, the methylene diphosphonic acid reference area, modelled with a triplet structure, was corrected for T 1 saturation, radio frequency coil sensitivity and volume. Each 31P metabolite area was also T 1-corrected and then normalised to the methylene diphosphonic acid signal to obtain absolute millimolar values per unit of wet brain-tissue volume (mol/l) for each 31P metabolite (Reference Jensen, Drost and MenonJensen et al, 2002a ). Human in vivo 31P high-energy phosphate metabolite T 1 values at 4.0 Tesla for inorganic phosphate, phosphocreatine and adenosine triphosphate of 3.06 s, 2.98 s and 1.07 s were used for the T 1 correction, as well as T 1 values of 2.68 s, 1.5 s, 3.92 s, 3.99 s and 2.31 s for phosphoethanolamine, phosphocholine, glycerophosphoethanolamine, glycerophosphocholine and membrane phospholipids, respectively (Reference Jensen, Drost and MenonJensen et al, 2002a ). The fitted metabolite amplitudes are not T 2-weighted since the fitting algorithm extrapolates back to time zero. Each 31P metabolite value was finally corrected for cerebrospinal fluid partial volume fraction assuming phosphate concentration in cerebrospinal fluid to be negligible. There was no correction for the ratio of grey to white matter.
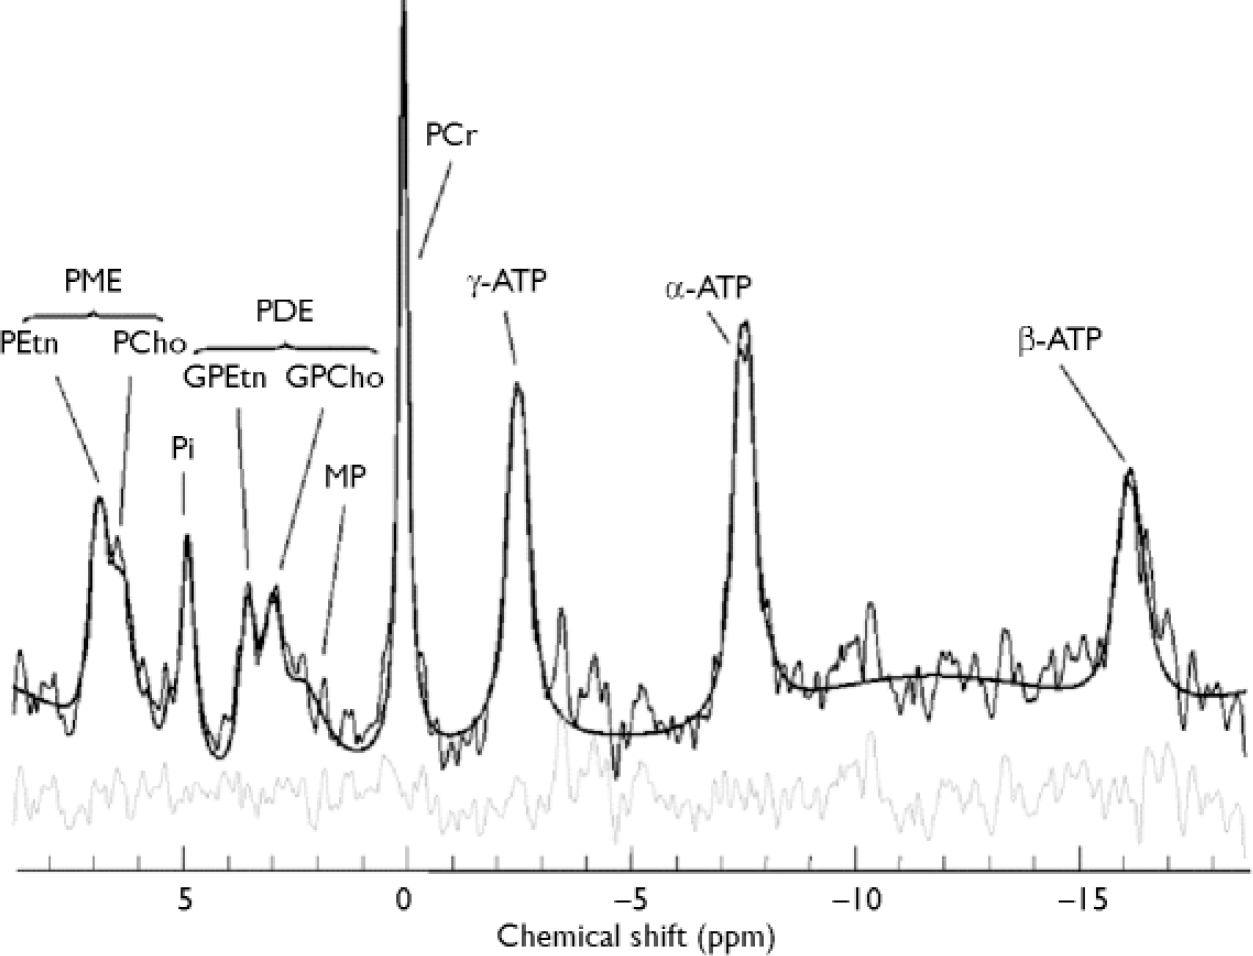
Fig. 2 In vivo 31P brain spectrum from a 15 cm3 effective voxel in the left thalamus of a healthy volunteer at 4 Tesla. Raw data are displayed with modelled fit and residual; 10 Hz exponential filtering has been applied for display. ATP, adenosine triphosphate; GPCho, glycerophosphocholine; GPEtn, glycerophosphoethanolamine; PCho, phosphocholine; PCr, phosphocreatine; PDE, phosphodiester; PEtn, phosphoethanolamine; Pi,inorganic phosphate; PME, phosphomonoester; ppm, parts per million; MP, membrane phospholipids.
Statistics
Statistical calculations were performed using the Statistical Package for the Social Sciences, version 10.0 for Windows. A two-tailed t-test was used to test for significant differences in age, parental education, grey matter, white matter and cerebrospinal fluid partial volumes between groups (P < 0.05). In the same fashion as in our previous study (Reference Jensen, Al-Semaan and DrostJensen et al, 2002b ), statistical treatment of all ten 31P metabolite ratios for each region first involved a one-factor multivariate analysis of variance (MANOVA) with a between-subjects factor of group. Pursuant to a significant multivariate test, univariate F-tests were used to examine group differences, with α set at P < 0.05. In each region where significant group differences in 31P metabolites were found, Pearson correlations (P < 0.01) were computed within the patient group between 31P metabolite levels and each of the following variables: SANS and SAPS scores, age, parental education and duration of untreated psychosis.
Our application of the region-wise MANOVA represents an optimal compromise between power and type I error protection. Expanding the analysis to include region as a within-subject factor, resulting in the split-plot factorial MANOVA applied to the vector of the metabolites, unnecessarily complicates the analysis when there are a priori reasons to select the targeted regions (Reference StevensStevens, 1996). The issue of following up a significant MANOVA test, and whether or not to apply Bonferroni correction, has been addressed in the literature (Reference Hummel and SligoHummel & Sligo, 1971; Reference StevensStevens, 1996), justifying the statistical treatment of our data.
RESULTS
No significant difference was found in age, parental education or grey matter voxel tissue partial volumes in any region between groups. Cerebrospinal fluid partial volume fraction was significantly greater in the anterior cingulate of people in the schizophrenia group (P < 0.01), and the white matter partial volume fraction was lower in the right prefrontal cortex in this group (P < 0.05) (Table 3). The MANOVA revealed a significant group difference for metabolite concentrations in the anterior cingulate (F=2.375, d.f.=19,19, Wilks's λ=0.444; P=0.050). The results for the univariate tests from the anterior cingulate, as well as from other regions predicted to show significant group differences in metabolite levels, but which did not reach multivariate significance, are listed in Table 4. No significant correlation between 31P metabolites and covariates was found in either region in the patient group.
Table 4 Comparison of 31P metabolite values in the two study groups (values are given only for selected brain regions where membrane metabolite differences would be predicted by our hypothesis)
| Region and metabolite | Metabolite concentration (mmol/l) | F (d.f.=1,28) | P | |
|---|---|---|---|---|
| Schizophrenia group mean (s.d.) | Control group mean (s.d.) | |||
| Anterior cingulate | ||||
| Glycerophosphocholine | 1.22 (0.31) | 0.82 (0.33) | 13.332 | 0.001** |
| Phosphocreatine | 2.76 (0.83) | 2.10 (0.53) | 7.181 | 0.012* |
| Inorganic phosphate | 1.45 (0.45) | 1.12 (0.45) | 4.198 | 0.050* |
| γ -Adenosine triphosphate | 1.18 (0.32) | 0.89 (0.28) | 7.849 | 0.009** |
| β -Adenosine triphosphate | 0.95 (0.25) | 0.76 (0.23) | 5.030 | 0.033* |
| Left thalamus | ||||
| Phosphoethanolamine | 0.50 (0.25) | 0.64 (0.19) | 3.064 | 0.091 |
| Phosphocholine | 0.22 (0.13) | 0.36 (0.16) | 4.254 | 0.049 |
| Glycerophosphoethanolamine | 0.39 (0.21) | 0.56 (0.21) | 4.553 | 0.042 |
| Glycerophosphocholine | 0.78 (0.26) | 0.85 (0.39) | 0.493 | 0.488 |
| Membrane phospholipids | 0.90 (0.60) | 0.93 (0.56) | 0.163 | 0.689 |
| Left hippocampus | ||||
| Phosphoethanolamine | 0.70 (0.13) | 0.77 (0.20) | 1.502 | 0.231 |
| Phosphocholine | 0.32 (0.14) | 0.31 (0.17) | 0.131 | 0.720 |
| Glycerophosphoethanolamine | 0.54 (0.17) | 0.53 (0.26) | 0.128 | 0.723 |
| Glycerophosphocholine | 0.89 (0.20) | 0.78 (0.35) | 0.543 | 0.468 |
| Membrane phospholipids | 1.16 (0.91) | 1.06 (0.59) | 0.178 | 0.676 |
| Left cerebellum | ||||
| Phosphoethanolamine | 0.77 (0.23) | 0.91 (0.21) | 2.422 | 0.131 |
| Phosphocholine | 0.30 (0.14) | 0.40 (0.24) | 1.501 | 0.231 |
| Glycerophosphoethanolamine | 0.53 (0.17) | 0.75 (0.31) | 4.060 | 0.054 |
| Glycerophosphocholine | 0.87 (0.26) | 1.04 (0.39) | 1.315 | 0.262 |
| Membrane phospholipids | 1.56 (0.93) | 1.55 (0.65) | 0.008 | 0.928 |
DISCUSSION
Unlike patients with chronic schizophrenia, people with first-episode illness show increased levels of phosphodiester (glycerophosphocholine) and high-energy phosphates (inorganic phosphate, phosphocreatine and adenosine triphosphate) in the anterior cingulate, suggesting accelerated membrane breakdown and aberrant energy metabolism in this region. It is unlikely that these changes are related to medication, as most of the people investigated had not been exposed to neuroleptics. It is also very unlikely that partial-volume tissue differences contribute to these findings, since the measured metabolite levels were corrected for cerebrospinal fluid partial volume fraction, and no significant difference was found in the grey matter or white matter fractions in any region where metabolite levels differed between groups. The regional distribution of change in phospholipid levels seen in this study of first-episode patients is extremely selective, being restricted to the anterior cingulate. Interestingly, in our earlier study of patients with chronic disease (Reference Jensen, Al-Semaan and DrostJensen et al, 2002b ), one of the more profound alterations in phospholipid levels was also seen in this region.
Interpretation of these findings could lead to several conclusions pertaining to how symptoms of schizophrenia develop and evolve over time. One possible explanation might be that the onset of psychosis as an acute, identifiable event is in fact a process that continues over an extended period. The initial excitatory pathophysiological processes involved in the onset of psychosis may continue in the anterior cingulate, while the degenerative process continues in other regions such as the thalamus or hippocampus, which may have already been damaged early in brain development. Eventually, in the chronic stages of illness, the anterior cingulate experiences so much neurodegeneration that its phospholipid profile resembles that of the neurally damaged thalamus, as we observed in our study of patients with chronic schizophrenia (Reference Jensen, Al-Semaan and DrostJensen et al 2002b ), and is consistent with early neurodevelopmental lesions suggested in these regions (Reference Lipska and WeinbergerLipska & Weinberger, 1993; Reference JonesJones, 1997; Reference AndreasenAndreasen, 1999). Also, this suggested neurodegenerative process fits with the finding of increased glutamate-mediated metabolites with 1H–MRS in the left anterior cingulate (Reference Theberge, Bartha and DrostTheberge et al, 2002) and the reduced tissue volume in this region seen in patients with first-episode disease compared with controls. However, since we are looking at the same metabolites at two discrete time points in different study groups, the question remains whether the hypothetical neurodevelopmental changes in regions such as the thalamus, hippocampus or cerebellum are, in fact, a prerequisite for putative degenerative changes in regions such as the cingulate. More longitudinal human research studies in schizophrenia are needed to support the neurodevelopmental/degenerative model of schizophrenia.
Implications of altered phosphodiester levels
Phospholipase A1 and A2 activity produces the phosphodiester metabolites glycerophosphocholine and glycerophosphoethanolamine. Phosphodiesterase, a catalytic enzyme responsible for the breakdown of phospholipid membrane, also produces glycerophosphocholine and glycerophosphoethanolamine. A decrease in the activity of this enzyme, and/or an increase in phospholipase A1 and A2 activity, can decrease phosphodiester levels in the brain, and may be involved in the development of schizophrenia (Reference Horrobin, Glen and VaddadiHorrobin et al, 1994). However, the increase in glycerophosphocholine seen in the anterior cingulate may suggest a reversal of this mechanism, leading to increased membrane breakdown during the acute stages of the illness and eventual neuronal loss in this region as the illness progresses. This is supported by our earlier study in patients with chronic illness at 4.0 Tesla (Reference Jensen, Al-Semaan and DrostJensen et al, 2002b ), which found decreased glycerophosphoethanolamine levels in the anterior cingulate. Interestingly, no difference in any phospholipid metabolite was detected between groups in either the left or the right prefrontal cortex between the first-episode schizophrenia group and the controls. This contrasts with the results of other studies, which report increased prefrontal phosphodiester levels in first-episode but not chronic illness (Reference Williamson, Drost, Glen and HorrobinWilliamson & Drost, 1999) and decreased phosphodiester levels in drug-naïve (not first-episode) patients in the left frontal lobe (Reference Yacubian, de Castro and OmettoYacubian et al, 2002). However, these earlier studies were conducted at lower field strengths (<2 Tesla), where (unlike 4.0 Tesla imaging) the broad phosphodiester resonance is dominant in the human 31P brain spectrum. This fact, combined with different voxel volumes and analytical techniques might possibly contribute to our different findings regarding the prefrontal cortex. Our 31P–MRS studies of the brains of patients with chronic and first-episode schizophrenia at 4.0 Tesla suggest that the prefrontal cortex may manifest abnormalities in phospholipid metabolism only later in the chronic stages of illness, suggestive of eventual neurodegeneration. Indeed, if neurodegeneration is the primary course of evolution in this illness, then one could speculate that early intervention with neuroprotective agents could halt – or at least slow down – the onset and development of schizophrenic symptoms, lessening the negative social, physical and economic impact of this disease.
Other metabolites
High-energy phosphate changes seen in this study of first-episode schizophrenia occurred in the anterior cingulate, with increased concentrations of inorganic phosphate, phosphocreatine and adenosine triphosphate. Interpretation of this finding is somewhat difficult as adenosine triphosphate levels should remain constant, regardless of the metabolic demands placed on the neural tissue. A decreased metabolic rate might explain the increased phosphocreatine level in this region, since the demand for replenishing adenosine triphosphate levels is reduced and phosphocreatine stores are not being drawn upon, hence the increased levels. One explanation for the increased adenosine triphosphate level in this region might be that there is a mitochondrial dysfunction in these neurons, since the mitochondria are responsible for producing the cell's supply of adenosine triphosphate. Mitochondrial dysfunction in neuropsychiatric disorders has been alluded to in other illnesses yielding changes in adenosine triphosphate levels in the brain, such as depression (Reference Volz, Rzanny and RiehemannVolz et al, 1998). Since schizophrenia has a strong genetic component, mitochondrial dysfunction could at least partially explain the energetic anomalies seen in this and other 31P–MRS studies of schizophrenia (Reference Jensen, Al-Semaan and DrostJensen et al, 2002b ). However, this hypothesis has yet to be tested.
Effect of medication
The effects of neuroleptic and anxiolytic medications on brain phosphorus metabolites warrant further discussion. Two human studies in vivo examining the effect of neuroleptic administration on phosphorus metabolites suggest that phosphodiester levels are decreased in the temporal lobe (Reference Fukuzako, Fukuzako and KodamaFukuzako et al, 1999) and increased in the frontal lobe (Reference Volz, Rössger and RiehemannVolz et al, 1999) with neuroleptic medication. In this study, we observed no differences in phosphodiester levels in either of these regions between groups. However, it cannot be ruled out that phosphodiester level differences in these regions do actually exist, but are masked by the effects of neuroleptics. There are very few studies examining the effects of benzodiazepine medications on brain phosphorus levels. A study by Miranda et al (Reference Miranda, Ceckler and Guillet1990) found that phosphocreatine utilisation is altered in the adult rat brain only after in utero exposure to benzodiazepine ligands. Extrapolating this result to the humans investigated in this study, one can only speculate that phosphocreatine levels might be affected by maternal use of benzodiazepines during pregnancy. However, it is clear that more human research is needed in this area to test this hypothesis.
Spectroscopy limitations
The repetition time used for our 31P–MRS acquisition (500 ms) was very short compared with the measured T 1 values of the phosphorus metabolites. The resulting 31P spectra are therefore T 1-weighted despite radio frequency pulsing at the Ernst angle for a T 1 of 3 s (the average T 1 of phosphomonoester, phosphodiester and phosphocreatine metabolites). It is possible that our observed changes in metabolite levels between groups might partly result from different T 1 values in the affected regions, aside from concentration differences. This is unlikely, however, since T 1 values in people with schizophrenia would have to differ by up to several hundred per cent in order to equalise the metabolite ratios between the groups, and there is no supporting evidence from other studies suggesting that brain phosphorus metabolite T 1 values are altered in schizophrenia.
CLINICAL IMPLICATIONS
-
▪ Marked membrane phospholipid abnormalities are consistently observed in certain focal regions (anterior cingulate) in both chronic and first-episode schizophrenia, suggesting possible involvement of a distinct thalamocortical circuit, with other brain regions gradually becoming involved in the chronic stage of illness.
-
▪ Altered membrane metabolite concentrations observed in this study suggest that schizophrenic symptoms arise from a neurodevelopmental and/or neurodegenerative process.
-
▪ If schizophrenic symptoms arise even partially from a neurodegenerative component, then early intervention with neuroprotective agents might improve the long-term prognosis of patients with schizophrenia by retarding this neurodegeneration in the chronic stages of illness.
LIMITATIONS
-
▪ The study sample size was small.
-
▪ The use of medications might have affected some patients in the first-episode schizophrenia group.
-
▪ The schizophrenia group included people with various schizophrenia subtypes, possibly increasing the measured metabolite standard deviations and therefore hiding what might otherwise have been significant differences.
Acknowledgement
The study was funded by a grant (MT-1078) from the Canadian Institutes of. Health Research.


eLetters
No eLetters have been published for this article.