


1. Introduction
The 16th century was marked by intensifying oceanic voyaging and the creation of new institutions seeking to exert control over the nautical enterprise. These trends emerged early in the Iberian peninsula, and were accompanied by slow but important changes to navigational practice. Instruments, whether novel, adapted or merely employed in new ways, played a key role in this early modern expansion.Footnote 1 One such instrument was the nautical chart, which eventually came under the purview of the Portuguese Armazém da Guiné e da India (hereafter Armazém) and the Spanish Casa de la Contratación (hereafter Casa), the bureaucratic bodies charged with equipping ships before their long-range journeys. Despite an abundance of documentary evidence for the presence and use of charts onboard during this century, few such exemplars are extant. Indeed, in reference to the Spanish context, the existing scholarly consensus is that no chart used at sea during the 16th century has survived.Footnote 2 This state of affairs is typically explained by the damage visited upon charts taken onboard, or by the regular intentional destruction of charts that were out of date. A rare instance of the survival of a chart used at sea and of its twin produced in a more decorative style can be found in a pair of two anonymous and understudied Portuguese charts archived in the United States.
This paper will begin by introducing the charts, sketching their provenance and offering a preliminary assessment of their placenames. It will then argue that they are the work of a single, anonymous Portuguese author based on a single model chart. Next, the physical features of the two artefacts will be employed to discuss the different contexts in which this geographical design circulated. Finally, the possible sources of this design will be considered, among them the Portuguese and Spanish royal pattern charts.
The first of these charts is kept at the University of Texas Ransom Center, and will hereafter be referred to as the Ransom chart. It is a work on parchment with ink and colour, with a single latitude scale bar and single distance scale bar, measuring 63 × 87 cm and showing the coast of West Africa. It was obtained by Harry Ransom (1908–1976), Chancellor of the University of Texas System, for the Humanities Research Center (now Harry Ransom Center) at the University of Texas at Austin from Hans P. Kraus (1907–1988), renowned rare book and map dealer based in New York, in 1969. The chart had previously been owned by George Legge (1648–1691), Baron Dartmouth, British admiral and naval commander-in-chief. Armando Cortesão examined the chart, apparently in the 1950s, and suggested a tentative date of ca. 1520.
The second chart, which shall be called the Bell chart, covers West Africa and a part of Brazil. It is also on parchment with ink and colour, measures 65 × 80 cm, and has been trimmed significantly on its northeast and southeast corners. The provenance of the chart cannot be extended further back than the mid-20th century. In 1953, John Ford Bell (1879–1961) donated his personal collection of rare books dealing with early trade and exploration to be housed in the James Ford Bell Room, located in Walter Library, the University of Minnesota, Minneapolis. The collection was later moved to the Wilson Library, renamed the James Ford Bell Library. Upon his death in 1961, Bell gave the remainder of his rare book collection to the university. The library catalogue gives the date of the Bell chart as ca. 1524.
Though most toponyms on both charts are illegible, some can be made out, particularly with the aid of other charts. Unfortunately, none of the names can confirm or deny the proposed date of ca. 1520 offered by Cortesão for the Ransom chart, nor the ca. 1524 date by the John Ford Bell Library for the Bell chart. Tables A1 and Tables B1 give the toponymy that could be read with confidence on both charts, and are provided at the end of the present paper in the Appendix. The language is primarily Portuguese with occasional Spanish variants, including, on the Bell chart, the designation ‘Co de Buena Esperança’ for the Cape of Good Hope. This name appears to have been added in a different hand after the completion of the chart. A few placenames have been reconstructed, designated by square brackets, with the aid of other Portuguese charts. An asterisk denotes a name written in red ink.
It is striking that on the Bell chart, the phantom island of São Mateus, located south of Cape Palmas, is instead named spiritu santo. This name for the non-existent island is not found on any other chart. São Mateus was commonly shown in the Gulf of Guinea on maps and charts until the 19th century. Another phantom island, maria de costa, apparently a duplicate of Trindade or Martim Vaz, is also shown on the Bell chart. The idiosyncratic pictogram for the island of s. elena (Saint Helena) is seen on Portuguese charts of the South Atlantic throughout the 16th century.
The Amazonian coast of Brazil on the Bell chart also contains some notable toponyms. One appears to be Rio d ioam de lixboa. This placename with variant spellings is commonly seen on charts of Brazil after about 1520, but its origin is uncertain. It may be in reference to the Portuguese explorer, João de Lisboa (c.1470–1525), but he is not known to have sailed the Amazonian coast of Brazil.Footnote 3 On this same northern coast of Brazil is momte dely, likewise frequently encountered on the charts of the 16th century. This seems to be related to Monte d'Eli (Mount Delly, Mount Dilly, Delyn, Mount Eli), modern Ezhimala, the hill on the Malabar Coast that was the first land sighted by Vasco da Gama on his epic voyage to India in 1498, perhaps because a hill on the Amazonian coast reminded someone of the hill in India.Footnote 4
2. Two charts, one model: the links between the charts
In terms of their geographical content, as has been stated, the Bell and Ransom charts are depictions of the Atlantic, mainly to the south of the Strait of Gibraltar, with the coastlines drawn in ink and tinted with green paint. Although only the Bell chart includes the Brazilian coasts, this may be due to the detachment and subsequent loss of a second sheet that would have formed the western half of the Ransom chart. In their present forms, the two charts display the entire western coast of Africa, with the drawing stopping at the same place in South Africa on both: aguada (present-day Mossel Bay), to the east of Cape Agulhas. They also have in common the peculiar design of the southern tip of Africa, in which False Bay is so exaggerated that the region acquires a forked appearance and the coasts from the Cape of Good Hope to Cape Agulhas take on nearly vertical trajectories. A survey of more than 200 extant 16th-century charts of various national origins failed to disclose any other cartographic works with this particular configuration. It may thus be treated as evidence that the two charts share a model. This notion is further supported by another unusual design choice present in both works: the distention of the capes (labelled tres puntas and castelo) framing present-day Shama Bay or Takoradi Bay (rio del yo) in present-day Ghana, creating a veritable crater in the shoreline. Interestingly, it appears that the layout of this stretch of coast was especially problematic for the cartographer of the Bell and Ransom charts, as the treatment of the capes shows slight adjustments. Finally, when the coastlines of one chart are overlaid upon the other at a 1:1 scale, making allowances for the deep creases on the Bell chart, it can be seen that they overlap perfectly (Figure 1), conclusive evidence that both were copied from the same model.

Figure 1. The coastlines of the Bell chart overlaid on the Ransom chart at a 1:1 scale. The edges and location of deep creases on the Bell chart are indicated by pale-grey contours. The hidden circle and ‘hub’ of the main rhumb network are in grey dashed lines
Overlaying the line drawing of West Africa from the Ransom chart on other 16th-century images of the region underscores the intimate connection between the Bell and Ransom charts. While at first glance different cartographers’ renderings of these coasts may seem similar, direct comparison of 17 16th century charts covering at least the African coasts represented in the Bell and Ransom charts shows considerable variation, particularly in eastward or westward trajectory of the shores south of the equator (Figures 2 and 3). Although European knowledge of the African coasts increased throughout the 1500s, extant cartographic representations do not suggest the establishment of a stable, standardised form for the continent, particularly in terms of the east–west relationships between places, attributable, of course, to the impossibility of accurately measuring longitude at sea during the 16th century.

Figure 2. The coasts of the Ransom chart overlaid on the Caverio planisphere of ca. 1504–1505 (Bibliothèque nationale de France, GE SH ARCH-1), such that the compass directions are aligned and the north–south length of the African shores is equal

Figure 3. The coasts of the Ransom chart overlaid on the Bartolomeo Velho chart of 1561 (Instituto e Museo di Storia della Scienza), such that the compass directions are aligned and the north–south length of the African shore is equal. The latitudes of many landmarks are compatible, although the implicit longitudes are different for the south of Africa
The notion that the Bell and Ransom chart were drawn by the same person using the same pattern chart is further demonstrated by the scale bars on the two works. Both are enclosed in a rudimentary scrollwork border, but one clearly made by a person inexperienced in designing ornaments. The illusionistic effect of paper or fabric unfurling required by scrollwork is, on both scale bars, attempted but not achieved. This amateurish element is not likely to have been repositioned and replicated by a copyist, thus it is not likely that the Bell chart is a copy of the Ransom by a different draftsman, or vice versa. Rather, the design appears to be characteristic of a single cartographer.
The means by which both charts were copied from their common model, presumably the Padrão Real in the Armazém, may now be considered. With the African coasts aligned, the compass line network and hidden circle on the two charts do not coincide: the geometrical framework of the rhumb lines, therefore, could not have acted as a grid for replicating the geographical model. Although several methods existed for manuscript chart replication, perhaps the most fool-proof strategy in use in the 16th century was the carbon transfer method described in Martín Cortés's Breve Compendio de Arte de Navegar of 1551 (but used by Italian panel painters since at least the 15th century).Footnote 5 The copyist places a sheet of smoked or charcoal-rubbed paper or parchment, dirty-side-down, on top of a blank sheet. The model chart is then placed atop the two, right-side-up. Using a stylus, the model is traced along its coastlines – wherever the stylus is passed, soot is deposited on the clean sheet, forming a guide to follow while inking the shore. This technique enables the copying of a model at a 1:1 scale without inflicting damage upon the model. Often, traces of the soot from this process are visible on the surface of the finished chart, but careful erasure or subsequent handling or damage to the chart can eliminate or obscure such evidence. Either may be the case with the Bell and Ransom charts, although the possibility remains that another copying method was employed.
3. One model, two contexts of use: differences between the charts
It is now worth turning to the differences between the two charts, and exploring the possibilities for use that might emerge naturally out of an identical pattern. The Ransom chart, currently fragmented and worn, may at the time of its drafting have been more than suitable for display. A semi-circle of subsidiary compass roses curves across its surface, and at its western edge, half of a decorative central rose can be discerned. These roses were originally coloured in alternating blue and red paint, the former having largely flaked off. During the early modern period, rings or semi-circles of subsidiary roses were often associated with luxury charts, and were frequently illuminated. The lack of gold or silver on the roses of the Ransom chart could mean it was a budget-version display chart (indeed, the placenames are hardly calligraphic), a chart that was left unfinished, or simply an expression of the chart maker's or buyer's taste.
The Bell chart, on the other hand, shows no such aesthetic pretences. Instead, inscribed upon its surface are the marks of use at sea: positional fixes (see Figures 4–6). These fixes take the form of a ‘prick’ enclosed within a pencil-drawn ring, or, less often, a square, cross or triangle. In several European navigational texts, the act of fixing one's position upon the chart was expressed with the verb ‘prick’ (or its Romance analogue). The sense of this word has evolved over time. In Lesclarissement de la Langue Francais (1530), John Palsgrave translates ‘pricke a mark’ as marque s fe – there is no requirement that the writing surface be perforated. In Thomas Cooper's Thesaurus Linguae Romanae et Britannicae (1578), the Latin ‘punctus’ is defined as a point: a little prick. The least portion of a thing that can be. The significance of the different shapes on the Bell chart is not clear, although the prick-within-a-circle sign that predominates would become the commonest symbol for a positional fix in the 17th century. Examination of the chart with transmitted light showed that the pricks did not perforate the surface of the parchment.Footnote 6 The fixes are numerous, and must relate to multiple voyages or legs of voyages. None of them, however, have been numbered, dated or connected.Footnote 7 The absence of any system to indicate which fix was made most recently is puzzling, since identifying the ship's last marked position was essential to plotting its current location when navigating out of sight of land. The pilot may have committed to memory which position he had last pricked; always mindful of his location, he might not have needed this information to be made explicit on the chart. In any case, the chart was never necessarily the only means of documenting a journey; logbooks, rutters, coastal sketches, and diaries could, and eventually did, serve as essential complements to the plotting chart. Nor is the seemingly chaotic approach to fixing positions seen on this chart an isolated case. The 1580 chart of England to the Gulf of Finland by William Borough (Greenwich, National Maritime Museum, G215:1/5) is marked in a similar manner, and unlabelled, unconnected fixes can be found on such charts as that of William Blaeu, showing the North Atlantic, with insets of Brazil and the Gulf of Guinea (The Hague, Nationaal Archief, 4.AANW-127), and a late 17th-century Dutch chart of the South Atlantic (Paris, Bibliothèque nationale de France, CPL GE SH 18E PF 121 DIV 2 P 1 RES). The proximity of the majority of the fixes to land (with the open sea parts of the voyage less assiduously tracked) likely indicates that the marks were made as the ship approached terra firma. As this part of navigation could be perilous, it makes sense that it is here that the pilot tracked his position most fastidiously.

Figure 4. Line drawing of the Bell chart showing the locations of unambiguous positional fixes on the Bell chart in blue. Circled islands were pricked

Figure 5 & 6. Details of the Bell chart showing navigational (or positional) fixes to the west of the present-day Namibia and Angola (left) and to the southwest of the Cape of Good Hope (right)
Another notable aspect of these fixes is their clustered arrangement. For this, there could be several explanations. First, the ship could have encountered adverse wind or weather, stalling or diverting its progress. The group of fixes to the west of Namibia, for instance, could result from difficulties locating Saint Helena Island, a source of fresh water, on a return voyage from India. Second, the clusters could come about through repeated use of the same chart; we can imagine that after every voyage, the tracks of the previous journey were erased just enough for there to be some contrast between new fixes and those of past voyages. Although the value of the marks now appears mostly uniform, this could be due to the equalising effect of a cycle of erasure–inscription–erasure. Albeit from much later, and with fixes connected by lines, a similar clustering can be observed in the environs of the Strait of Gibraltar on an 18th-century chart used by the Portuguese coast guard.Footnote 8
4. Portuguese chart production and sources for the Bell–Ransom design
Since both the majority of its toponymy and the regions to which it documents navigation pertain to Portugal, the Bell chart's production and use can be reasonably linked to the same, along with the Ransom chart. We may now broadly sketch that context, albeit with the regrettable limitations imposed by the lack of a precise date for either chart's drafting. From at least 1517, Portuguese ships of the Carreira da Índia (the India Run) were provided with two charts, which were to be handed back to the responsible officer of the Armazém upon their return to Lisbon.Footnote 9 This system both implies the use of pattern charts as a matter of efficiency, and perhaps also that mariners were encouraged to document their voyage and make amendments to their charts. By the mid-16th century, the Armazém was no longer content to leave to sailors the decision of which chart to use at sea: their charts were required to be certified copies of the padrão d'el-Rey (the royal pattern chart). Licensed chart-makers (mestres de cartas de marear), too, were sworn to only produce charts in conformity with the royal pattern and to submit all charts for evaluation, lest they face punitive measures. Authorised charts were, moreover, to be signed by the Cosmografo-mor (Chief Cosmographer). The stipulation that pilots must use official charts suggests that by the 1550s, competing chart purveyors using their own models were plentiful and a threat to the Armazém. As Antonio Sánchez has noted, at least six private workshops existed in Lisbon by around 1552, and charts made according to alternative models could still be readily acquired at the end of the 16th century.Footnote 10 Thus, though the Bell chart was used at sea, it is by no means certain that its design was lifted from the padrão d'el-Rey, regardless of when in the century it was produced. The absence of a signature from the Cosmografo-mor likewise says little about the source of its design: first, because the chart may have been produced prior to stringent verification requirements from the Armazém, and second, because the areas of the chart most likely to bear this inscription have been trimmed away.
With that said, echoes of the Bell–Ransom Africa design (excepting the peculiarities discussed previously) may be found in the 1525 Castiglione planisphere attributed to Diogo Ribeiro (Modena, Biblioteca Estense Universitaria, C.G.A.12), and the 1529 planisphere by the same (Vatican, Biblioteca Apostolica Vaticana, Borg. carte. naut. 1), with both latitudes and apparent longitudes of geographical landmarks in general agreement (Figure 7). This is an indirect relationship, though; the differences in detail are too great to suggest one author copied another outright. We might attribute this overall similarity to either of two scenarios: (1) our anonymous author modelled his work after now-lost charts drafted by (or copied from) Ribeiro, or (2) Ribeiro drew upon the same sorts of cartographic models as our anonymous author. If Ribeiro is, ultimately, a source for the Bell–Ransom design, we might reasonably ask where Ribeiro got his ideas about the geography of West Africa. While it has been argued that his planispheres derive directly from the Spanish padrón, this does not mean Ribeiro's work consisted solely in creating attractive manuscript facsimiles of the pattern chart. Since Ribeiro himself had sailed the Carreira, and later participated in high-level cosmographic and cartographic discussions, he could have had a hand in shaping the Spanish padrón, particularly for the regions in which he had first-hand experience. Nor was his output confined to planispheres; throughout his Spanish career, Ribeiro continued to maintain a private business in charts and instruments. Thus, it is easy enough to envision how one of Ribeiro's charts could fall into Portuguese hands even after his emigration to Spain, perhaps via a Portuguese sailor employed by the Casa de la Contratación.Footnote 11
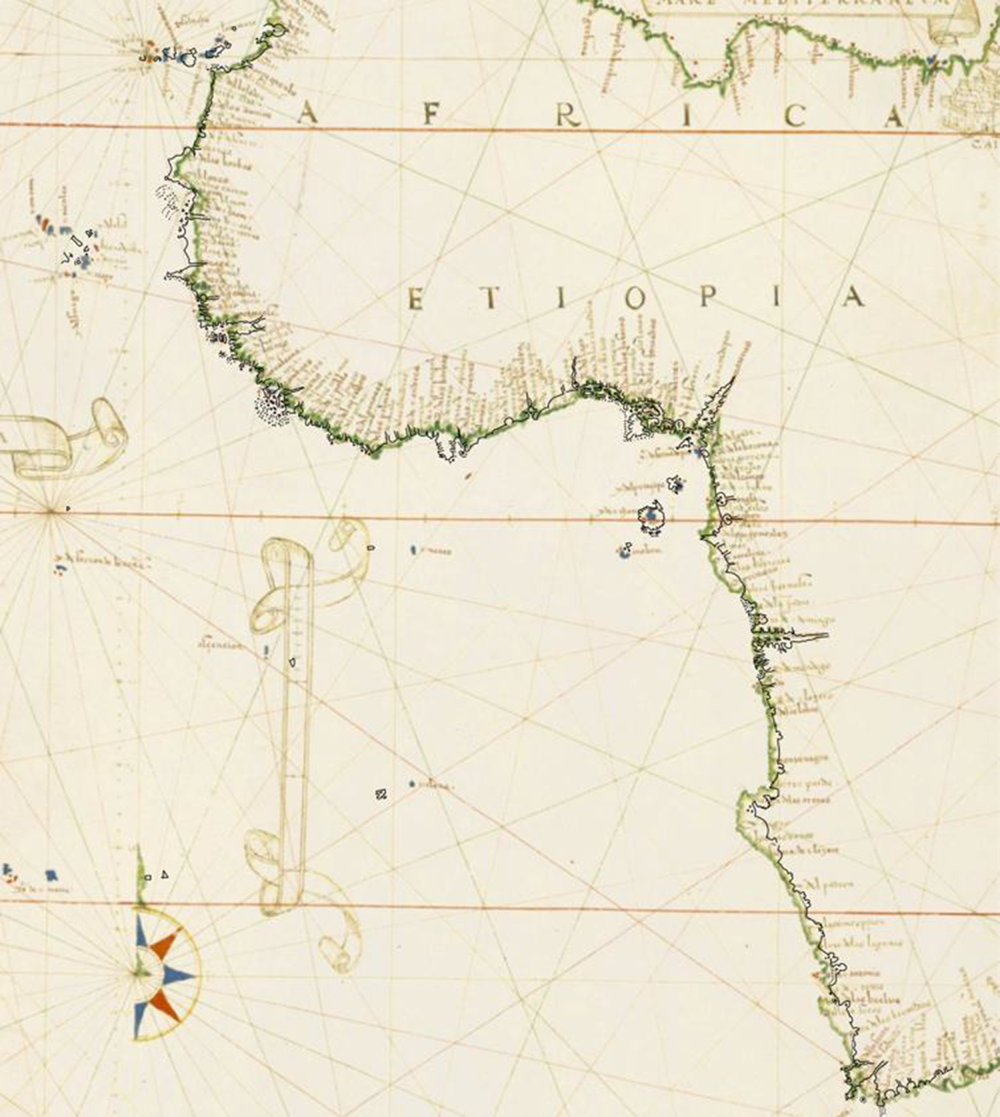
Figure 7. The coastlines of the Ransom chart overlaid on the Castiglioni planisphere of 1525 such that the north–south length of Africa is equal and the compass directions aligned
If, instead, the charts are alike because Ribeiro and our anonymous author borrowed from the same cartographic models, we must assume that Ribeiro took pains to base his planispheres on the best available charts of Africa. These would likely be Portuguese-made, considering their political and economic interests in southwest African navigation and the rights conferred by the Treaty of Tordesillas of 1494. Perhaps Ribeiro would even seek, for his reference material, copies of the padrão. The similarity between Ribeiro's work and the Bell and Ransom charts would then be a consequence of their shared connection to the Portuguese royal pattern chart. Whatever the case, the very fact of their geographical comparability further demonstrates the mobility of geographical information across national borders, the mechanisms of its transformation, and the possibility (shown by the Bell and Ransom charts) for mapmakers working in a manuscript tradition to achieve precise reproductions of their chosen geographic model.
5. Closing remarks
Although many questions concerning these two charts remain intractable, this paper has sought to provide an introduction to their relationship and probable uses. These objectives, if modest, are justified by the extreme rarity of extant 16th-century charts used at sea. Likewise, this study hopes to suggest future avenues for research, both with respect to the Bell and Ransom charts and more generally. The most obvious among these directions would be the application of imaging technology to digitally restore the legibility of the placenames. It is possible that, particularly for the shores of Brazil, a more complete transcription of the toponymy could enable more precise dating. As matters stand, the Bell and Ransom charts can only be confidently dated to ca. 1520–1575. Also of interest would be a deepening of the provenance for either chart. It is curious that the Bell chart, which is devoid of any artistic content, would survive both destruction or recycling when it fell behind the times. The changes to the coasts on the Bell chart, moreover, invite reflection upon the ways charts were corrected, since here one may see this process in action. And finally, the means by which positions were fixed on this chart, which seems so alien to the systematic tracking later witnessed in the charts of the Dutch East Indies Company, shows the need for further interrogation of the ways early modern mariners used their charts in practice.
Acknowledgment
This research was made possible with support from the European Research Council (ERC) under the European Union's Horizon 2020 research and innovation programme (grant agreement n° 714033-MEDEA-CHART/ERC-2016-ST G).
Competing interests
None.
APPENDIX A
Table A1. Bell Chart & Ransom Chart – African Placenames

APPENDIX B
Table B1. See caption for next page


