


1. Introduction
Glaciers high on the Tibetan Plateau act as reservoirs which supply water to some of Asia's largest rivers. Glacier behaviour is therefore an important control on the hydrological regime of the planets highest mountain plateau, as well as river systems in one of the planets most populous regions. Glaciers across the majority of Tibetan Plateau have been receding and thinning in recent decades (Zhou and others, Reference Zhou, Li, Li, Zhao and Ding2018; Bolch and others, Reference Bolch, Wester, Mishra, Mukherji and Shrestha2019; Shean and others, Reference Shean2020; Yao and others, Reference Yao2022), thus their role as a reliable water source in the Asian water tower may diminish in decades to come (Huss and Hock, Reference Huss and Hock2018; Rounce and others, Reference Rounce, Hock and Shean2020). The spatially heterogeneous pattern of glacier recession and mass loss generally mirrors the interplay between different climatic regimes and variable levels of warming across the Plateau (Yao and others, Reference Yao2022). In the west and along the northern sectors, glaciers have lost little mass since the 1970s (Bolch and others, Reference Bolch, Wester, Mishra, Mukherji and Shrestha2019), with mid-latitude winter westerlies, which supply glaciers with substantial amounts of winter accumulation, and limited temperature increases maintaining balanced glacier mass budgets. Mountain ranges along its southern and eastern sectors host glaciers that have lost substantial mass since the 1960s and 70s, the rate of which has consistently increased (King and others, Reference King, Bhattacharya, Bhambri and Bolch2019, Reference King, Bhattacharya and Bolch2021; Maurer and others, Reference Maurer, Schaefer, Rupper and Corley2019; Bhattacharya and others, Reference Bhattacharya2021). While temperature increases explain a large portion of recent ice loss in the south and east of the region, temporal and spatial variability in ice loss rates, which seem somewhat decoupled from consistent increases in temperature, have been documented in different regions of High Mountain Asia (Bhattacharya and others, Reference Bhattacharya2021). For example, King and others (Reference King, Bhattacharya and Bolch2021) showed high mass loss from glaciers of the Geladandong Ice Caps in the decades following pronounced surge events, when large volumes of ice have been transported to lower, ablation-prone elevations. Similarly, lake-terminating glaciers in the Himalaya have been shown to display a phase of higher mass loss than their land-terminating counterparts while experiencing the same changes in climate (Brun and others, Reference Brun2019; King and others, Reference King, Bhattacharya, Bhambri and Bolch2019; Maurer and others, Reference Maurer, Schaefer, Rupper and Corley2019). Such observations show that additional drivers must be considered if we are to understand glacier behaviour in detail across the Tibetan Plateau. This is important because regional mass loss projections often incorporate simplified parameterisations of glacier dynamics or energy balance which may not capture glacier behaviour not driven primarily by climatological factors (e.g. Hock and others, Reference Hock2019; Rounce and others, Reference Rounce2023).
In this study, we examine the behaviour of glaciers along the length of the Tanggula Shan (Tanggula mountains) in the central-east Tibetan Plateau. The Tanggula Shan span ~500 km from the central Tibetan plateau in a south easterly direction towards the Hengduan Shan/Eastern Nyainqentanghla regions at the eastern edge of the Himalaya. The study area is glacierised in three distinct ways (Fig. 1). The Geladandong Ice Caps sub-region is located at the western edge of the study area and contains ~400 km2 of glaciers. The Dongkemadi sub-region is located on the central spine of the Tanggula Shan, along with >575 generally smaller (mean size 0.64 km2 in 2019) clean ice, land-terminating glaciers. This sub-region includes the Xiao (small) Dongkemadi benchmark glacier, from which a time series of field-based mass-balance measurements have been collected. The Bugyai Kangri sub-region sits at the eastern end of the Tanggula Shan. The majority of the glacierised area (131 km2 in 2019) of the Bugyai Kangri Ice Cap is made up of six large outlet glaciers, five of which terminate into proglacial lakes on both the northern and southern side of the main ice divide. Similar diversity in glacier area, hypsometry, terminus type and dynamics are present across the Tibetan Plateau, thus the response of glaciers along the Tanggula Shan to a changing climate will inform on the likely behaviour of other Tibetan Plateau glaciers.

Fig. 1. The location of the Tanggula Shan in central-east Tibetan Plateau. We examine glacier change (dA – glacier area change; dH – glacier surface elevation change) in three sub-regions; the Geladandong Ice Caps (1, hypsometry shown in panel a), around the Xiao Dongkemadi (2, panel b) benchmark glacier and the Bugyai Kangri Ice Cap (3, panel c).
A number of studies have examined the current state and recent evolution of glaciers in different sub-regions of the Tanggula Shan. Duan and others (Reference Duan2019) measured changes in glacier area along the Tanggula Shan between 1969 and 2015 using topographic maps and Landsat satellite images and showed a 20% (−0.5% a−1) reduction in ice cover over this period. Liu and others (Reference Liu, Guo, Nie, Liu and Xu2016) measured slightly higher area loss rates (−0.63% a−1) between 1990 and 2000, also using Landsat data, around the Bugyai Kangri Ice Cap (Fig. 1). The rate of glacier area loss in the Tanggula Shan is lower than in the southeastern Tibetan Plateau (~0.9% a−1 between the 1970s and 2000s (Yao and others, Reference Yao2022), but is higher than in the interior of the plateau (Junfeng and others, Reference Junfeng2014; Liu and others, Reference Liu, Guo, Nie, Liu and Xu2016). Several geodetic studies have shown how glaciers around the mountain ranges of the two largest ice caps, the Geladandong Ice Caps, have lost mass at a substantial rate recently (Liu and others, Reference Liu2020; Shean and others, Reference Shean2020; Chen and others, Reference Chen2021; Hugonnet and others, Reference Hugonnet2021; King and others, Reference King, Bhattacharya and Bolch2021) and that the contemporary rate of ice loss is much greater than a variety of earlier time periods starting in the 1960s and 70s (Chen and others, Reference Chen2017; King and others, Reference King, Bhattacharya and Bolch2021). Kang and others (Reference Kang2015) examined an ice core extracted from ~5800 m a.s.l. on Guoqu Glacier, on the northern edge of the eastern Geladandong Ice Cap, and suggest that no net accumulation has occurred here since the 1980s. Glacier surging has persisted across the two Geladandong Ice Caps despite recent increases in ice mass loss (Duan and others, Reference Duan2019; Chen and others, Reference Chen2021; Gao and others, Reference Gao2021). Surging around the Geladandong Ice Caps has caused substantial variability in the rate of ice loss from individual glaciers, but does not appear to have substantially impacted sub-regional ice loss rates (King and others, Reference King, Bhattacharya and Bolch2021).
The mass balance of glaciers elsewhere in the Tanggula Shan has been estimated with less certainty. In situ mass-balance measurements have been carried out since 1989 at Xiao Dongkemadi Glacier in the centre of the Tanggula Shan (Fig. 1) and show a transition to negative mass balance around 1995, which has steadily declined since (Kang and others, Reference Kang2015). The mean rate of ice mass loss on this glacier was ~−0.3 m w.e. a−1 between 1989 and 2015 (Kang and others, Reference Kang2015). Using geodetic methods (digital elevation model (DEM) differencing), the geodetic mass-balance estimates generated by Shean and others (Reference Shean2020) show the mass balance of Xiao Dongkemadi Glacier to have been −0.50 ± 0.04 m w.e. a−1 from 2000 to 2018, suggesting increased ice mass loss rates have also occurred in the centre of the Tanggula mountain range recently. Chen and others (Reference Chen2017) combined DEMs derived from topographic maps, the Shuttle Radar Topographic Mission (SRTM) mission and the Advanced Spaceborne Thermal Emissivity Radiometer (ASTER) imagery to examine the mass balance of subsamples of glaciers along the range across two broad time periods (1969–2000, 2000–2015) and suggest large (0.4–0.5 m w.e. a−1) increases in ice mass loss rates, albeit with substantial associated uncertainties (0.04–0.38 m w.e. a−1). Observations at the closest weather stations (Tuotuohe, ~100 km away at 4500 m a.s.l.; Nag Qu, 180 km, 4600 m a.s.l.; Dengqen, 100 km, 3850 m a.s.l.) suggest gradual temperature increases have occurred along the length of the Tanggula Shan, while changes in precipitation vary along different parts of the mountain range (Duan and others, Reference Duan2019). Temperature increases measured at these weather stations (1.01–2.12°C) since 1969 will be replicated or exceeded under conservative RCP scenarios (Kraaijenbrink and others, Reference Kraaijenbrink, Bierkens, Lutz and Immerzeel2017) and so glacier recession along the Tanggula Shan will likely continue.
In this study, we extend the multi-temporal observations of glacier change that have occurred along the Tanggula Shan over the last 50 years. We aim to accurately characterise the variability of glacier mass and glacier flow change along the mountain range, along with changes in temperature and precipitation over comparable time periods. Using these observations, we examine the main factors which have driven glacier recession in the Tanggula Shan since the 1960s. We use these observations to discuss the behaviour of different glacier types in response to a changing climate and how this may reflect glacier behaviour across the Tibetan Plateau more broadly.
2. Data and methods
Our observations of glacier change along the Tanggula Shan are based on a variety of remotely sensed optical satellite imagery. Over the Geladandong Ice Caps, we used the results from King and others (Reference King, Bhattacharya and Bolch2021), who examined changes in glacier area, glacier mass and glacier surface velocity over two time periods spanning 1969–2017, using declassified Corona imagery, contemporary stereo satellite scenes and the ITS_LIVE archive of glacier surface velocity measurements (Gardner and others, Reference Gardner, Fahnestock and Scambos2020). Over the Dongkemadi and Bugyai Kangri sub-regions, we used additional stereo imagery from the Corona KH-4A, Satellite Pour l'Observation de la Terre 5 (SPOT-5) and ASTER satellite sensors to generate DEMs from coincident time periods (Table 1). We used these DEMs to examine glacier surface elevation change and to derive geodetic glacier mass-balance estimates. We produced orthoimages from the optical satellite data used in DEM generation, along with Landsat imagery from the ETM+ and OLI sensors to generate multitemporal glacier inventories spanning the period 1969–2018 and to examine glacier area fluctuations.
Table 1. Remotely sensed data sources used in DEM generation, glacier mapping and glacier surface velocity analyses for each sub-region

BK, Bugyai Kangri; DKM, Dongkemadi; GE, Geladandong.
Data sources used by King and others (Reference King, Bhattacharya and Bolch2021) over the Geladandong sub-region also listed.
We combine glacier surface velocity data from two independent time series (Sentinel-1 SAR (Friedl and others, Reference Friedl, Seehaus and Braun2021) and Landsat ITS_LIVE (Gardner and others, Reference Gardner, Fahnestock and Scambos2020)) to examine fluctuations in the rate of ice flow over the Tanggula Shan between 2000 and 2021. We also integrate our measurements of glacier area, glacier mass and glacier velocity change, with the analysis of meteorological observations from the nearby Tuotuohe weather station, covering the period 1960–2018, as well as ERA5-Land reanalyses data covering the period 1960–2018. We combine these two meteorological datasets to represent the changing climate along the Tanggula Shan and examine potential climatic drivers of glacier mass budget change.
2.1 Glacier area mapping
We used the Randolph Glacier Inventory version 6.0 (RGI Consortium, 2017) as the baseline for our glacier inventory and manually modified these shapefiles to reflect glacier extents at different time periods. We used Corona KH-4A orthoimages, orthoimages generated during ASTER and SPOT DEM generation, pan-sharpened (using the panchromatic band and a Brovey transformation) Landsat ETM+ and Landsat OLI scenes with little seasonal snow or cloud coverage to inform on glacier area from the 1960s to 2019.
2.2 DEM generation and mass-balance derivation
We generated DEMs from raw ASTER L1A imagery using the AMES Stereo Pipeline (ASP), which was originally developed by the National Aeronautics and Space Administration (NASA) and later adapted by Shean and others (Reference Shean2016). Raw imagery was initially used to generate a Rational Polynomial Coefficient (RPC) camera model and stereo pairs were orthorectified to produce orthoimages of 15 m resolution. A point cloud was produced from the area of overlapping orthoimages using the Semi Global Matching (SGM) algorithm, which was interpolated to produce 30 m DEMs. We generated DEMs from three pairs of ASTER images (Table 1). We also used a pair of SPOT-5 images to generate a DEM over the Bugyai Kangri Ice Cap, again applying ASP, which provided superior data coverage compared to available ASTER images around the intermediate time step in our study period. The KH-4 DEMs were computed using the methodology presented in Ghuffar and others (Reference Ghuffar, Bolch, Rupnik and Bhattacharya2022). Specifically, ground control points (GCPs) were extracted by feature matching between Corona imagery and Landsat-7 ETM+ panchromatic band using SuperGlue (Sarlin and others, Reference Sarlin, DeTone, Malisiewicz and Rabinovich2020). The corresponding elevations of these matched feature points were extracted from SRTM DEM to constitute the GCPs. The GCPs along with the tie points matched between the Corona image pairs were used to estimate camera parameters. A camera model with time-dependent exterior orientation parameters was used to model Corona panoramic image geometry. Epipolar resampling was done using the method of Deseilligny and Rupnik (Reference Deseilligny and Rupnik2020). Dense matching was performed using SGM algorithm. Multiple stereo pairs of Corona were used to compute the DEMs of each region (Table 1).
The precise co-registration of multi-temporal DEMs is required prior to DEM differencing to avoid the inclusion of vertical offsets or aspect-dependant biases into estimates of elevation change. We employed the approach of Nuth and Kääb (Reference Nuth and Kääb2011) to quantify and minimise stable-ground elevation differences between different ASTER, SPOT-5 and Corona KH-4 DEMs in x, y and z directions. We used the SRTM as a reference surface to which we coregister DEMs from other sensors, applying horizontal and vertical shifts and first-order polynomial trend surfaces (Pieczonka and others, Reference Pieczonka, Bolch, Wei and Liu2013) to match the location of off-glacier topography. Following DEM differencing, we filtered elevation change data to remove obvious outliers resulting from DEM blunders which were inherited by DEM difference data. We removed any pixels of elevation change outside of the range of ±150 m at this stage. Such erroneous values can be common in the higher reaches of glaciers accumulation zones where low contrast prevents accurate image matching and therefore DEM generation. We then followed the approach of Gardelle and others (Reference Gardelle, Berthier, Arnaud and Kääb2013) to remove elevation difference values of > ± 3* the std dev. within 100 m elevation bands below the median elevation of each glacier, which we take as a proxy of the equilibrium line altitude (ELA). Above the ELA, we apply a stricter (±1.5* the std dev.) threshold to filter, again to minimise the impact of low surface contrast on our estimates of the rate of surface elevation change in glacier accumulation zones. This approach varies slightly to that employed by King and others (Reference King, Bhattacharya and Bolch2021) over the Geladandong Ice Caps at the western end of the Tanggula Shan, where an alternative (Pieczonka and Bolch, Reference Pieczonka and Bolch2015) filtering approach was employed to accommodate the contrasting relationship between elevation and elevation change evident over surge-type glaciers. We expected a lower magnitude of elevation change over the higher reaches of non-surge-type glaciers in the Dongkemadi and Bugyai Kangri regions of the Tanggula Shan, thus a spatially consistent filtering approach could be applied in these cases.
To achieve complete coverage of surface elevation change data in order to enable geodetic mass-balance estimation over individual glaciers, we filled data gaps resulting from outlier filtering using a two-step approach. First, small data gaps (<~5 pixels) were filled with mean values from a surrounding 4 × 4 pixel window under the assumption that local elevation change patterns were consistent across localised subsets of clean ice glaciers. Larger data gaps, predominantly in the higher reaches of glaciers, were filled using the median value of elevation change within the associated 100 m elevation band of each individual glacier. This localised, hypsometric approach to gap filling does not introduce any bias (underestimate or overestimate) into elevation change data when compared with non-void-filled data (McNabb and others, Reference McNabb, Nuth, Kääb and Girod2019). We converted filtered, gap-filled surface elevation change data to ice volume change data considering the pixel size of the elevation change grids (30 × 30 m) and then to ice mass change using a conversion factor of 850 ± 60 kg m3 (Huss, Reference Huss2013). The coverage of repeat DEMs allowed for the generation of geodetic mass-balance estimates for 70 glaciers in the Geladandong sub-region (476/713 km2, 73% total glacier area in the 1960s), 35 glaciers in the Dongkemadi sub-region (124/133 km2, 93%) and 14 glaciers in the Bugyai Kangri sub-region (112/145 km2, 77%).
The limited availability of suitable (low snow and cloud cover) stereo imagery over Bugyai Kangri resulted in the generation of DEMs from somewhat contrasting seasons here. Such contrasts in acquisition dates may require additional processing steps to counter biases in accumulation and ablation related to seasonality, particularly over short time periods or in regions where accumulation rates are high (e.g. Bhattacharya and others, Reference Bhattacharya2021). The Corona KH-4 imagery over Bugyai Kangri was acquired in December, which is typically a dry period preceded by decreasing temperatures in the Tanggula Shan (Duan and others, Reference Duan2019; Chen and others, Reference Chen2021). The SPOT-5 stereo pair used to generate the 2003 DEM was acquired in late September 2003, and therefore captured conditions at the end of the typical accumulation period of glaciers in the region (Chen and others, Reference Chen2021). The contemporary ASTER DEM was acquired at the beginning of the typical accumulation period (Chen and others, Reference Chen2021). We chose not to apply any seasonality correction to the elevation change data derived from the Corona KH-4 and SPOT-5 DEMs for two reasons: (1) the typically cool, dry autumn period is unlikely to have seen substantial snowpack depletion at high elevations and conditions over the higher reaches of glaciers would have been roughly comparable between the two acquisitions, and (2) the impact of any contrasting snowpack conditions would be very minor when averaged over the long period (35 years) between the Corona KH-4 DEM and the SPOT-5 DEM.
We also chose not to apply any seasonality correction to the elevation change data derived from the SPOT-5 and ASTER DEMs. Measurements at Dengqen meteorological station (~3800 m, 90 km from Bugyai Kangri) suggest ~600 mm of precipitation typically falls over the summer accumulation period. If this were distributed equally across all glacier surfaces, a difference in elevation of 0.04 m w.e. a−1 could be expected between the post-accumulation season SPOT-5 DEM and the pre-accumulation season ASTER DEM, although comparison of both orthoimages suggests snow cover was limited to accumulation zones at both acquisition dates. We consider that any differences in glacier surface elevation related to seasonality are likely to be <0.04 m w.e. a−1, which is not substantial enough to introduce a large bias into mass-balance estimates over this time period.
2.3 Glacier surface velocity data
We incorporated glacier surface velocity fields generated as part of the ITS_LIVE project (Gardner et al., Reference Gardner2018), and velocity fields generated from Sentinel-1 SAR imagery (Friedl and others, Reference Friedl, Seehaus and Braun2021) into our analyses to better understand the changes in glacier dynamics along the Tanggula Shan since 2000, alongside changes in glacier area and glacier mass. The ITS_LIVE dataset is composed of median surface velocity fields that cover 95% of glacier area across HMA over the period 1985–2017. Annual median velocity fields are derived from a stack of velocity fields generated from multiple individual pairs of Landsat scenes using the AUTO_RIFT algorithm (Gardner and others, Reference Gardner, Fahnestock and Scambos2020). We limit our incorporation of ITS_LIVE data to the period 2000–2017 in consideration of the higher uncertainty associated with velocity fields derived from older, lower resolution Landsat 5 imagery (Dehecq and others, Reference Dehecq2019), which may be of similar magnitude to velocities measured over the lower reaches of some glacier tongues. While a small number of Landsat 5 scenes may have been used to derive the 2000 composite velocity field, their impact on the quality of the velocity field, which will also have been derived from a larger number of Landsat ETM+ image pairs, should be small.
We also examined Sentinel-1 velocity fields generated through intensity offset tracking (Friedl and others, Reference Friedl, Seehaus and Braun2021), which are available over the period 2014–2021. We incorporated annual Sentinel-1 velocity mosaics to extend the time series of observations following on from the ITS_LIVE dataset, and we assessed monthly mosaics to examine the evolution of individual glaciers around the Geladandong Ice Caps to establish potential recent (after ITS_LIVE) glacier surging. Despite the differences in the type of datasets and methods used to derive velocity estimates, surface flow rates for glaciers in the Tanggula Shan are in good agreement where comparisons from coincident time periods are possible (section 3). The variance between ITS_LIVE and Sentinel-1 glacier surface velocity estimates has been initially assessed by Friedl and others (Reference Friedl, Seehaus and Braun2021), who found good agreement between the two datasets, albeit in a contrasting setting (fast flowing Svalbard outlet glaciers) to that of this study. Friedl and others (Reference Friedl, Seehaus and Braun2021) highlight potential sources of contrasts in ITS_LIVE and Sentinel-1 velocity estimates, including (1) seasonal biases in data availability and (2) the prevalence of blunders over low contrast surfaces (accumulation zones). The year-round possibility of acquisitions over glaciers in the Tanggula Shan makes it unlikely that seasonal acquisition weighting has affected the annual velocity Sentinel-1 estimates over our study area. Similarly, the improved coherence of SAR data acquired over winter months (Strozzi and others, Reference Strozzi, Paul, Wiesmann, Schellenberger and Kääb2017) may lead to improved speckle tracking results and a more complete velocity field, giving the impression of enhanced ice flow when compared to summer results. We were careful to compare sub-annual Sentinel-1 velocity fields from comparable seasons (e.g. Fig. 7) to mitigate such an issue.
To compare glacier velocity estimates on an annual basis in different sub-regions of the Tanggula Shan, we measure mean surface velocities over subset areas of glacier ablation zones (3×3 pixel window, ITS_LIVE: 240×240 m, Sentinel-1: 200×200 m) after filtering annual velocity fields considering an error threshold of >10 m a−1, which are provided with both the ITS_LIVE and Sentinel-1 velocity datasets. We measure annual velocities 2 km from glacier termini on glaciers ranging in area from 5.6 to 33.4 km2. We limit our analyses to glaciers >5 km2 following Dehecq and others (Reference Dehecq2019), and we avoid repeat comparisons of glacier velocity estimates over glacier accumulation zones due to limitations on data quality here.
2.4 Meteorological observations and ERA5-Land data
We examined ERA5-Land reanalyses data over the Tanggula Shan to establish potential changes in surface temperature (2 m temperature in the ERA5-Land data catalogue) and precipitation (solid precipitation) over glacierised regions over our study period. We primarily chose ERA5-Land over other reanalyses datasets (e.g. HAR V2) as it offers a time series of comparable length to our geodetic observations. The ERA5-Land dataset is produced through the rerunning of the land component of ERA5 climate reanalysis, which employs the European Centre for Medium-range Weather Forecasts (ECMWF) land surface model and forcing from near-surface meteorological fields from ERA5 (Muñoz-Sabater and others, Reference Muñoz-Sabater2021). The land surface model produces hourly estimates of the evolution of the land surface state and associated water and energy fluxes. We examined monthly mean compilations of 2 m temperature and solid precipitation estimates contained in the ERA5-Land datasets as these two variables have the largest influence on glacier ablation and accumulation rates and therefore mass balance, and because they provide the opportunity to examine long-term trends in meteorology in a computationally efficient manner. We extracted records of temperature and precipitation over the period 1960–2018 over pixels containing glaciers in the ~10 × 10 km ERA5-Land grids (Table 2). To validate the outputs of the ERA5-Land experiment, we compared the time series of temperature and precipitation estimates against observations made at Tuotuohe meteorological station over the same time period (1960–2018). The outputs from the ERA5-Land experiment are more temporally resolved than the observations made at Tuotuohe, so we compared annual trends in temperature and precipitation from the two time series.
Table 2. Coverage and elevation range of glacierised ERA5-Land pixels examined for temperature and solid precipitation change

2.5 Uncertainty
The total uncertainty we estimate in association with individual glacier mass balance is composed of the uncertainty associated with surface elevation change (σ Δz,g), the uncertainty associated with glacier area (σ ΔA ) and the uncertainty associated with volume to mass conversion (σ fΔV). We estimate (σ Δz,g) following the method proposed by Fischer and others (Reference Fischer, Huss and Hoelzle2015) after Rolstad and others (Reference Rolstad, Haug and Denby2009):

where σ 2Δh g (m) is the variance of elevation change estimates over off-glacier, stable terrain. A cor is the length over which elevation change data are correlated (Rolstad and others, Reference Rolstad, Haug and Denby2009) and A T1 is glacier area at the beginning of our observation period over each sub-region. A cor varied from 161 to 385 m across the different sub-regions and pairs of DEMs used to measure surface elevation change.
The uncertainty associated with a changing glacier area was estimated following Malz and others (Reference Malz2018):

The total uncertainty associated with an individual glaciers mass balance (σ geod) is estimated through:

where Δz g is the average elevation change (m) estimated from the DEMs difference. We employ a conversion factor (fΔV) of 0.85 with an associated uncertainty (σ fΔV) of 0.06 following Huss (Reference Huss2013). Values of σ geod are then divided by the length of the observation period and range between 0.10 and 0.20 m w.e. a−1.
3. Results
3.1 Glacier area and mass change along the Tanggula range
3.1.1 Glacier area change
Glacier area in the Tanggula Shan reduced by 131 ± 7 km2 between 1977 and 2019 (1708 ± 109 km2 across the whole mountain range in 1977, 1577 ± 51 km2 in 2019), which represents a 7.6 ± 0.4% reduction in total glacier area since the beginning of Landsat acquisitions over the mountain range. Over the three sub-regions covered by Corona imagery, and therefore glacier surface elevation change datasets, total glacier area reductions are higher (due to the slightly longer study period) and spatially variable. Over the Geladandong Ice Caps, an 8.1 ± 0.3% reduction in total glacier area occurred between 1969 and 2019 (713 ± 4 to 655 ± 18 km2). The glaciers draining the Bugyai Kangri Ice Caps reduced in area by 15 km2 between 1968 and 2019 (145 ± 2 to 131 ± 6 km2), an 11 ± 0.3% reduction. Glaciers around the Xiao Donkemadi benchmark glacier reduced in area by 38 km2 between 1964 and 2019 (133 ± 3 to 95 ± 5 km2), a 28 ± 0.7% reduction since the start of our study period.
3.1.2 Glacier mass balance
The mean geodetic mass balance of all of the glaciers in our sample across the Tanggula mountain range was −0.30 ± 0.11 m w.e. a−1 over the full study period (1960s to 2018). The mean mass balance over the two sub-periods shows a substantial increase in the rate of ice mass loss along the Tanggula mountain range since the 1960s. Between the early 1960s and 2000s, the mean mass balance of all glaciers in our sample was −0.21 ± 0.12 m w.e. a−1, whereas between the 2000s and 2018 the mean mass balance was −0.52 ± 0.18 m w.e. a−1 (Table 3). The acceleration of the mass loss rate is different for the three sub-regions along the Tanggula Shan (Table 3), which we discuss in more detail below.
Table 3. Geodetic mass-balance (m w.e. a−1) estimates of glaciers across the Tanggula Shan and within the different sub-regions, over the periods between the 1960s and early 2000s, the early 2000s to 2018 and between the early 1960s and 2018

Specific date ranges for the Geladandong sub-region: 1968–2005/06–2017/18; for the Dongkemadi sub-region: 1964–2001–2015; and for Bugyai Kangri: 1968–2003–2018.
a Denotes results from King and others (Reference King, Bhattacharya and Bolch2021).
The glaciers around the Bugyai Kangri Ice Cap experienced the highest rates of ice mass loss in Tanggula Shan during our earliest study period. The mean mass budget of 14 glaciers (112 km2 in 1968) draining the main Bugyai Kangri Ice Cap was −0.30 ± 0.16 m w.e. a−1 between 1968 and 2003. For the same glaciers, the rate of mass loss increased over the period 2003–2018 (−0.56 ± 0.20 m w.e. a−1). Over the full study period (1968–2018), glaciers around the Bugyai Kangri Ice Cap lost mass at a mean rate of −0.42 ± 0.11 m w.e. a−1. The five largest glaciers (~84 km2 in 1968, 78 km2 in 2019) draining the main Bugyai Kangri Ice Cap are lake-terminating and these glaciers have seen considerable ice loss in recent decades. Our results suggest that these five glaciers display different, aspect-dependant ice loss rates. The three north-flowing, lake-terminating glaciers lost ice at a slightly slower rate (−0.24 ± 0.17 vs −0.36 ± 0.12 m w.e. a−1) than land-terminating glaciers between 1968 and 2003. The two south-flowing, lake-terminating glaciers saw much less substantial thinning (Fig. 2) and a substantially lower rate of mass loss (−0.15 ± 0.05 m w.e. a−1) over the same period. Since 2003, the rate of ice mass loss from the north-flowing, lake-terminating glaciers increased substantially (mean −0.64 ± 0.14 m w.e. a−1), as did the rate of ice mass loss from the south-flowing, lake-terminating glaciers, but their rate of ice mass loss (−0.33 ± 0.07 m w.e. a−1) is still below the mean rate of the region (Table 3).

Fig. 2. Surface elevation change rate over the Bugyai Kangri Ice Caps over the periods 1968–2003 (a) and 2003–2018 (b), and surface elevation change around the Xiao Donkemadi benchmark glacier over the periods 1964–2001 (c) and 2001–2015 (d).
We measure the mean mass balance of 35 glaciers (124 km2 in 1964) around (and including) the Xiao Dongkemadi benchmark glacier to have been −0.16 ± 0.10 m w.e. a−1 over the period 1964–2001. The rate of ice mass loss was substantially higher over our second study period (−0.53 ± 0.17 m w.e. a−1 between 2001 and 2015). The mass balance of Xiao Dongkemadi benchmark glacier was −0.12 ± 0.09 m w.e. a−1 between 1964 and 2001. The rate of mass loss from Xiao Dongkemadi benchmark glacier increased to −0.48 ± 0.12 m w.e. a−1 between 2001 and 2015 based on our geodetic methods.
As reported by King and others (Reference King, Bhattacharya and Bolch2021), the mean mass balance of glaciers draining the Geladandong Ice Caps was −0.24 ± 0.08 m w.e. a−1 over the period 1969–2017 (n = 43, 442 km2 glacier area). The rate of mass loss from glaciers around the Geladandong Ice Caps increased substantially over the two sub-periods covered by elevation change data. The mean mass balance of glaciers over the period 1969–2005 was −0.18 ± 0.08 m w.e. a−1. The mean balance of Geladandong glaciers (n = 59, 476 km2 glacier area) became substantially more negative between 2005/2006 and 2017/2018; the mean mass loss rate of all glaciers over this period was −0.48 ± 0.06/0.17 m w.e. a−1.
3.2 Glacier velocity change along the Tanggula Shan
Glacier velocities show contrasting behaviour with both flow acceleration and deceleration having occurred along the Tanggula Shan over the last two decades. Glacier surface velocities evolved in different ways on either side of the Bugyai Kangri Ice Cap and also depending on glacier terminus type. The velocity of the terminal regions of two lake-terminating glaciers on the northern side of the ice cap increased between 2000 and 2020 (Fig. 3). Glacier surface velocity increases were 0.29 ± 0.02 m a−1 (6.0 ± 0.6% dec−1) to 1.42 ± 0.07 m a−1 (50.5 ± 1.3% dec−1) in these lake-terminating cases. The largest land-terminating glacier on the northern side of the ice cap displayed a relatively stable flow regime (−0.07 ± 0.02 m a−1 or −3.0 ± 1.4% dec−1) over the same period (Fig. 3e). Surface velocity estimates measured from velocity fields generated from Sentinel-1 image pairs are in good agreement with the ITS_LIVE surface velocity estimates and similar trends in flow rates are evident in these data up to 2020. The mean difference between the annual mean ITS_LIVE and Sentinel-1 velocity datasets over the three subsets from which we have taken repeat measurements was 1.7 m a−1, ranging from −26.4 to 14.6 m a−1, between 2014 and 2018.

Fig. 3. Multi-temporal glacier surface velocity measurements over glaciers draining the Bugyai Kangri Ice Cap between 2000 and 2020, using ITS_LIVE and Sentinel-1 derived velocity fields. (a) Mean annual ITS_LIVE velocity field from 2000. (b) Mean annual Sentinel-1 derived velocity field from 2020. (c–e) Repeat measurements of the mean velocity within subsets over three glaciers (marked on panels a and b) over the period 2000–2020, from both ITS_LIVE and Sentinel-1 data, fitted with 2-year moving average trendlines.
The surface velocity of glaciers around the Xiao Donkemadi benchmark glacier steadily decreased over the period 2000–2020 (Fig. 4). Repeat measurements in the ablation zone of the three largest glaciers in the area show reductions in flow ranging from −0.08 ± 0.01 m a−1 (−10.0 ± 5.8% dec−1) to −0.24 ± 0.03 m a−1 (−26.0 ± 7.1% dec−1) over this period. Measurements from annual mean velocity fields derived from Sentinel-1 imagery (2014–2020) suggest that the flow rate in the terminal regions of these three glaciers is now no higher than ~10 m a−1. Only minor differences are evident in the flow rates estimated over the subset areas we examined in the annual ITS_LIVE and Sentinel-1 velocity datasets between 2014 and 2018. The mean difference over this period was 0.09 m a−1, ranging from −4.47 to 6.35 m a−1.
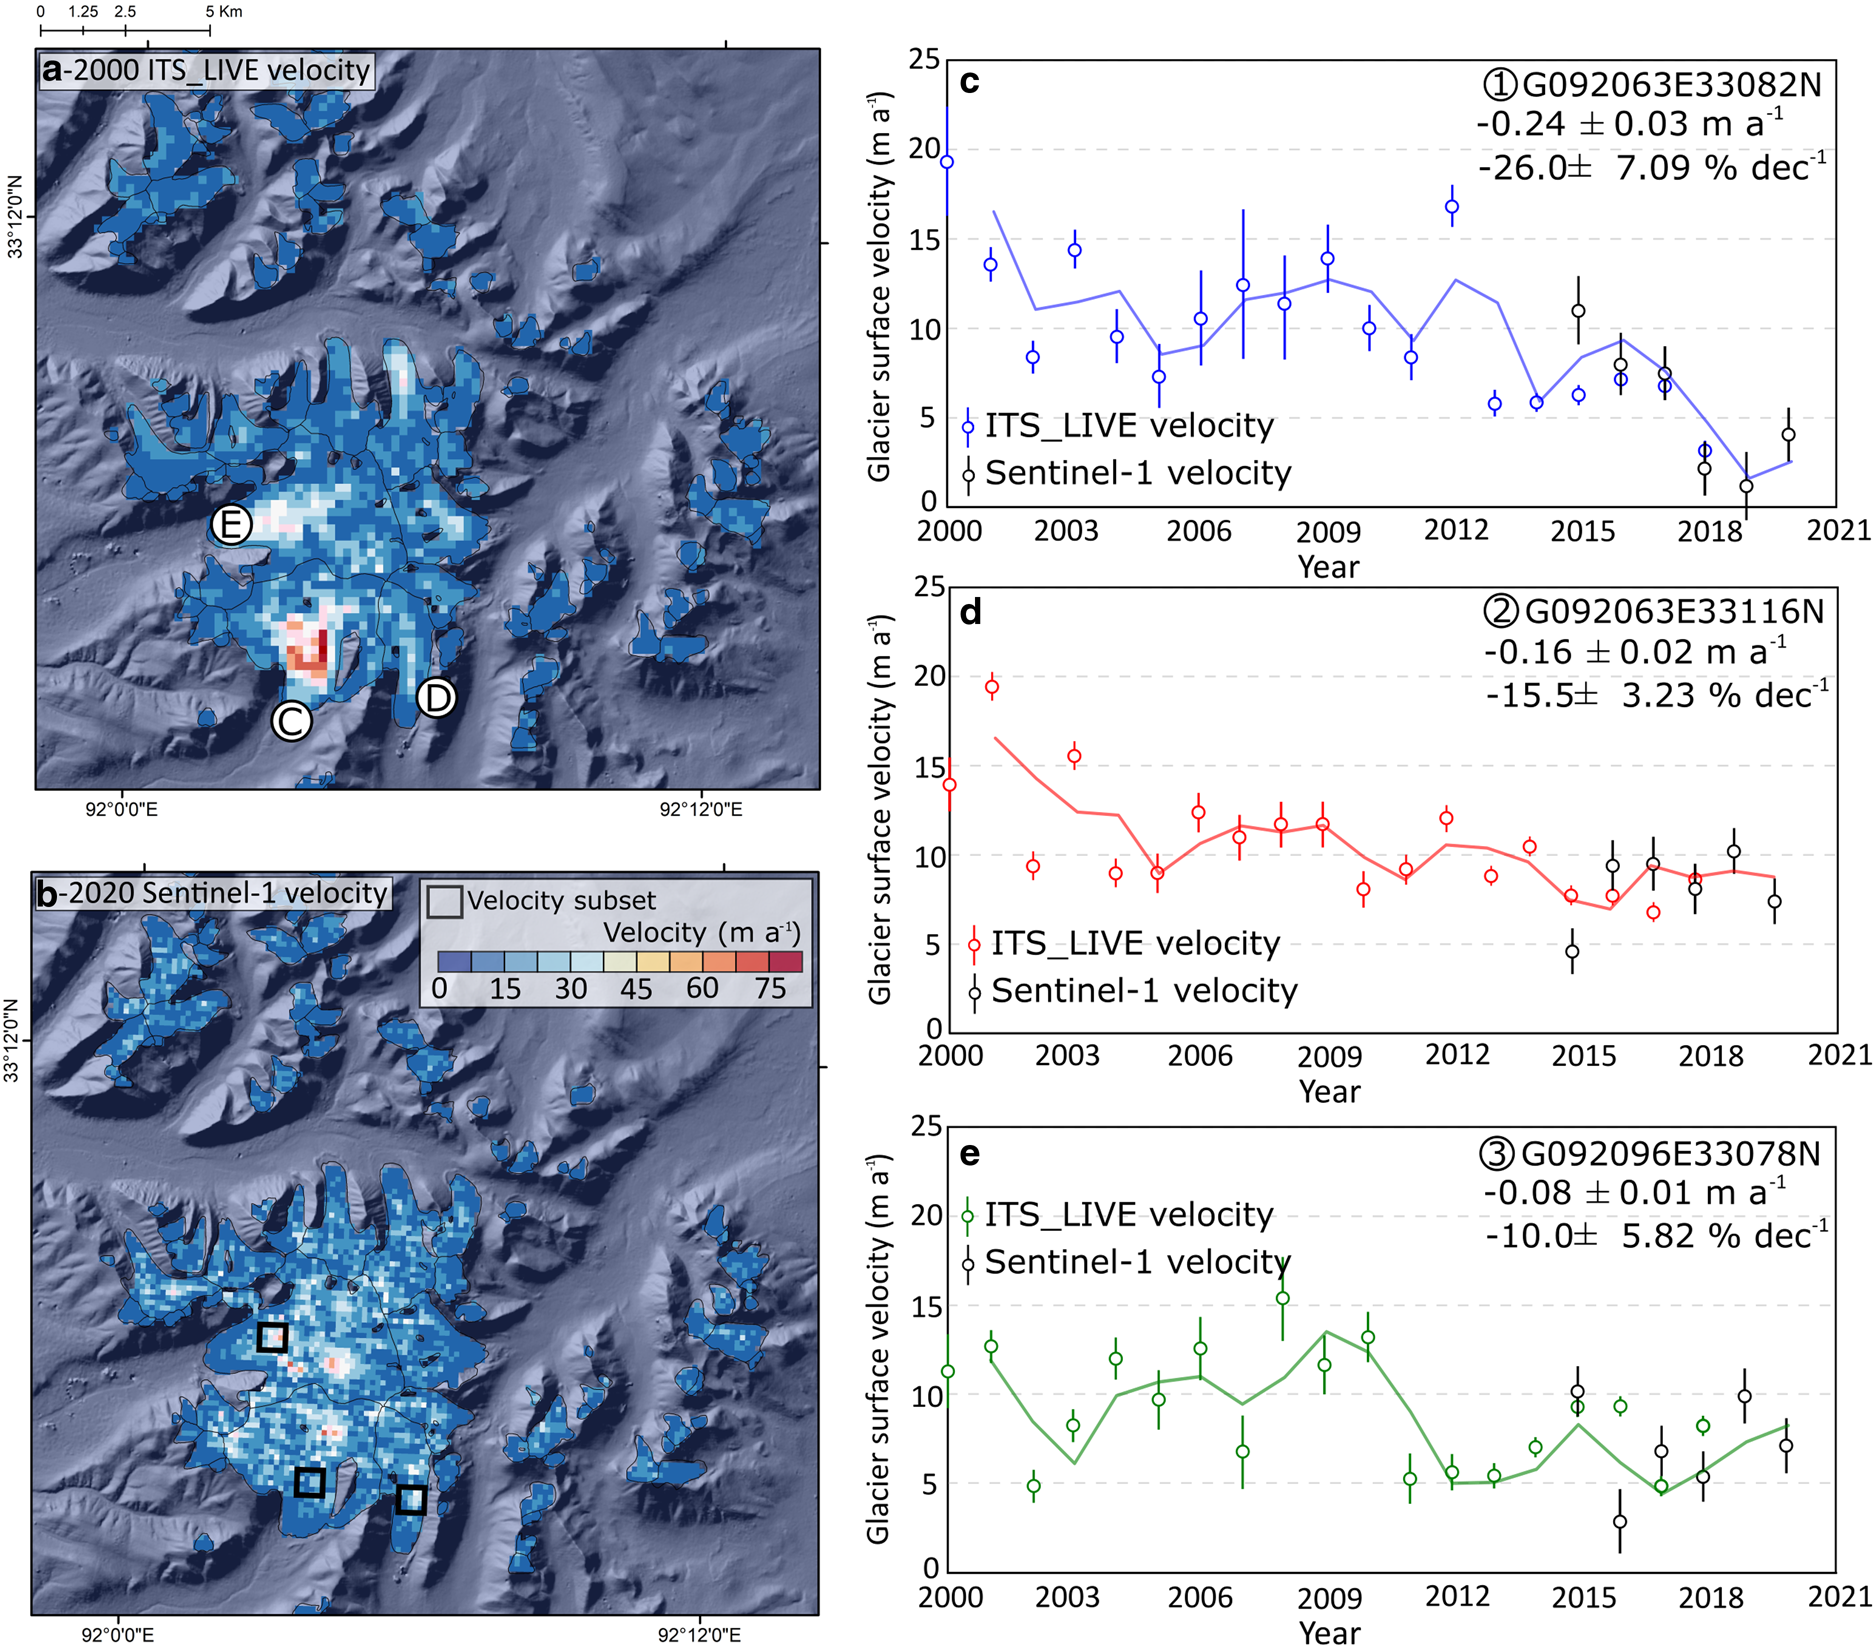
Fig. 4. Multi-temporal glacier surface velocity measurements over glaciers around the Xiao Dongkemadi benchmark glacier between 2000 and 2020, using ITS_LIVE and Sentinel-1 derived velocity fields. (a) Mean annual ITS_LIVE velocity field from 2000. (b) Mean annual Sentinel-1 derived velocity field from 2020. (c–e) Repeat measurements of the mean velocity within subsets over three glaciers (marked on panels a and b) over the period 2000–2020, from both ITS_LIVE and Sentinel-1 data, fitted with 2-year moving average trendlines.
The velocity regime of the Geladandong Ice Cap glaciers is dominated by surge behaviour, which affected 20 of the largest glaciers in the area between 1969 and 2018 and has been examined in detail by aforementioned previous studies. The incorporation of the Sentinel-1-derived velocity time series allowed for the assessment of potential further glacier surging beyond the time period covered by the ITS_LIVE data (after 2018). The extended time series of velocity data suggest ice flow acceleration over a considerable portion of glacier G091204E33248N, in the Geladandong Ice Cap sub-region (Fig. 5), which is a previously identified surge-type glacier (King and others, Reference King, Bhattacharya and Bolch2021). Between 2016 and 2018, centreline velocity profiles along the length of this glacier suggest a consistent flow rate (Fig. 5a) in both the ITS_LIVE and Sentinel-1 velocity datasets. The Sentinel-1 velocity annual time series suggests that flow rates increased (doubled) over the upper 3 km of the glacier centreline in 2020 (Fig. 5a). The acceleration in flow continued into the 2020/2021 winter, reaching 70 m a−1 in January 2021, more than twice the maxima measured in the monthly mean Sentinel-1 velocity field from February 2016 (Fig. 5c). The rate of ice flow in the upper reaches of glacier G091204E33248N is now similar to that of other surges documented around the Geladandong Ice Caps, and we would expect enhanced ice flow rates to expand down-glacier as the surge progresses.

Fig. 5. The recent evolution of the velocity of glacier G091204E33248N, a previously identified surge-type glacier. (a) Sentinel-1 derived annual mean velocity estimates along the glacier centreline from 2015 to 2020. (b) Glacier centreline velocity profiles in the winter of 2016 and 2021, derived from Sentinel-1 imagery.
Other than the surge-type glaciers of the two main Geladandong Ice Caps, a consistent trend of decreasing velocities is evident on three glaciers of comparable size with no history of surging (Fig. 6). Between 2000 and 2020, these three glaciers ablation zones showed ice flow reductions ranging from −0.13 ± 0.02 m a−1 (−14.0 ± 9.8% dec−1) to −0.79 ± 0.04 m a−1 (−29.5 ± 2.4% dec−1) (Fig. 6). The Sentinel-1 velocity fields again compare well to the ITS_LIVE data (mean difference of −1.9 m a−1, ranging from −10.35 to 4.31 m a−1) in the overlapping period (2014–2018) and indicate a similar trend in ice flow rates through to 2020 (Fig. 6).

Fig. 6. Multi-temporal glacier surface velocity measurements over glaciers draining the two main Geladandong Ice Caps between 2000 and 2020, using ITS_LIVE and Sentinel-1 derived velocity fields. (a) Median annual ITS_LIVE velocity field from 2000. (b) Median annual Sentinel-1 derived velocity field from 2020. (c–e) Repeat measurements of the mean velocity within subsets over three glaciers (marked on panels a and b) over the period 2000–2020, from both ITS_LIVE and Sentinel-1 data, fitted with 2-year moving average trendlines.
3.3 Meteorological conditions and the changing climate of the Tanggula Shan
The Tanggula Shan span between both the cold, generally arid interior of the Tibetan Plateau and the eastern end of the Himalaya and Hengduan Shan mountain ranges, which receive precipitation from the summer monsoon as it propagates from the southwest (Fig. 7). Consequently, the glaciers of the three sub-regions receive variable amounts of precipitation through the year. The majority of solid precipitation accumulation occurs between June and September (69–71%) in all three sub-regions. ERA5-Land data suggest the glacierised sub-regions of the Tanggula Shan received an annual mean of 195 (Geladandong), 212 (Dongkemadi) and 283 mm (Bugyai Kangri) of solid precipitation over the period 1960–2016 (Table 2). The meteorological station at Tuotuohe (at 4500 m a.s.l.) recorded a mean of 293 mm of solid precipitation per year over the same time period. ERA5-Land data over glacierised pixels in the three sub-regions suggests similar mean annual temperatures at either end of the mountain range (Geladandong −9.6°C between 4847 and 6571 m a.s.l., Bugyai Kangri −9.6°C between 4182 and 6278 m a.s.l.), and slightly higher mean annual temperatures in the Donkemadi sub-region over glacierised ERA5-Land pixels (Donkemadi −8.7°C between 4954 and 6096 m a.s.l.). Mean monthly temperatures approach or exceed 0°C between June and September in all three sub-regions at glacierised elevations.

Fig. 7. Mean annual 2 m temperature (a), and mean annual temperature anomalies over glaciated pixels (b) in glaciated pixels of the ERA5-Land dataset in the three sub-regions of the Tanggula Shan, along with the Tuotuohe meteorological station. Temperature anomalies over the time series are compared to a baseline period of 1960–1990. Mean annual solid precipitation (c) and solid precipitation anomalies (d) also shown based on ERA5-Land data using the same approach. Trend lines on b and d are 3-year moving averages. Note the substantial negative temperature anomaly in panel b which relates to very cold mean annual temperatures recorded in 1985/86 at Tuotuohe.
We find generally good agreement between the mean annual temperature record from Tuotuohe and the mean annual temperature record of the gridcell from the same location in the ERA5-Land dataset between 1960 and 2018 (Pearson correlation coefficient 0.75, p-value 0.09), so we consider the ERA5-Land data to also offer a good representation of the changing surface air temperature over glacierised regions. Analyses of both the ERA5-Land and Tuotuohe meteorological station time series indicate consistent temperature increases have occurred along the Tanggula Shan since 1960 (Fig. 7). ERA5-Land data over the Dongkemadi sub-region suggest this part of the Tanggula Shan has been warming at a mean rate of 0.34°C dec−1 over the last six decades. Contemporary temperature anomalies are particularly pronounced here, with the period between 2000 and 2016 an average of 1.06°C warmer than the period between 1960 and 1990. The mean temperature anomaly was 1.85°C higher between 2010 and 2016 over this sub-region. The Geladandong sub-region warmed at a mean rate of 0.21°C dec−1 between 1960 and 2016 and the period since 2010 was a mean of 1.04°C warmer than the period between 1960 and 1990 here (0.75°C temperature anomaly since 2000). Temperatures in the Bugyai Kangri sub-region increased at a mean rate of 0.18°C dec−1 since 1960. Again, the highest temperature anomalies occurred since the year 2000 (0.69°C since 2000; 0.70°C since 2010) but generally indicate less substantial warming at the eastern end of the Tanggula Shan than in central or western sub-regions. The temperature record from Tuotuohe weather station suggests a warming rate of 0.35°C dec−1 since 1960, and pronounced temperature anomalies over recent years (1.43°C between 2000 and 2016, 1.63°C between 2010 and 2016).
Closer examination of the ERA5-Land reanalyses data suggests substantial seasonal variability in temperature changes over the study period (Fig. 8). A large proportion of the warming in each sub-region has occurred in the autumn (September, October, November) and winter (December–February) months (Fig. 8, Table 4), with less warming having occurred in the Spring (March–May) or Summer (June–August) months. Such marked increases in temperature are particularly important around the summer–autumn transition (September–October), when mean monthly temperatures are close to 0°C in each sub-region (−2.04°C in Geladandong, −0.41°C in Dongkemadi, 0.16°C in Bugyai Kangri).

Fig. 8. Temperature (a) and solid precipitation (b) anomalies over the three glacierised sub-regions of the Tanggula Shan. Temperature anomalies have been calculated using the 2 m temperature data from the ERA5-Land dataset by comparison with the mean temperature over the period 1960–1990. Precipitation anomalies represent solid precipitation totals in the ERA5-Land dataset, again compared to the period 1960–1990.
Table 4. Seasonal anomalies in ERA5-Land 2 m temperature (T) and solid precipitation (P) time series over the three sub-regions when comparing the full study period (1960–2016) to a baseline period of 1960–1990

In contrast to the temperature records of the Tuotuohe meteorological station and the ERA5-Land dataset, we find little agreement between the precipitation time series at the same location. We find discrepancies in the mean annual precipitation (175 mm a−1 in ERA5-Land, 294 mm a−1 at Tuotuohe; Table 1) and its interannual variability within the two datasets (StDev ERA5-Land 25 mm, Tuotuohe 72 mm), and see little correlation (Pearson correlation coefficient 0.05, p-value >0.5) between the two time series overall. This variability may be related to the methods used to record precipitation at the weather station, as well as localised orographic effects, which may have affected either dataset. Consequently, we present our analyses of the time series of precipitation estimates from Tuotuohe meteorological station and the ERA5-Land dataset with caution as we are unable to attribute the source of the discrepancies described above to errors within either dataset. Still, we believe it useful to examine the modelled precipitation within the ERA5-Land dataset to understand how the long-term behaviour of broad scale weather systems over the Tanggula Shan may have changed over the last few decades, and we tentatively link these to our geodetic observations.
No consistent trend is evident in annual ERA5-Land solid precipitation estimates over the different Dongkemadi or Geldandong sub-regions over the study period (Fig. 7d). Modest seasonal increases and reductions (<10%) in solid precipitation are indicated by the ERA5-Land data in different sub-regions along the Tanggula Shan (Table 4). The ERA5-Land solid precipitation time series suggests a slight increase in solid precipitation (6–8%) through the autumn in Bugyai Kangri. However, the ERA5-Land dataset indicates that Bugyai Kangri receives the bulk of its precipitation (>50%) during the preceding summer months, and only ~10% during the autumn, so a 10% reduction of precipitation during the latter period is likely to have had a limited impact on glacier accumulation rates here.
4. Discussion
4.1 Variability in geodetic mass-balance estimates over the Tanggula Shan
4.1.1 Comparison to other studies and data
A number of studies have now examined the evolution of glaciers along different parts of the Tanggula Shan over the last five or six decades. While these studies have focussed on different sub-regions using different techniques and datasets, there is general agreement that the rate of ice loss has increased recently (Fig. 9). Chen and others (Reference Chen2017), Zhou and others (Reference Zhou, Li, Li, Zhao and Ding2018) and Chen and others (Reference Chen2021) estimated almost identical (−0.21 to −0.22 ± 0.11 to 0.16 m w.e. a−1) rates of mass loss between the late 1960s/70s and 2000 over the Geladandong Ice Caps. Our estimates of ice loss between the 1960s and early 2000s are in good agreement with those of earlier studies (Table 2; Fig. 9). In the period since 2000, ice mass loss rate estimates for different sub-regions along the Tanggula Shan are generally higher than those before 2000, but cover a broad range (Fig. 9). Studies which have examined the most contemporary time periods (Liu and others, Reference Liu2020; King and others, Reference King, Bhattacharya and Bolch2021) indicate the highest ice mass loss rates.

Fig. 9. Comparison of estimates of the mass balance of glaciers in the Tanggula Shan. (a) Geodetic mass-balance estimates from this study for the three sub-regions and the mean across all glaciers. (b) Studies covering Xiaodongkemadi and surrounding glaciers. (c) Studies covering Bugyai Kangri Ice Cap. (d) Studies covering the Geladandong Ice Caps. * marks studies combining different data types (optical, SAR, topographic maps).
The broad range of mass loss estimates since 2000 are likely due to a combination of the complexities associated with deriving geodetic mass loss estimates from DEMs generated from different data types, and also due to the influence of glacier surges on mass balance over short time periods. For example, mass loss rates from Geladandong glaciers derived from a combination of the SRTM X- and C-band DEMs, TanDEM-X DEMs and optical imagery (ZY3) vary from −0.11 ± 0.03 to −0.47 ± 0.09 m w.e. a−1 over overlapping time periods (2000–2012 and 2004–2017) in the study of Liu and others (Reference Liu2020). The low mass-balance estimate from 2000 to 2012 suggests a decrease in ice loss rates compared to other studies covering the period before 2000, which is contrary to the results of several other studies (Fig. 9, all >−0.30 m w.e. a−1). A likely explanation for this particular discrepancy is the influence of spatially inconsistent penetration biases inherent in SAR-based DEMs, which may be particularly pronounced in the Eastern Tibetan Plateau (Kääb and others, Reference Kääb, Triechler, Nuth and Berthier2015). Liu and others (Reference Liu2020) followed an uncommon approach to estimate and account for X-band radar wave penetration, by differencing two different TanDEM-X DEMs separated by a few months. Liu and others (Reference Liu2020) carried out this experiment over the nearby Purogangri Ice Cap due to data paucity over the Geladandong Ice Caps. This approach is in contrast to the more common method (e.g. Dehecq and others, Reference Dehecq2016; Bhattacharya and others, Reference Bhattacharya2021) of differencing DEMs derived from SAR and optical imagery from coincident time periods to estimate the difference in elevation caused by the different data types. The penetration estimate, which Liu and others (Reference Liu2020) also used to compensate for SRTM C-band penetration bias, is substantially lower (mean 0.53 m) than penetration estimates from other studies over the Tanggula Shan (e.g. Chen and others, Reference Chen2017 – 3.8–7.4 m; Zhou and others, Reference Zhou, Li, Li, Zhao and Ding2018 – 1.9 m) and also from the Purogangri Ice Cap (Bhattacharya and others, Reference Bhattacharya2021 – mean 1.56 m, >3 m at high elevation). The bias correction applied by Liu and others (Reference Liu2020) varied their mass-balance estimates by 0.07 m w.e. a−1, which does not reconcile the difference between their estimate and those of other, more methodologically consistent studies (Fig. 9). Similar disparities are evident over other glacierised regions of the interior Tibetan Plateau where SAR-based DEMs have been used to generate geodetic mass-balance estimates (see Bhattacharya and others, Reference Bhattacharya2021). Such differences emphasise the need for the careful consideration of the penetration of SAR datasets over Tibetan Plateau glaciers and hint at the magnitude of radar wave penetration over other glaciers in the region.
4.1.2 Influence of the surge cycle on glacier mass-balance estimates
The surge of several of the Geladandong Ice Caps outlet glaciers in the early 2000s (King and others, Reference King, Bhattacharya and Bolch2021) may also explain differences in ice loss estimates in studies covering different portions of the last two decades. Studies such as Shean and others (Reference Shean2020) and Hugonnet and others (Reference Hugonnet2021) span the period 2000–2018/20 and estimate the mass loss rate from the Geladandong Ice Caps to be between −0.28 ± 0.10 and −0.30 ± 0.12 m w.e. a−1. King and others (Reference King, Bhattacharya and Bolch2021) and Liu and others (Reference Liu2020) estimate the mass loss rate of the same glaciers to be −0.48 ± 0.12 and −0.47 ± 0.09 m w.e. a−1 between 2005–2018 and 2012–2018, respectively. These later study periods captured the phase immediately following six surges and the associated, enhanced thinning over ice redistributed to a lower elevation, following significant advance of their termini (Chen and others, Reference Chen2017; Zhou and others, Reference Zhou, Li, Li, Zhao and Ding2018). The study period of Shean and others (Reference Shean2020) and Hugonnet and others (Reference Hugonnet2021) covers this period but also the later stages of quiescence (ice build-up) of these surge-type glaciers, whose mass balance was close to neutral or even slightly positive (mean 0.09 ± 0.40 m w.e. a−1, compared to the regional mean of −0.27 ± 0.36 m w.e. a−1) between 2000 and 2005, and their estimates of mass balance over the full period are lower as a result. Four examples of the variability of the mass balance of surge-type glaciers around the Geladandong Ice Caps are shown in Figure 10, using the temporally resolved mass-balance estimates from Hugonnet and others (Reference Hugonnet2021). As described above, three of these glaciers displayed low mass loss rates during late quiescence and then substantially greater ice loss rates when their most recent surges began (2003, 2008 and 2012, respectively). The mass balance of these glaciers declined more quickly than the regional mean over the same time periods (Fig. 10), while experiencing the same changes in regional climate (section 3.5), which clearly indicates the compounding influence of surge-phase ice mass redistribution on glacier mass balance, alongside atmospheric warming. The fourth glacier (Fig. 10d) displayed progressively less negative mass balance towards its most recent (ongoing) surge, in direct contrast to the regional trend in mass balance, which illustrates a possible dampening effect of the quiescent phase mass build-up of a surge-type glacier against a temperature increase. These results show how care should be taken when examining glacier mass budgets in regions with substantial clusters of surge-type glaciers such as the western Kunlun Shan, the Karakoram and the Pamirs (Guillet and others, Reference Guillet2022), as they can induce substantial, short-term fluctuations in glacier mass-balance estimates.

Fig. 10. Evolution of the mass balance of four selected surge-type glaciers around the Geladandong Ice Caps over the period 2000–2020 using the 5-year mean mass-balance estimates of Hugonnet and others (Reference Hugonnet2021). Average quiescent and surge-phase mass-balance estimates have been calculated as the mean value of annual mass-balance estimates from Hugonnet and others (Reference Hugonnet2021). Vertical bars represent the uncertainty associated with glacier mass-balance estimates, white circle represents the mean.
4.2 Changes in glacier dynamics in the Tanggula Shan
The combined analyses of ITS_LIVE and Sentinel-1 derived glacier surface velocity time series indicate substantial variability in glacier flow along the Tanggula Shan over the last two decades. The flow rate of non-surge-type glaciers around the Geladandong Ice Caps, as well as glaciers around the Xiao Dongkemadi glacier, have consistently decreased over the last two decades (Figs 4, 6), which is consistent with observations of other land-terminating glaciers elsewhere on the Tibetan Plateau (and wider HMA) over the same period (Dehecq and others, Reference Dehecq2019). Dehecq and others (Reference Dehecq2019) showed how the long-term thinning over land-terminating glaciers across most of HMA has led to substantial decreases in driving stress, and therefore ice flow, over the last few decades. Dehecq and others (Reference Dehecq2019) detected moderate median (−8.2 ± 2.3% dec−1) reductions in ice flow from a broad grouping of Tibetan Plateau glaciers (the entire interior plateau). Our wider range of ice flow reduction estimates for individual glaciers (−10.0 ± 5.8 to −29.5 ± 2.4% dec−1 in Dongkemadi and Geladandong sub-regions) emphasise the heterogeneity of ice flow changes at the sub-regional scale on the Tibetan Plateau. As the rate of thinning and mass loss has continued to increase recently (Fig. 9; Hugonnet and others, Reference Hugonnet2021), further reductions in ice flow should be expected from land-terminating, non-surge-type glaciers.
Around the Bugyai Kangri Ice Caps, divergent flow rates are evident depending on glacier terminus type. Lake-terminating glaciers display much greater flow rates around their termini and have experienced either maintained or increased flow rates over the last two decades (Fig. 3). The elevated velocity of lake-terminating glaciers has been documented as a widespread phenomena recently in the Himalaya (Pronk and others, Reference Pronk, Bolch, King, Wouters and Benn2021), with ~50% of lake-terminating glaciers displaying clearly higher terminus proximal velocities than their land-terminating counterparts. Increasing velocities in association with lake expansion, for example in the case of those on the northern side of Bugyai Kangri, has been inferred to represent the operation of dynamic thinning on lake-terminating glaciers (Tsutaki and others, Reference Tsutaki2019; Liu and others, Reference Liu2020; Pronk and others, Reference Pronk, Bolch, King, Wouters and Benn2021). Phases of dynamic thinning and retreat may operate for several decades on lake-terminating glaciers, during which the mass balance of such glaciers will be substantially more negative than others in the region (e.g. King and others, Reference King, Bhattacharya, Bhambri and Bolch2019). The proglacial lakes into which glaciers flow on the northern side of the Bugyai Kangri are already well developed (1–2 km long) and inspection of the ice thickness estimates presented by Farinotti and others (Reference Farinotti2017) suggest that the calving front of two of the three lake-terminating glaciers are currently situated within pronounced overdeepenings and therefore the deepest part of each lake basin. Water depth fluctuations exert a strong influence on glacier terminus dynamics in lacustrine settings (Benn and others, Reference Benn, Warren and Mottram2007; Pronk and others, Reference Pronk, Bolch, King, Wouters and Benn2021) and we would expect that the water column at the terminus at each of these glaciers is currently deep enough to have promoted enhanced ice flow and associated calving. A feedback between enhanced ice flow and ice loss will operate at the termini of these glaciers on the northern side of Bugyai Kangri until substantial resistive stresses moderate ice flow, or until they retreat into shallower water, or out of the lake completely (Zhang and others, Reference Zhang2019). On the southern side of the ice cap, the termini of the two largest lake-terminating glaciers are still positioned down-valley of overdeepenings identified in the data of Farinotti and others (Reference Farinotti2017). It may be some time until these lakes expand and exert a strong influence on the evolution of their host glaciers. In contrast to these lake-terminating glaciers, the land-terminating glacier we highlight on the northern side of Bugyai Kangri (Fig. 3e) experienced slight ice flow reduction (−3.0 ± 1.4% dec−1) throughout the time series of velocity data we examined. Akin to the behaviour of non-surge-type glaciers around the Geladandong Ice Caps and the glaciers in the Dongkemadi sub-region, we would attribute this slowdown to the prolonged thinning (Fig. 2b) and subsequent reductions in driving stress over the glacier in recent decades.
Surge-type glaciers around the Geladandong Ice Caps have experienced large but short-lived velocity increases in response to glacier surging. Our extension of the observations presented in King and others (Reference King, Bhattacharya and Bolch2021) suggests that surges of glaciers in the western ice cap are ongoing (Fig. 5b) and that the active phase of the surge cycle of glacier G091204E33248N has begun in the last 1–2 years. This glacier has previously identified as surge type, based on substantial terminus advance and widespread crevassing in the early 1970s. The initiation of a second observed surge from 2020 onwards suggests a quiescent phase of ~50 years for this particular glacier, which is similar to some surge-type glaciers in the Karakoram (Bhambri and others, Reference Bhambri, Hewitt, Kawishwar and Pratap2017) and slightly longer than glaciers in the Pamirs (Goerlich and others, Reference Goerlich, Bolch and Paul2020). We note that the number of repeat observations of the full surge cycle are admittedly low across HMA, thus the length of quiescence may vary somewhat from these sporadic observations. The recent surge of G091204E33248N began despite the glacier experiencing an increased rate of ice loss (−0.40 ± 0.04 from 1969 to 2005, −0.93 ± 0.05 m w.e. a−1 from 2006 to 2017) across our two study periods following the glaciers last surge. Kochtitzky and others (Reference Kochtitzky2019) documented the extent of eight surges of Donjek Glacier in the St. Elias Range of the southern Yukon, Canada, and suggest that the progressive decrease in the mass balance of the glacier has caused a reduction in the extent of the glacier impacted by surges here. Such observations would suggest that glacier surging will continue in the Geladandong sub-region, but that they may become less intense in the future.
4.3 Factors driving glacier mass loss in the Tanggula Shan
The spatially and temporally variable glacier mass loss we have observed along the Tanggula Shan appears to have been driven by a variety of climatological and glaciological processes, each of which has amplified glacier mass loss over the last few decades. While the contemporary rate of mass loss is similar in each sub-region along the Tanggula Shan (−0.48 to −0.56 m w.e. a−1), ice loss rates were much less consistent along the range in our first study period (−0.16 to −0.30 m w.e. a−1), suggesting different processes have had a stronger impact on ice loss rates in some sub-regions compared to others over the duration of the study period. As we have shown, the increases in ice loss rates in each sub-region do not simply correlate with the magnitude of temperature increases, so we discuss potential additional drivers of ice loss below. Brun and others (Reference Brun2019) conducted a broader analyses of the influence of glacier morphological attributes on recent (post-2000) glacier mass loss rates across the Inner Tibetan Plateau, finding moderate correlations between some variables (such as debris cover) and glacier mass balance. We do not replicate the analyses of Brun and others (Reference Brun2019) here, rather we consider additional factors such as the compounding influence of terminus type, glacier surging and the evolution of meteorological conditions on glacier mass loss rates.
Glaciers in the Bugyai Kangri sub-region displayed the highest mean rate of mass loss in both study periods (Table 2) despite ERA5-Land reanalyses data suggesting that this sub-region experienced the slowest rate of warming (0.17°C dec–1) over the study period, alongside modest reductions in solid precipitation in the accumulation season (Table 4). Reanalyses data also suggest similar annual mean temperature and precipitation here compared to the other sub-regions. Taken together, these climatological factors alone seem insufficient to explain the high rates of ice loss seen in the Bugyai Kangri region over the last few decades. Glacier surface velocity observations (Fig. 3) and our geodetic mass-balance estimates indicate the presence of proglacial lakes at the terminus of the majority of the region's largest outlet glaciers is the most likely additional factor which has driven the enhanced mass loss rate from the regions glaciers. Proglacial lakes here have consistently expanded since at least the 1980s (Liu and others, Reference Liu, Guo, Nie, Liu and Xu2016) and our analyses of Sentinel-1 and ITS_LIVE velocity data suggest they are now influencing glacier terminus flow rates and in turn the rate of mass loss. In other regions of HMA where large proglacial lakes are now common, such as the central Himalaya, elevated glacier mass loss rates have been shown to persist for several decades from lake-terminating glaciers in response to glacial lake expansion (Brun and others, Reference Brun2019; King and others, Reference King, Bhattacharya, Bhambri and Bolch2019). Lake-terminating glacier ice loss rates only return to that of the regional mean level once their termini retreat from their proglacial lake (Zhang and others, Reference Zhang2019), which may not occur quickly around the Bugyai Kangri Ice Cap.
The rate of mass loss from glaciers in the Dongkemadi sub-region increased to a level comparable to that of Bugyai Kangri over our two study periods. There appears to be no distinctive morphological reason which could explain the enhanced ice loss rates which have occurred here compared to other parts of the mountain range. Glaciers in the Dongkemadi sub-region display higher minimum (5430 vs 5180 m a.s.l), mean (5610 vs 5400 m a.s.l) and maximum (5780 vs 5620 m a.s.l.) elevations than glaciers in Bugyai Kangri, and all of the glaciers in our mass balance sample terminated on land throughout the study period. The primary reason for the approximate tripling of ice mass loss rates in Dongkemadi appears to be the long-term warming at glacierised elevations over the last six decades. Both the ERA5-Land and Tuotuohe temperature time series indicate positive temperature anomalies here since the late 1980s, the magnitude of which has continued to increase to the present day (>1.8°C since ~2010). Since 1960, temperatures in the Dongkemadi sub-region have increased at a mean rate of 0.34°C dec–1, which is twice the rate of the Bugyai Kangri sub-region at the eastern end of the mountain range. This warming has mainly occurred in the autumn and winter months (Fig. 8), akin to elsewhere on the Tibetan Plateau and the Tien Shan in Central Asia (Bolch and Marchenko, Reference Bolch, Marchenko, Braun, Hagg, Severskiy and Young2009; Kuang and Jiao, Reference Kuang and Jiao2016), rather than during the spring or summer. Most importantly, substantial warming has occurred here when the mean annual temperature has typically been close to 0°C (late summer/early autumn), suggesting that these glaciers are now experiencing a longer ablation season compared to the first portion of our study period. Kraaijenbrink and others (Reference Kraaijenbrink, Bierkens, Lutz and Immerzeel2017) predict that under RCP4.5 projections comparable warming will occur over the Tibetan Plateau over the period 2005–2100 to that which we have recorded between 1960 and 2018. In the absence of substantial changes in the accumulation regime of these glaciers recently (Fig. 8), we see no reason why the rate of ice loss should decrease in this sub-region as temperatures continue to rise.
The contemporary mass loss rate of glaciers around the Geladandong Ice Caps (King and others, Reference King, Bhattacharya and Bolch2021) is slightly lower than the nearby Dongkemadi glaciers (Table 2), albeit within the margin of uncertainty of each sample. This sub-region has seen similar warming in the late ablation season (Fig. 8, Table 4), which is likely the main reason for the substantial increase in ice loss rates compared to the first part of our study period. King and others (Reference King, Bhattacharya and Bolch2021) also highlighted the variability of surge-type glacier mass-balance estimates here and the more temporally resolved mass budget data of Hugonnet and others (Reference Hugonnet2021) confirms the propensity of surge-type glaciers to lose ice quickly once their surge phase begins (Fig. 10) and their ablation zone expands, which will only be amplified by higher temperatures and a longer ablation season. Several studies have identified surge-type glaciers here using terminus advance as a diagnostic criteria (e.g. Chen and others, Reference Chen2017; Zhou and others, Reference Zhou, Li, Li, Zhao and Ding2018), which shows how commonly these glaciers experience ablation zone expansion. Interestingly, these data also show how several surge-type glaciers in the Geladandong had an approximately balanced mass budget as they approached their most recent surge phase (Fig. 10), or in one case (G091151E33199N) a mass budget which became less negative towards the initiation of its recent (ongoing) surge (Fig. 10d), in direct contrast to the regional mass budget trend over the same time period. In the same way that synchronous surging from a number of surge-type glaciers in a region could exacerbate the regional mass loss signal, such as that found for the Ak-Shirak region in Central Tien Shan (Bhattacharya and others, Reference Bhattacharya2021), the apparently balanced budget in late quiescence displayed by several glaciers around the Geladandong Ice Caps over our second time period (Fig. 10) may suggest that the surge-related mass balance variability can also dampen the ice loss rate from a region containing a significant cluster of surge-type glaciers. This may explain why longer term, broader scale studies find no significant difference in surge-type glacier mass balance (Bolch and others, Reference Bolch, Pieczonka, Mukherjee and Shea2017; Guillet and others, Reference Guillet2022), but on short timescales mass budget variability may not be insignificant. A more spatially and temporally resolved assessment of surge-type glacier mass-balance variability will clearly build on these initial findings, in particular where multi-tributary and debris-covered surge-type glacier systems are common, where the impact of surging on glacier mass balance may be more complicated.
4.4 Implications for Tibetan Plateau glaciers
Broad-scale remote-sensing studies have significantly improved our understanding of the response of the HMA cryosphere to atmospheric warming over the last few decades (e.g. Neckel and others, Reference Neckel2014; Brun and others, Reference Brun, Berthier, Wagnon, Kääb and Treichler2017; Dehecq and others, Reference Dehecq2019). In turn, our appreciation of areas that may be prone to future water stress and/or pervasive glacier-related hazards has improved greatly. However, a common limitation of such studies is the regional averaging of results, which tends to mask more localised variability in ice loss and provide a false impression that large regions are seeing homogeneous responses to external forcing. Our knowledge of the drivers of such variability in glacier behaviour is somewhat less thorough as a result. In this study, we have shown how different ice loss mechanisms have combined to more than double the rate of ice mass loss in the Tanggula Shan since the 1960s. Drivers of increased ice loss here relate to glacier morphology (terminus type), cyclical glacier dynamics (surges) and localised changes in climate related to global warming, but all factors have combined to increase ice loss rates. This combination of factors is important because of the prevalence of similar morphological and dynamic characteristics within the glacier population across the Tibetan Plateau and HMA as a whole.
Guillet and others (Reference Guillet2022) documented the prevalence of surge-type glaciers across HMA over the period 2000–2018 and showed how surges have occurred in all but two of the HIMAP sub-regions of HMA outlined by Bolch and others (Reference Bolch, Wester, Mishra, Mukherji and Shrestha2019). The inventory of Guillet and others (Reference Guillet2022) shows how surging has occurred at the majority of the largest ice caps on the Tibetan Plateau recently, and it is not implausible that most outlet glaciers at these ice caps are of surge type, as we have shown in the Geladandong sub-region. Even though these 666 identified surge-type glaciers account for <1% of the total glacier population, they tend to be much larger than non-surging glaciers and so account for ~20% of total glacier area. The consequences of widespread surging and related glacier mass budget variability on glacier meltwater yield are therefore substantial, as are the hazards associated with the active surge phase. Similarly, studies such as Zhang and others (Reference Zhang, Yao, Xie, Wang and Yang2015), Nie and others (Reference Nie2017) and Wang and others (Reference Wang2020) documented the expansion of glacial lakes across HMA. Substantial proportions of these lakes are proglacial in regions such as the Hengduan Shan, along the northern slope of the Central Himalayan mountain range and the Central and North-West Tien Shan (Chen and others, Reference Chen2021) and we would expect the behaviour of lake-terminating glaciers in these regions to be similar to those around the Bugyai Kangri Ice Cap. Indeed, Pronk and others (Reference Pronk, Bolch, King, Wouters and Benn2021) showed how half of the lake-terminating glacier population in the Himalaya displayed elevated flow at their termini compared to land-terminating glaciers, so it appears the impact of lake development on glacier dynamics (e.g. Fig. 3) and mass balance has been substantial across HMA.
Ultimately, our results provide further evidence of the widespread nature of factors that have combined with continued climate change to amplify glacier mass loss across HMA. While some (Huss and Hock, Reference Huss and Hock2018) regional projections of future glacier mass loss consider ice loss mechanisms we have documented (frontal ablation) for marine-terminating glaciers, lake-terminating glacier frontal ablation is most often neglected (e.g. Kraaijenbrink and others, Reference Kraaijenbrink, Bierkens, Lutz and Immerzeel2017). To improve how broad-scale models capture the evolution of glaciers in regions such as HMA, the widespread impact of glacial lake development and the temporal variability of surge-type glacier mass balance could be considered in greater detail.
5. Conclusions
In this work, we have examined the recent behaviour of glaciers along the Tanggula Shan, an ~500 km long mountain range located in the Central-Eastern Tibetan Plateau. Using geodetic estimates of glacier mass balance covering the period from the mid-1960s to 2018, along with other remotely sensed datasets which captured changes in glacier area and glacier flow, we have examined how glaciers here have behaved over the last six decades. Between the 1960s and 2015/18, the mean mass balance of glaciers in the study region was −0.30 ± 0.11 m w.e. a−1. A substantial increase in the mass loss for two sub-periods (1960s–early 2000s: −0.21 ± 0.12 m w.e. a−1; early 2000s–2015/2018: −0.52 ± 0.18 m w.e. a−1) indicates more than a doubling in the glacier mass loss rate.
In order to establish the main drivers of glacier mass loss in the Tanggula Shan region, we compiled a time series of meteorological station and climate reanalyses data (ERA5-Land) to allow for a comparison of geodetic mass-balance estimates against changes in temperature and precipitation over coincident time periods, as well as the impact of glacier surges and glacier terminus type. Reanalyses data show pronounced (~>1°C) increases in temperature in the central portion (Dongkemadi sub-region) of the mountain range (0.34°C dec–1) since 1960, the majority of which has occurred in the autumn and winter months. We argue that the marked increase in glacier mass loss (−0.16 ± 0.10 m w.e. a−1 from 1964 to 2001; −0.53 ± 0.17 m w.e. a−1 from 2001 to 2015) around Dongkemadi has primarily occurred due to a lengthened ablation season, as much of the recorded warming has occurred during months with a mean temperature close to 0°C. Less substantial changes in temperature (0.18–0.21°C dec–1) or precipitation have been recorded at the eastern (Bugyai Kangri) or western (Geladandong) end of the mountain range, yet glacier mass loss rates were not markedly lower here over our contemporary study period (−0.48 ± 0.17 m w.e. a−1 from 2005 to 2018 around Geladandong; −0.56 ± 0.20 m w.e. a−1 from 2003 to 2018 around Bugyai Kangri). We suggest that the presence of large proglacial lakes has heightened glacier mass loss over a multi-decadal time period at the eastern end (Bugyai Kangri) of the mountain range. Conversely, at the western end (Geladandong) of the mountain range, a cluster of surge-type glaciers has impacted glacier mass loss rates over short (~decadal) time periods. Despite substantial increases in the mass loss rate from glaciers in this sub-region, glacier surging has persisted and we identify new and ongoing surges around the Geladandong ice caps.
The negative impact of several compounding factors related to glacier dynamics (surges), glacier morphology (terminus type) and local climatology on overall glacier mass budgets highlight the potential for glaciers elsewhere on the Tibetan Plateau to lose ice at heightened rates in the coming decades. Comprehensive inventories of both proglacial lakes and surge-type glaciers now show their widespread nature among not only the peripheral mountain ranges around the Tibetan Plateau but also among the majority of the regions’ major ice caps. Any region-wide assessments of future glacier behaviour therefore need to carefully consider such factors if we are to accurately understand impacts on glacier meltwater availability and glacier-related hazards on the Tibetan Plateau.
Data
Glacier surface velocity data used in this study are available via the ITS_LIVE data portal (https://its-live.jpl.nasa.gov/) and the Friedrich-Alexander Universitat Gletscherportal (https://retreat.geographie.uni-erlangen.de/search). ERA5-Land reanalyses data are available through the Copernicus Climate Change Service Data Store (https://cds.climate.copernicus.eu/cdsapp#!/search?type=dataset&text=era5-land). The monthly mean temperature and precipitation data compiled from ERA5-Land data for different sub-regions can be found on Zonodo (https://doi.org/10.5281/zenodo.7560619 ). Glacier surface elevation change data, presented as filtered and gap filled grids, are also available through the same Zonodo repository and mountcryo.com.
Acknowledgements
This study was supported by the Strategic Priority Research Program of the Chinese Academy of Sciences (grant no. XDA20100300), the Swiss National Science Foundation (200021E_177652/1) within the framework of the DFG Research Unit GlobalCDA (FOR2630) and the Dragon 5 program supported by ESA and NRSCC (4000136930/22/I-NB). We thank the editor and two anonymous reviewers for their constructive feedback on the manuscript, which led to substantial improvements during the review process. A. B. acknowledges research funding (grant no. CRG/2021/002450) received from Science & Engineering Research Board (SERB), Department of Science & Technology (DST), India.
Author contributions
Study design: O. K., T. B.; data generation and processing: O. K., S. G., A. B., R. Y.; data analyses: O. K.; manuscript preparation: O. K., with contributions from all co-authors.


 Open access