


Hypertension, one of the primary risk factors for CVD(Reference Cheriyan, O’Shaughnessy and Brown1), is a significant contributor to all-cause mortality in adults(Reference Zhao, Ford and Li2). In order to prevent and treat this condition, it is necessary to evaluate its modifiable risk factors, including dietary and behavioural factors(Reference Kotsis, Stabouli and Papakatsika3–Reference Talukder, Johnson and Varadharaj6).
Vitamin D is a steroid prohormone acquired through skin synthesis from sunlight and dietary intake of either foods or supplements(Reference Holick7,Reference Liu, Woo and Wu8) . There is growing evidence from experimental studies that a deficiency of vitamin D may be a risk factor affecting hypertension(Reference Li, Kong and Wei9–Reference Tukaj, Trzonkowski and Tukaj11). Although many studies have examined the association between vitamin D and hypertension, their epidemiological evidence has proven controversial. A recent review using meta-analysis(Reference Ke, Mason and Kariuki12) of cross-sectional and prospective data suggested that the association between vitamin D status (measured by serum concentration of 25-hydroxyvitamin D (25(OH)D)) and the risk of hypertension was markedly stronger in women aged <55 years(Reference Forman, Giovannucci and Holmes13,Reference Griffin, Gadegbeku and Sowers14) , while the association became null in women aged ≥55 years(Reference Margolis, Martin and Ray15–Reference Ke, Graubard and Albanes17). That review suggested that the reason for a stronger association in younger women is still puzzling.
In this context, we hypothesized that this difference in associations between younger women and older women may be caused by the change in ovarian hormones around menopause. Several studies have suggested that the decline of oestrogen around the time of menopause has various adverse effects on women’s health such as increase in weight, insulin resistance and hypertension(Reference Freeman, Sammel and Lin18–Reference Coylewright, Reckelhoff and Ouyang20). Maas and Franke suggested that menopausal status may promote onset of hypertension and that even premenopausal women with lower oestrogen levels caused by other hormone-related factors are at increased risk to develop hypertension or premature CHD(Reference Maas and Franke21). Given the continued interest and debate on the age-specific association between vitamin D and hypertension in women, the current study aimed to evaluate the associations between vitamin D status, measured by serum 25(OH)D concentrations, and the risk of hypertension as they may differ according to menopausal status, especially those associations in premenopausal women.
Methods
Study population
The National Health and Nutrition Examination Survey (NHANES) is a cross-sectional and population-based survey conducted to obtain health and nutritional status by the Centers for Disease Control and Prevention of the National Center for Health Statistics.
The survey uses a complex, multistage, stratified and clustered design and provides demographic, socio-economic, behavioural and dietary data on a representative sample of the civilian, non-institutionalized US population (households). Oversampled subgroups for 2007–2010 included Hispanics, non-Hispanic Blacks, low-income Whites and persons aged ≥80 years. Demographic and health history information was collected through extensive household interviews, and blood and urine samples and standardized physical examinations were conducted at mobile examination centres.
The present analysis included data from four years of the NHANES surveys of 2007–2010. We did not include NHANES 1999–2006 because serum 25(OH)D concentrations were measured by a different method (i.e. RIA). Between 2007 and 2010, NHANES enrolled 10 362 women. Of those, 6040 women aged ≥20 years had complete data from interviews, laboratory tests and physical examinations. For the present analysis, we excluded women who were pregnant (n 125), women with missing information on serum vitamin D measures (n 704) and women with missing information on hypertension (n 258) or other covariates (n 557). Hence, our statistical analysis included a total of 4396 women (2098 premenopausal women and 2298 postmenopausal women); see Fig. 1 for details.
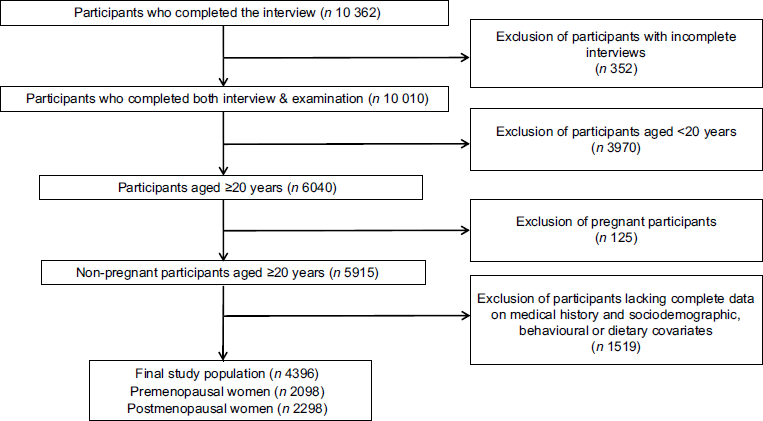
Fig. 1 Flowchart of the study population of women from the National Health and Nutrition Examination Surveys 2007–2010
The National Center for Health Statistics’ Research Ethics Review Board reviewed and approved the study protocol (Continuation of Protocol #2005–06) and written informed consent was obtained from all NHANES participants. NHANES is a publicly available data set. Additional details on study procedures, data documentation and questionnaires are available elsewhere(22,23) .
25-Hydroxyvitamin D measurement
Blood samples were collected from each participant at a mobile examination centre for measurement of serum 25(OH)D concentrations. The blood samples were immediately frozen at −30°C and then shipped to the National Center for Environmental Health (Centers for Disease Control and Prevention, Atlanta, GA, USA) for analysis.
There are two forms of physiologically important vitamin D: ergocalciferol (vitamin D2) and cholecalciferol (vitamin D3). Ergocalciferol is typically obtained from fortified foods and sun-dried mushrooms, while cholecalciferol is synthesized in the skin from 7-dehydrocholesterol upon exposure to UVB (290–320 nm) and is found in oily fish (e.g. salmon, sardines and mackerel), egg yolks and fish oils (e.g. cod-liver oil)(Reference Holick7,Reference Liu, Woo and Wu8) .
Serum samples were measured using ultra-high-performance liquid chromatography–tandem mass spectrometry (UHPLC-MS/MS; ThermoElectron Corp., West Palm Beach, FL, USA) for the quantitative detection of 25-hydroxycholecalciferol (25(OH)D3), 25-hydroxyergocalciferol (25(OH)D2) and 3-epi-25-hydroxycholecalciferol (3-epi-25(OH)D3)(24,25) . Total 25(OH)D concentrations were summed from 25(OH)D3 and 25(OH)D2 concentrations in SI units of nmol/l; total 25(OH)D did not include 3-epi-25(OH)D3 concentrations, a predominant form in infants under the age of 1 year(Reference Singh, Taylor and Reddy26). The CV in NHANES 2007–2010 was 3·0–3·8 % for 25(OH)D3 and 3·8–6·5 % for 25(OH)D2. The range of serum concentrations was within 5·41–213 nmol/l for 25(OH)D; 3·02–212 nmol/l for 25(OH)D3; and 1·45–183 nmol/l for 25(OH)D2. For 25(OH)D levels >1 ng/g, within-set CV was 0·1–0·5 % and between-set CV was 0·2–0·6 %; for 25(OH)D levels <1 ng/g, within-set CV was 0·9–2·9 % and a between-set CV was within 2·0 %(Reference Tai, Bedner and Phinney27).
In the statistical analysis, total 25(OH)D and 25(OH)D3 concentrations were categorized into three groups: <30 nmol/l (deficient), 30–49·99 nmol/l (insufficient) and ≥50 nmol/l (sufficient), based on cut-off points suggested by the US Institute of Medicine(Reference Ross, Taylor and Yaktine28).
Hypertension
Blood pressure measurements were taken during the NHANES examination visit. Systolic blood pressure (SBP) and diastolic blood pressure (DBP) were measured at the mobile examination centre using the Omron HEM 907 XL apparatus (Omron Healthcare, Kyoto, Japan). After taking a rest for 5 min in a sitting position, blood pressure was measured at the maximum inflation level. We computed average values of three consecutive measures in SBP and DBP. Participants fulfilling one or more of the following criteria were defined as having hypertension: (i) mean SBP ≥ 140 mmHg; (ii) mean DBP ≥ 90 mmHg; (iii) the use of antihypertensive medication; and (iv) physician diagnosis.
Menopausal status
Menopausal status was assessed by two sequential questions: ‘Have you had at least one menstrual period in the past 12 months?’ If the participant answered ‘no’, she was then asked ‘What is the reason that you have not had a period in the past 12 months?’ If the participant answered the second question as ‘menopause’ or ‘hysterectomy’, she was characterized as postmenopausal.
Sun exposure via outdoor activities
Sun exposure, the route of natural vitamin D synthesis, was estimated through the time spent in outdoor activities: ‘How much time did you usually spend outdoors between 9 in the morning and 5 in the afternoon on the days that you worked or went to school?’, to which participants answered in ‘number of minutes’. Non-respondents were excluded for data analysis. Outdoor activity was grouped as <30 or ≥30 min/d.
Covariates
We considered participants’ age, race/ethnicity, education, season of examination, physical activity, alcohol consumption, smoking status, dietary intakes (total food energy, K, Ca, Mg and Na) and physical conditions (height, weight, diabetes, hormone therapy and use of birth-control pills) as potential confounders. Age was categorized as 20–29, 30–39, 40–49, 50–59, 60–69 and ≥70 years. Race/ethnicity was categorized as non-Hispanic White (reference), Mexican American, non-Hispanic Black, Hispanic and other. We categorized education as less than 9th grade (reference), high-school graduate or less, and more than high-school graduate. Smoking status was categorized as never (reference), former and current smoker. Alcohol consumption was categorized as never (reference), <once/week, 1–2 d/week, 3–4 d/week and ≥5 d/week. Season of examination was classified as November to April (reference) or May to October. Diabetes was defined as self-reported physician diagnosis or current use of antihypertensive medication. Physical activity was self-reported for three levels of activity intensity (walking, moderate physical activity, vigorous physical activity). We computed each physical activity as a metabolic equivalent of task (MET) value per week; total MET scores were created by summing the weekly MET values for the three levels(Reference Armstrong and Bull29). Information on dietary intakes (total food energy, K, Ca, Mg and Na) was obtained through a 24 h dietary recall interview collected for the 24 h period immediately before the interview at the mobile examination centre. Hormone therapy and use of birth-control pills were self-reported and categorized as non-user or user.
Statistical analysis
Data analyses were performed using SAS survey procedure (version 9.4) in order to take account of the complex survey design and sample weights of NHANES 2007–2010. We computed 4-years sample weights from 2-years weights for 2007–2008 and 2-years weights for 2009–2010 according to NHANES analysis guideline. P values are two-sided and <0·05 was considered statistically significant.
In descriptive analysis, we presented weighted means with their standard errors for continuous variables and weighted percentages for categorical variables; we evaluated the survey t test for continuous variables and the survey (Rao–Scott) χ 2 test for categorical variables. Serum concentrations of total 25(OH)D, 25(OH)D2 and 25(OH)D3 were right-skewed, so presented as geometric means.
The association between total 25(OH)D or 25(OH)D3 concentration and the risk of hypertension was examined using survey logistic regression models (PROC SURVEYLOGISTIC). We did not examine the association between 25(OH)D2 concentration and the risk of hypertension because many women (22·4 %) had a 25(OH)D2 level under the detection limit, not suitable for a reliable statistical analysis. All analyses were examined in stratified populations of pre- and postmenopausal women. In order to assess the influence of potential confounding factors, we evaluated two sequential models, Model A and Model B. Model A considered age, race/ethnicity, education, season of examination, physical activity, alcohol consumption and smoking status. Model B considered Model A covariates plus dietary covariates, i.e. intakes of total food energy, K, Ca, Mg and Na. Odds ratios and 95 % confidence intervals were computed to estimate the association between each 25(OH)D status and the risk of hypertension by comparing each sufficient or insufficient group with the deficient group. Tests of trend were conducted for the ordinal variables of 25(OH)D in logistic regression models using integer values (1–3). In addition, we examined multiplicative interactions between serum 25(OH)D and menopause status on the risk of hypertension, computing the interaction P value using Wald tests.
We also examined associations after further controlling for outdoor activity, a major source of 25(OH)D, in particular 25(OH)D3. Information on outdoor activity was not available for participants of NHANES 2007–2008, so this further analysis was conducted using only a sub-population (n 1736) from NHANES 2009–2010.
In addition, we examined associations between 25(OH)D concentrations and blood pressure using survey linear regression models (PROC SURVEYREG) after excluding women who reported current use of antihypertensive medication (n 1522).
Sensitivity analysis
We conducted sensitivity analyses to test the robustness of our results using alternative classifications of vitamin D status: (i) as two groups of not sufficient v. sufficient: <50 nmol/l and ≥50 nmol/l; (ii) the classification suggested by the US Endocrine Society: <50 nmol/l (deficient), 50–74·99 nmol/l (suboptimal) and ≥75 nmol/l (sufficient)(Reference Holick, Binkley and Bischoff-Ferrari30). Further, we ran multivariate models after further adjusting for an inflammatory marker (i.e. serum C-reactive protein concentration) or physical conditions (i.e. height, weight, diabetes, hormone therapy, use of birth-control pills) and confirmed that our results were robust to various alternative modelling approaches.
Results
Descriptive statistics
Data were available for analysis on a total of 2098 premenopausal women (mean age: 35·7 (se 0·32) years) and 2298 postmenopausal women (mean age: 62·3 (se 0·21) years). Table 1 shows the study population’s general characteristics by menopausal status. In pre- and postmenopausal women, 328 (14·7 %) and 1473 (58·2 %) had hypertension, respectively. The geometric means of serum total 25(OH)D, 25(OH)D3 and 25(OH)D2 concentrations were 61·4, 58·6 and 1·8 nmol/l, respectively, in premenopausal women, while the corresponding values were 66·1, 59·6 and 2·5 nmol/l, respectively, in postmenopausal women. Total 25(OH)D and 25(OH)D2 concentrations were significantly higher in postmenopausal women than premenopausal women.
Table 1 Participant characteristics by menopausal status of the study population of women from the National Health and Nutrition Examination Surveys 2007–2010
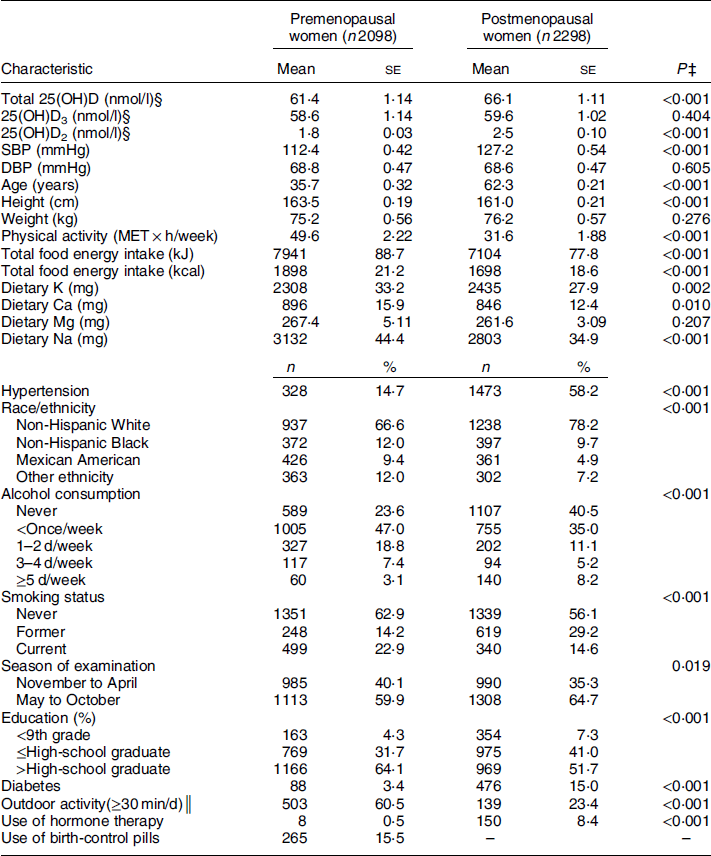
Total 25(OH)D, total 25-hydroxyvitamin D; 25(OH)D3, 25-hydroxycholecalciferol; 25(OH)D2, 25-hydroxyergocalciferol; SBP, systolic blood pressure; DBP, diastolic blood pressure; MET, metabolic equivalent of task.
‡ P < 0·05 is considered significant.
§ Geometric means are presented.
║ Sub-population having outdoor activity information (premenopausal women, n 825; postmenopausal women, n 911).
Table 2 shows participant characteristics by hypertension status in pre- and postmenopausal women. Among premenopausal women, participants with hypertension were likely to be older, to have lower total 25(OH)D and 25(OH)D3, and to have higher SBP and DBP than those without hypertension. Among postmenopausal women, participants with hypertension were likely to be older, to have lower total 25(OH)D and 25(OH)D3, and to have higher SBP than those without hypertension.
Table 2 Participant characteristics by hypertension status of the study population of pre- and postmenopausal women from the National Health and Nutrition Examination Surveys 2007–2010
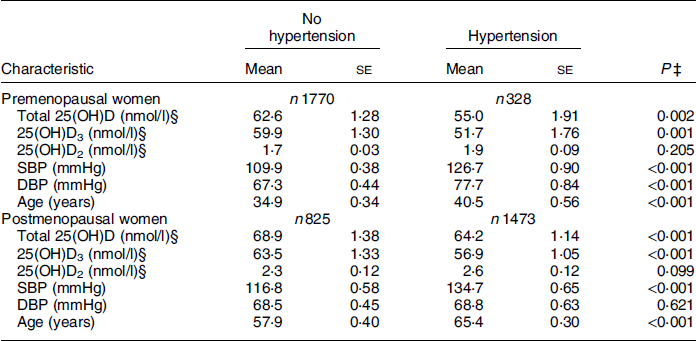
Total 25(OH)D, total 25-hydroxyvitamin D; 25(OH)D3, 25-hydroxycholecalciferol; 25(OH)D2, 25-hydroxyergocalciferol; SBP, systolic blood pressure; DBP, diastolic blood pressure.
‡ P < 0·05 is considered significant.
§ Geometric means are presented.
Serum 25-hydroxyvitamin D concentrations and hypertension in pre- and postmenopausal women
Table 3 presents the associations between serum 25(OH)D concentrations and hypertension in multivariate sequential models both in pre- and postmenopausal women.
Table 3 Odds ratios and 95 % confidence intervals for hypertension (HTN) by total 25-hydroxyvitamin D (25(OH)D) and 25-hydroxycholecalciferol (25(OH)D3) concentrations in the study population of pre- and postmenopausal women from the National Health and Nutrition Examination Surveys 2007–2010
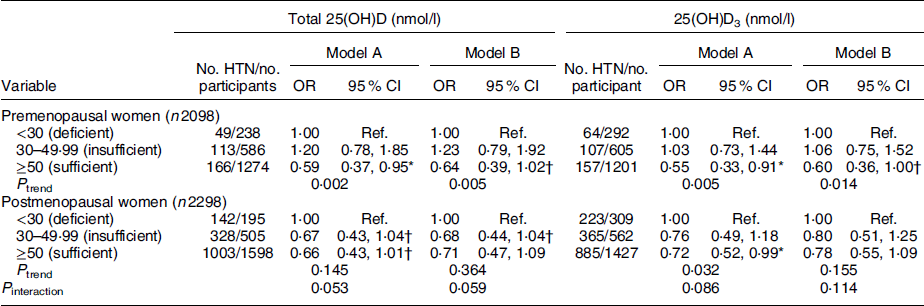
Ref., reference category.
Model A was adjusted for age, race/ethnicity, education, season of examination, physical activity, alcohol consumption and smoking status.
Model B: Model A + further adjusted for dietary covariates (intakes of total food energy, K, Ca, Mg and Na).
*P < 0·05, †P < 0·1 compared with the reference group (vitamin concentrations <30 nmol/l).
Among premenopausal women, higher concentrations both of total 25(OH)D and 25(OH)D3 revealed significant dose-dependent trends with a lower risk of hypertension when controlling for sociodemographic, behavioural and dietary factors (Model B, P trend = 0·005 and 0·014, respectively). Women with sufficient (≥50 nmol/l) total 25(OH)D and 25(OH)D3 had significantly lower risk of hypertension than those with deficient concentrations (<30 nmol/l) in Model A. The fully adjusted OR for hypertension comparing the sufficient v. the deficient groups in total 25(OH)D and 25(OH)D3 was 0·64 (95 % CI 0·39, 1·02, P = 0·062) and 0·60 (95 % CI 0·36, 1·00, P = 0·050), respectively. Neither the association of total 25(OH)D nor the association of 25(OH)D3 with hypertension in the fully adjusted models was observed among postmenopausal women (P trend = 0·364 and 0·155, respectively).
We found stronger associations between 25(OH)D concentrations and lower risk of hypertension in premenopausal women than in postmenopausal women, but effect modification by menopausal status (P interaction = 0·059 for total 25(OH)D and 0·114 for 25(OH)D3) did not reach statistical significance.
We conducted sensitivity analyses using alternative classifications of vitamin D status: (i) two categories (sufficient or not); and (ii) the classification suggested by the US Endocrine Society. When we compared the sufficient group v. the not-sufficient group (see online supplementary material, Supplemental Table S1), a significantly stronger association between total 25(OH)D concentration and lower risk of hypertension was found in premenopausal women than in postmenopausal women, with a significant interaction by menopausal status in the fully adjusted model (P interaction = 0·016). When we used a different classification by the US Endocrine Society (see online supplementary material, Supplemental Table S2), the results were consistent with those obtained using the original classification (Table 3).
Outdoor activity, serum 25-hydroxyvitamin D concentrations and hypertension
Table 4 presents the outdoor activity-adjusted associations between total 25(OH)D or 25(OH)D3 concentration and hypertension in a sub-population with data on outdoor activity, a major source of vitamin D. No associations were observed in either group (premenopausal women, n 825; postmenopausal women, n 911), unlike the significant associations observed in Table 3. This difference was potentially due to lower power because of the smaller sample size.
Table 4 Outdoor activity-adjusted odds ratios and 95 % confidence intervals for hypertension by total 25-hydroxyvitamin D (25(OH)D) and 25-hydroxycholecalciferol (25(OH)D3) concentrations in the study population of pre- and postmenopausal women (n 1736) from the National Health and Nutrition Examination Surveys (NHANES) 2009–2010‡
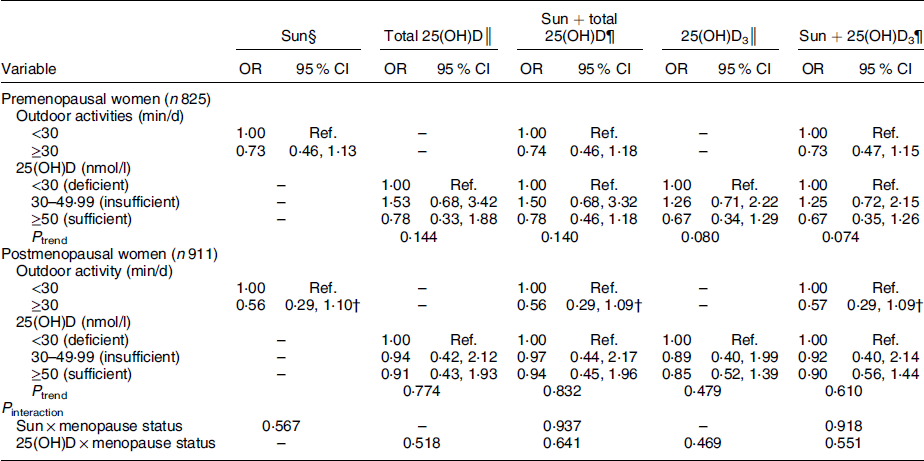
Ref., reference category.
† P < 0·1 compared with the reference group (vitamin concentrations <30 nmol/l; outdoor activity <30 min/d).
‡ These analyses (n 1736) used NHANES 2009–2010 because outdoor activity was not available in NHANES 2007–2008.
§ Outdoor activity models were adjusted for age, race/ethnicity, education, season of examination, physical activity, alcohol consumption, smoking status and dietary covariates.
║ Serum 25(OH)D models were adjusted for age, race/ethnicity, education, season of examination, physical activity, alcohol consumption, smoking status and dietary covariates.
¶ Outdoor activity models were further adjusted for serum 25(OH)D; serum 25(OH)D models were further adjusted for outdoor activity.
Serum 25-hydroxyvitamin D concentrations and blood pressure in pre- and postmenopausal women
Table 5 shows the results of the associations of serum 25(OH)D concentrations with blood pressure levels in pre- and postmenopausal women who were not taking antihypertensive medication.
Table 5 Changes in blood pressure and 95 % confidence intervals by total 25-hydroxyvitamin D (25(OH)D) and 25-hydroxycholecalciferol (25(OH)D3) concentrations in the study population of pre- and postmenopausal women (after excluding participants taking antihypertensive medication) from the National Health and Nutrition Examination Surveys 2007–2010

SBP, systolic blood pressure; DBP, diastolic blood pressure; Ref., reference category.
These models were adjusted for age, race/ethnicity, education, season of examination, physical activity, alcohol consumption, smoking status and dietary covariates.
*P < 0·05, †P < 0·1 compared with the reference group (vitamin D concentrations <30 nmol/l).
Among premenopausal women (n 1824), those with sufficient total 25(OH)D (≥50 nmol/l) had significantly lower SBP (–3·08 mmHg (95 % CI −5·69, −0·47 mmHg), P = 0·022) and lower DBP (–2·38 mmHg (95 % CI −4·84, 0·07 mmHg), P = 0·057) than those with deficient total 25(OH)D (<30 nmol/l). Among postmenopausal women (n 1050), those with sufficient total 25(OH)D had no significant change in SBP and DBP compared with those with deficient total 25(OH)D. We found a significant interaction in DBP (P interaction = 0·021), whereas SBP did not show a significant interaction by menopause status. The results for the associations between 25(OH)D3 and blood pressure levels were similar to those for total 25(OH)D.
Discussion
In the current study of a representative sample of US female adults, strong associations between serum 25(OH)D concentrations and the risk of hypertension were found in premenopausal women, while weak or null associations between serum 25(OH)D concentrations and the risk of hypertension were found in postmenopausal women.
To our knowledge, the present study is the first to examine the association of vitamin D status and the risk of hypertension according to menopausal status. After adjusting for sociodemographic, behavioural and dietary factors in data on our group of premenopausal women, higher concentrations of both total 25(OH)D and 25(OH)D3 revealed significant dose-dependent trends with the lower risk of hypertension; and women with sufficient vitamin D status (i.e. serum total 25(OH)D or 25(OH)D3 concentration ≥50 nmol/l) were observed to have a protective effect against hypertension (OR = 0·64 for total 25(OH)D and OR = 0·60 for 25(OH)D3; see Model B in Table 3). However, neither the dose-dependent trend of total 25(OH)D nor of 25(OH)D3 with hypertension was observed in our group of postmenopausal women. Because there has been no epidemiological study that examines the association between 25(OH)D and hypertension in a population of premenopausal women, it is impossible to compare our results with previous studies. A recent study of mixed-effect meta-analysis, performed to estimate the pooled effect of high 25(OH)D on hypertension in women <55 years of age, reported a pooled OR of 0·62 (95 % CI 0·44, 0·87)(Reference Ke, Mason and Kariuki12), which is comparable to our observations in premenopausal women.
There is plausible biological evidence to support the role of vitamin D in vascular health in general and the risk of high blood pressure. Several underlying mechanisms that link vitamin D to regulation of blood pressure have been suggested, as follows. First, vitamin D down-regulates the renin–angiotensin system, interacting with the renin–angiotensin system and Na to influence vascular smooth muscle tone, and indirectly influencing the endothelium(Reference Reis, Lutsey and Gombart31). Indeed, an experimental study using mice lacking the vitamin D receptor showed increased renin activity, development of hypertension, and more susceptibility to obstructive renal injury(Reference Li, Kong and Wei9). Second, sufficient vitamin D suppresses parathyroid hormone (PTH) in Ca homeostasis, while low vitamin D leads to a rise in PTH and arterial resistance leading to hypertension(Reference Saleh, Schirmer and Sundsfjord32). Third, vitamin D may improve endothelial function by reducing oxidative stress and down-regulating angiotensin II type 1 receptors (AT1)(Reference Dong, Wong and Lau33).
Numerous epidemiological studies have examined the relationship between 25(OH)D and blood pressure or hypertension, but their findings have been inconsistent. Several meta-analyses based on observational studies of 25(OH)D(Reference Ke, Mason and Kariuki12), intervention studies of vitamin D supplementation(Reference Beveridge, Struthers and Khan34) and a mendelian randomization study of 25(OH)D(Reference Vimaleswaran, Cavadino and Berry35) failed to support a consistent effect of vitamin D status on blood pressure or hypertension. Interestingly, a recent review of 25(OH)D status and hypertension conducted by Ke et al. suggested markedly stronger evidence in younger women <55 years of age but no evidence in older women ≥55 years of age, although the cause of these differing results is still puzzling(Reference Ke, Mason and Kariuki12).
In the current study, the potential cause of our results, with apparent findings in premenopausal women but null findings in postmenopausal women, may be the change of oestrogen secretion around menopause(Reference Lim, Kim and Lee36). In fact, previous studies revealed a negative relationship between oestrogen levels and hypertension. In animal models, Nickenig et al. found that oestradiol down-regulates the AT1 receptor gene expression in vascular smooth muscle cells(Reference Nickenig, Baumer and Grohe37). Therefore, reductions in oestradiol would tend to activate the renin–angiotensin system and cause an increase in blood pressure. In particular, oestradiol up-regulates the transcription and expression of the vitamin D receptor in in vivo models(Reference Gilad, Bresler and Gnainsky38). It may therefore be the case that as oestrogen down-regulates the expression of AT1 receptor or up-regulates vitamin D receptor expression, those mechanisms serve to protect against hypertension in premenopausal women.
Another potential cause of our findings is the change of body weight around menopause that may cause vitamin D deficiency. Menopause is associated with obesity because women after menopause lose fat-free mass, tend to exercise less and have greater increases in fat mass(Reference Lovejoy, Champagne and de Jonge39). Also, Wortsman et al. found that obese individuals are susceptible to low concentrations of 25(OH)D because of the decreased bioavailability of vitamin D from cutaneous and dietary sources, that is fat soluble and readily sequestered in adipose tissue(Reference Wortsman, Matsuoka and Chen40). Indeed, Ke et al. suggested that confounding by healthy lifestyle variables, in particular obesity, may account for the association seen between 25(OH)D and hypertension(Reference Ke, Mason and Kariuki12). Therefore, we cannot rule out a possibility that weight gain in postmenopausal women may be one of the reasons for weaker associations between 25(OH)D and blood pressure in postmenopausal women compared with premenopausal women.
When we controlled for physical conditions (height, weight, diabetes, hormone therapy and use of birth-control pills), our observed association between total 25(OH)D or 25(OH)D3 and hypertension became less significant (see online supplementary material, Supplemental Table S3). Specifically, we confirmed from sensitivity analysis that lowered significance was caused by adding the weight covariate to the model (data not shown). Those observations accord with previous studies, namely that adjusting for BMI results in a lower association between 25(OH)D intake and blood pressure(Reference Kim, Chung and Jung41,Reference He and Scragg42) . Those studies explained, however, that it is still unclear whether weight is a confounder or an intermediary in the possible causal pathway between 25(OH)D and blood pressure. Also, we considered an inflammatory marker known to be associated with hypertension(Reference Sesso, Wang and Buring43) as a potential confounder. When we controlled for serum C-reactive protein concentration in statistical models, the associations between 25(OH)D and hypertension became less significant but consistent with the results without adjustment for C-reactive protein concentration (see online supplementary material, Supplemental Table S4).
We further examined associations between 25(OH)D and hypertension after controlling for outdoor activity, the major pathway to achieve vitamin D through sun exposure; however, controlling for outdoor activity did not alter those associations. There is the possibility that measuring outdoor activity may mainly capture physical exercise, which itself may also reduce the risk of hypertension. Therefore we cannot rule out misclassification of physical exercise and its residual confounding of outdoor activity.
One might argue that our observed associations could be caused by age difference, as suggested by Maas and Franke(Reference Maas and Franke21), because menopausal status is so highly correlated with women’s age. In order to determine that our observations were due to menopausal status and not to age, we would need to compare the results in premenopausal v. postmenopausal women among a subset of young women (<55 years of age) and among a subset of old women (≥55 years of age). We did not conduct the analyses, however, because the number of postmenopausal women in a subset of women <55 years of age and the number of premenopausal women in a subset of women ≥55 years of age were too small for a reliable statistical analysis. Instead, we conducted another sensitivity analysis of 25(OH)D concentrations and risk of hypertension in men, and no significant difference was observed in young compared with old men (data not shown).
We cannot rule out the possibility that associations accorded to menopausal status may be due to differences in personal characteristics. We therefore examined interaction models by all characteristics listed above and were able to confirm that associations between serum 25(OH)D and hypertension did not depend on those factors, varying only in regard to diabetes mellitus (data not shown).
Major strengths of the present study include our use of data from a representative sample of US women, which supports the increased power for our findings. Additionally, we adjusted our models for a variety of potential confounding factors including various dietary intakes and medical treatment, and our results persisted after adjustment for those factors. Our study used serum 25(OH)D as an exposure biomarker that is able to capture both vitamin D from outdoor activities and vitamin D via food and/or supplement intake. Nevertheless, the present study has several limitations. First, because of the study’s cross-sectional design, we cannot demonstrate causality. Second, although we controlled for a variety of potential confounders there is still the possibility of residual confounding. Because there were no data available in NHANES 2007–2010, we did not control for serum PTH as a covariate, although PTH, a calciotropic hormone, is suggested as a mediator in the association between vitamin D and hypertension in which a decrease in serum vitamin D leads to a rise in serum PTH, and elevated PTH has been linked to hypertension(Reference He and Scragg42). Finally, although we used a commonly used biomarker to estimate vitamin D status, our measures from total 25(OH)D and 25(OH)D3 may not be able to capture bioavailable vitamin D body stores. A recent study by Yu et al. suggests that bioavailable and free 25(OH)D are emerging measurements of vitamin D and reports that serum bioavailable and free 25(OH)D rather than total 25(OH)D level may be useful in prediction for all-cause and cardiovascular mortality(Reference Yu, Xue and Wang44). Because there were no data available in NHANES, we did not investigate the associations of bioavailable and free 25(OH)D with the risk of hypertension.
Conclusion
In conclusion, the present study suggests a significant association between 25(OH)D status and hypertension in premenopausal women. Women are likely to have vitamin D deficiency because of their negative attitudes towards outdoor activities, including fair skin preference, and indoor-oriented lifestyle(Reference Jang, Koo and Ke45,Reference Ke, Mason and Mpofu46) . Our findings suggest that at least moderate vitamin D status could effectively reduce the risk of hypertension in premenopausal women. In addition to outdoor activities in sunshine (20–30 min of daytime, 2–3 times weekly)(Reference Pearce and Cheetham47), a diet rich in vitamin D (oily fish such as salmon, sardines and mackerel, egg yolks, sun-dried mushrooms) and over-the-counter supplementation(Reference Holick7) may contribute to a reduced risk of hypertension in premenopausal women.
Acknowledgments
Acknowledgments: This study analysed data provided by the National Health and Nutrition Examination Survey 2007–2010. Financial support: This work was supported by the Basic Science Research Program through the National Research Foundation of Korea (NRF) funded by the Korea Ministry of Education (grant numbers 2013R1A6A3A04059556 and 2017R1A6A3A11034504) and the Korea Ministry of Science and ICT (grant number 2015R1C1A2A01054768). Conflict of interest: None of the authors reported a conflict of interest. Authorship: J.H.K. and Y.-H.C. designed and created the study concept; J.H.K. acquired the data, performed the statistical analysis and wrote the paper; Y.-C.H. and Y.-H.C. contributed critical advice and revisions of the manuscript; J.H.K. and Y.-H.C. had responsibility for the entire content of the manuscript and obtained funding; Y.-H.C. supervised the study; and all authors had full access to the study data and read and approved the final manuscript. Ethics of human subject participation: Not applicable.
Supplementary material
To view supplementary material for this article, please visit https://doi.org/10.1017/S1368980019003665


