


Older adults gradually lose muscle mass, muscle strength and physical function with age which increases the risk of falls, frailty, disability and all-cause mortality(Reference Cruz-Jentoft, Bahat and Bauer1–Reference Malmstrom, Miller and Simonsick3). Dietary protein, in excess of the current recommended dietary allowance, 0·8 g/kg body weight (BW)/d according to the European Food Safety Authority(4) and the Institute of Medicine(5), has been proposed to slow the decline of age-related muscle strength in older adults(Reference Bauer, Biolo and Cederholm6). However, the relation between protein intake and grip strength, often used as measure of overall muscle strength, is inconsistent across the literature, and very limited for strength decline over time. Prospective observational studies showed that higher protein intake was associated with higher grip strength(Reference McLean, Mangano and Hannan7–Reference Isanejad, Mursu and Sirola10), while some have not(Reference Kim, Kim and Eun11,Reference Hengeveld, Chevalier and Visser12) . Higher protein intake has also been associated with a slower rate of decline in grip strength over time(Reference McLean, Mangano and Hannan7,Reference Beasley, Wertheim and LaCroix8,Reference Isanejad, Mursu and Sirola10) , while others have not found similar results(Reference Granic, Mendonça and Sayer9,Reference Kim, Kim and Eun11,Reference Hengeveld, Chevalier and Visser12) .
Several expert groups have proposed that the beneficial effect of higher protein intake on muscle strength may work in synergy with physical activity (PA)(Reference Bauer, Biolo and Cederholm6,Reference Deutz, Bauer and Barazzoni13) . Since both protein intake and PA stimulate muscle protein synthesis, combining both approaches may better protect muscle mass and muscle strength than each alone(Reference Bauer, Biolo and Cederholm6,Reference Deutz, Bauer and Barazzoni13) . However, few observational studies have addressed this issue and evidence is inconclusive(Reference Granic, Mendonça and Sayer9,Reference Ten Haaf, Nuijten and Maessen14) . In many instances, lack of statistical power in individual studies does not allow for testing the interaction between protein intake and PA, or for achieving robust estimates(Reference Burke, Ensor and Riley15). We overcome this limitation by pooling individual participant data from multiple ageing cohorts. In this study, we hypothesise that higher protein intake slows down the rate of muscle strength decline in older adults in a dose-dependent manner and has a synergistic effect with PA. In order to test our hypothesis, we investigated the prospective relationship between protein intake, and its interaction with PA, and (decline in) grip strength in four longitudinal cohorts in the PROMISS consortium.
Methods
Included cohorts and study population
As part of the PROMISS consortium, four longitudinal prospective observational studies of community-dwelling older adults aged > 55 years were included: (a) The Health, Aging and Body Composition Study (Health ABC) from the USA, (b) The Quebec Longitudinal Study on Nutrition and Successful Aging (NuAge) from Canada, now the NuAge Database and Biobank (database received on May 2019), (c) The Longitudinal Aging Study Amsterdam (LASA) from the Netherlands and (d) The Newcastle 85+ Study from the UK. These studies are described in detail elsewhere(Reference Hengeveld, Wijnhoven and Olthof16–Reference Gaudreau, Morais and Shatenstein19). Briefly, Health ABC is a longitudinal cohort study that included 3075 well-functioning community-dwelling Black and White males and females aged 70–79 years at baseline living in the USA. Participants were recruited from Medicare-eligible residents in the metropolitan areas of Memphis, Tennessee, and Pittsburgh, Pennsylvania, between April 1997 and June 1998 and followed annually (clinic visit) or every 6 months (telephone interview) for 16 years(Reference Hengeveld, Wijnhoven and Olthof16). NuAge is a longitudinal cohort that recruited 1793 generally healthy community-dwelling males and females aged 67–84 years living in Montreal and Sherbrooke areas (Quebec, Canada) in 2003–2005 and followed them annually (clinic visit) or every 6 months (telephone interview) for 3 years(Reference Gaudreau, Morais and Shatenstein19). LASA is an ongoing nationally representative longitudinal study of older males and females aged ≥ 55 years residing in the Netherlands. The study started in 1992/93 (n 3107), and participants were followed every 3 years until 2018/2019 (most recent wave; wave J). Two additional cohorts were recruited from the same sampling frames at 10 (2002/2003, n 1002) and 20 years (2012/2013, n 1023) after the baseline(Reference Hoogendijk, Deeg and Poppelaars17). The Newcastle 85+ Study is a longitudinal population-based study that approached all people turning 85 years in 2006/2007 (born in 1921) in Newcastle and North Tyneside, UK. At baseline, there were 845 very old males and females who agreed to a health assessment and a review of their GP records(Reference Collerton, Davies and Jagger18), who were re-examined after 18, 36 and 60 months. We used year 2 (baseline), 4, 6, 8 and 10 from Health ABC; T1 (baseline), T2, T3 and T4 from NuAge; wave 3B, the Nutrition and Food-related Behavior sub study (baseline) and wave I from LASA; and phase 1 (baseline), 2, 3 and 4 from the Newcastle 85+ (online Supplementary Fig. 1).
We excluded participants who were institutionalised (n 44), had very poor cognitive status (score < 18 in the Mini-Mental State Examination or with diagnosed dementia) and no proxy for dietary assessment (n 18), had missing dietary intake data (n 800), had very high reported energy intake, that is, > 3500 kcal/d for women or > 4000 kcal/d for men (n 52), had no data on BMI (n 58) or missing grip strength (n 141). The analytic sample at baseline comprised 5584 community-dwelling participants (online Supplementary Fig. 1).
Dietary assessment
For all studies, data on dietary intake were available at baseline (referred to as wave 1 in our study). Dietary intake was assessed in Health ABC by a 108-item interviewer-administered FFQ reflecting the preceding 12 months in year 2(Reference Block, Hartman and Dresser20), in NuAge by three 24-h recalls (one face to face and two by telephone) on two weekdays and one weekend day in T1(Reference Gaudreau, Morais and Shatenstein19), in LASA by a self-administered 238-item FFQ reflecting the preceding 4 weeks and collected from fall to spring in the ‘Nutrition and Food-related Behavior Study 2014–2015’ sub study(Reference Elstgeest and Visser21,Reference Visser, Elstgeest and Winkens22) , and in Newcastle 85+ by two 24-h recalls on two non-consecutive weekdays at least 1 week apart in phase 1(Reference Mendonça, Hill and Granic23,Reference Mendonça, Hill and Granic24) . In all studies, energy and protein intake were calculated by using country-specific food composition databases. In Newcastle 85+ and NuAge, individual intakes of protein and energy were averaged within the two or three recall days, respectively.
Energy intake was transformed into cohort-specific z-scores. For participants with a BMI outside the desirable range for older adults of 22–27 kg/m2, BW was adjusted to be within the desired BMI range and calculated as previously described(Reference Berner, Becker and Wise25,Reference Mendonça, Granic and Mathers26) . By calculating adjusted BW (aBW), we attempted to control for the deficit and excess protein intake needs in underweight and overweight people, respectively. Protein intake was expressed per kg of aBW/d (measured at baseline as well), categorised into < 0·8, 0·8–< 1·0, 1·0–< 1·2 and ≥ 1·2 g/kg BW/d and g/kg aBW/d, and used as exposure. These cut-offs were based on expert recommendations for optimal protein intake(Reference Bauer, Biolo and Cederholm6,Reference Deutz, Bauer and Barazzoni13) , or currently used recommended dietary allowances for protein (e.g. 0·8 is recommended by the European Food Safety Authority(4) and the Institute of Medicine(5), 1·0 by the European DACH (Germany, Austria and Switzerland) countries(Reference Richter, Baerlocher and Bauer27) and 1·2 by the European Nordic countries(28)), or on previously published studies on protein intake in older adults(Reference Granic, Mendonça and Sayer9,Reference Hengeveld, Wijnhoven and Olthof16,Reference Mendonça, Granic and Mathers26,Reference Mendonça, Granic and Hill29–Reference Mendonça, Kingston and Granic33) . All variables are described in Supplementary Table 1.
Physical activity
In Health ABC, PA was measured by a specifically designed questionnaire as described previously(Reference Visser, Simonsick and Colbert34). Participants indicated whether they had performed exercise in the past 7 d and for how long they spent in each activity. A metabolic equivalent (MET) value in kcal per week per kilogram of BW was determined for each activity and total PA calculated as MET values for each activity × BW. In NuAge, PA was measured using the validated self-reported Physical Activity Scale for the Elderly (PASE) which asked about the frequency, duration and intensity of activities during the past 7 d(Reference Washburn, McAuley and Katula35). The total PA score was calculated as time spent on each activity (in hours per week) × item weights and then summed(Reference Fiocco, Shatenstein and Ferland36). PA in LASA was measured with a validated questionnaire that estimates the frequency and duration and intensity of specific activities in the previous 14 d(Reference Stel, Smit and Pluijm37). MET scores were assigned to each activity based on published MET scores lists(Reference Ainsworth, Haskell and Leon38). The frequency × duration × MET was calculated for each activity, summed over and then divided by 14 d. In Newcastle 85+, a validated purposely designed PA questionnaire included questions on how frequently participants engaged in mildly, moderately and highly energetic activities. The resulting total PA score was calculated as 3 × highly energetic activities + 2 × moderately energetic activities+mildly energetic activities(Reference Innerd, Catt and Collerton39). PA at baseline was transformed into cohort-specific tertiles (categorised as low, medium and high) and used to categorise PA for subsequent waves. Lower, medium and higher PA in Health ABC was considered as 0–3·27, 3·28–14·20 and ≥ 14·20 kcal/BW/week, respectively; in NuAge as a PASE score of 0–71·3, 71·4–115·4 and ≥ 115·5, respectively; in Newcastle 85+ as a specialised questionnaire score of 0–2, 3–6 and ≥ 7, respectively; and in LASA as 0–32, 32·1–59 and ≥ 59 MET h/week, respectively.
Muscle strength
Grip strength was used as an objective measure of upper-body and general muscle strength and was used as our outcome(Reference Rijk, Roos and Deckx40). In Health ABC, grip strength was measured twice on each hand with an isometric dynamometer (JAMAR). Participants who underwent recent hand surgery or had severe hand pain were excluded. In NuAge, grip strength was measured three times on each hand with a pneumatic dynamometer (Martin Vigorimeter) and expressed in KPa(Reference Hengeveld, Chevalier and Visser12). In LASA, grip strength was measured twice on each hand with a hydraulic dynamometer (Model JAMAR 5030J1). The dynamometer was adjusted for hand size. In Newcastle 85+, grip strength was measured twice (alternating sides) on each hand with an isometric dynamometer (Model A5401, Takei Scientific Instruments)(Reference Granic, Mendonça and Sayer9). In NuAge and LASA, participants were in a sitting position with arms alongside the body with elbows at 90°, whereas in Health ABC participants were sitting but with arms rested on the table and elbows at 90°. In Newcastle 85+, participants were standing with arms alongside the body and elbows at 90°. In all cohorts, the mean grip strength value of the maximum measurement of each hand was used for analysis. Grip strength measured by dynamometer and measured by vigorimeter shows a high correlation(Reference Neumann, Kwisda and Krettek41). For descriptive purposes, we converted grip strength measured by vigorimeter (in KPa) into kg using a factor of 0·46 as has been previously used(Reference Neumann, Kwisda and Krettek41). Furthermore, since methods to assess grip strength were different between cohorts, grip strength at baseline was transformed into sex- and cohort-specific z-scores, and the mean and sd were used to create z-scores for the other waves (z = (x–µ)/σ) where x stands for raw score, µ for population mean and σ for sd.
Mortality
Ascertainment of vital status differed between cohorts and ranged from a review of hospital records and obituaries to linkage with the National Mortality Registry. In Health ABC, survival time was calculated as the time between age at year 2 (1998–1999) and age of death (censored at 30 September 2014); in NuAge, survival time was calculated as the time from age at T1 (2003–2005) to age of death (censored at 3 May 2010); in LASA, survival time was calculated as the time from age at wave 3B (2012–2013) to death (censored at 22 July 2018); and in Newcastle 85+, survival time was calculated as the time from age at phase 1 (2006–2007) to age of death (censored at 16 January 2018).
Other sociodemographic, anthropometric, lifestyle and health variables used are described in Supplementary Table 1.
Statistical analyses
Data cleaning, quality control and harmonisation were performed separately for each cohort prior to merging. In order to be harmonised, grip strength was transformed into sex- and cohort-specific z-scores, energy intake into cohort-specific z-scores, and PA and cognition into cohort-specific tertiles. Harmonisation of other sociodemographic, anthropometric, lifestyle and health variables is described in Supplementary Table 1. All harmonised variables were merged to create one dataset. Normality was assessed by Q–Q plots: normally and non-normally distributed variables are presented as means and standard deviations, and medians and interquartile ranges, respectively, and categorical data as percentages and frequency. To determine the association between protein intake and grip strength, we fitted a hierarchical linear mixed effects models with the lme4 package (version 1.1-20)(Reference Bates, Mächler and Bolker42) and Cox proportional hazards for time-to-event data (mortality or censoring) with the survival package (version 2.43-3)(Reference Terry and Therneau43). Briefly, exposure, outcome, confounders and effect modifiers were selected based on their theoretical and clinical relevance, group imbalance (protein intake categories) and their position in directed acyclic graphs. Models with these variables were then fitted, removed and refitted until the best possible and parsimonious model converged. Clustering by cohort was accounted for by the inclusion of a random term for study membership. If data are missing at random, it is accounted for in linear mixed models, but in a longitudinal cohort with a mean age of 75 years at baseline, attrition is high(Reference Davies, Kingston and Robinson44) and failure to account for mortality (data not missing at random) would likely result in biased estimates(Reference Amelia, Bobby and Daniel45). These outcomes (grip strength and mortality) are typically analysed separately, but joint models analyse the two outcomes together with shared parameters in a single likelihood function (maximum likelihood estimation). We therefore fitted joint models with the JoineRmeta package (version 0.1.2) in R v3.6.3(Reference Sudell, Kolamunnage-Dona and Tudur46).
Separate models for the association between protein intake and grip strength were fitted. Model l included id (random effect), time since baseline (random effect) and study membership (time-independent and random effect), protein intake (time-independent) and its interaction with time, age (time-dependent), sex (time-independent), height (time-independent) and education (time-independent); model 2 was adjusted for the previous variables plus smoking (time-independent), energy (time-independent) and alcohol intake (time-independent); model 3 was further adjusted for multimorbidity (time-dependent) and cognitive status (time-dependent); and model 4 was further adjusted for PA (time-dependent; except if the model was stratified by PA level). Models 1–3 were also stratified by PA level. Apart from id, study membership and time since baseline, all terms in the models are fixed effects.
Sensitivity analyses
As a sensitivity analysis, model 4 (fully adjusted) was re-run with 0·8–< 1·0 g/kg aBW/d of protein intake as referent, or with protein in g/kg BW/d (hence with non-adjusted BW), or with percentage of total energy from protein (%), or with protein intake per MJ of energy, or further adjusted for BMI (time-dependent), or weight (time-dependent), or inputting the missing values for multimorbidity and cognitive status (if this was available at an adjacent observation of the same participant), excluding each of the cohorts from the analysis, or using cohort-specific z-scores of grip strength (not sex-specific). Point estimates and CI were used to assess statistical and clinical significance. Results are presented as βs and 95 % CI (determined by refitting the models to 150 bootstrap samples).
Results
More women and more older adults with a lower cognitive status had missing data on grip strength. All other health and sociodemographic characteristics were similar between those with and those without grip strength (online Supplementary Table 2).
Protein intake, health and sociodemographic characteristics
The analytic sample consisted of 5584 men (47·4 %) and women (52·6 %) with a median age of 75·0 (interquartile range: 71·6–79·0) years at baseline. Maximum follow-up time was 8·5 years (mean: 4·9, sd: 2·3 years), and maximum survival time until event or censoring was 16·2 years (mean: 7·6, sd: 5·1). Most participants were from the Health ABC study (45·6 %), followed by NuAge (30·8 %), Newcastle 85+ (12·8 %) and LASA (10·8 %) (Table 1 and online Supplementary Fig. 1). At baseline, 27 (n 1530), 23 (n 1304), 21 (n 1195) and 28 % (n 1555) of the participants had a protein intake < 0·8, 0·8–< 1·0, 1·0–< 1·2 and ≥ 1·2 g/kg aBW/d, respectively. Most of the participants with protein intake < 0·8 g/kg aBW/d were from the Health ABC study (65·2 %), while most participants with protein intake ≥ 1·2 g/kg aBW/d were from NuAge (37·6 %). Participants with higher protein were more often alcohol drinkers, had higher energy intake and had generally higher PA. For example, 29·3 % of those with protein intake < 0·8 g/kg aBW/d and 39·1 % of those with protein intake ≥ 1·2 g/kg aBW/d had a high level of PA. Age, body height and cognitive status were statistically different between protein intake categories but not clinically significant (Table 1). There was no evidence of a difference in mortality by protein intake category (online Supplementary Fig. 2). Health and sociodemographic characteristics by wave of follow-up, cohort and protein intake categories, and protein intake categories and PA are shown in Supplementary Tables 3–5. Grip strength was lowest in Newcastle 85+ (17·9 (13·4, 23·9) kg) and highest in LASA (31·5 (24·5, 43·5) kg) at baseline (online Supplementary Table 3). Grip strength decreased from 28·0 (21·5, 35·8) at baseline to 25·0 (20·0, 32·9) kg at wave 5 (last follow-up time point), which meant a decrease of 0·45 (0·94) sds over the follow-up (online Supplementary Table 4).
Table 1. Health and sociodemographic characteristics of participants by protein intake category (g/kg aBW/d) at baseline and muscle strength during follow-up (Numbers and percentages)

aBW, adjusted body weight; IQR, interquartile range; Health ABC, Health, Aging and Body Composition Study; NuAge, Quebec Longitudinal Study on Nutrition and Successful Aging; LASA, Longitudinal Aging Study Amsterdam; N85+, Newcastle 85+ Study.
Cognition was assessed with the Mini-Mental State Examination. Smokers and alcohol drinkers represent current consumers. Z-scores and tertiles are cohort-specific, and z-scores for grip strength are also sex-specific. Protein (% energy) refers to the percentage of total energy from protein.
Protein intake and muscle strength
In our models, sex- and cohort-specific grip strength declined on average by 0·018 sd (95 % CI –0·026, –0·006) every year since baseline. We found no associations between protein intake (< 0·8 (referent), 0·8–< 1·0, 1·0–< 1·2 and ≥ 1·2 g/kg aBW/d and g/kg) and grip strength (sex- and cohort-specific z-score) and rate of decline of grip strength after adjustment for sex, age, education and height (model 1). The results were similar in more complex models (models 2–4) further adjusted for smoking, energy and alcohol intake, cognition, multimorbidity and PA (e.g. model 4; protein intake ≥ 1·2 v. 0·8 g/kg aBW/d: β = –0·003, 95 % CI –0·014, 0·005 sd per year) (Fig. 1).
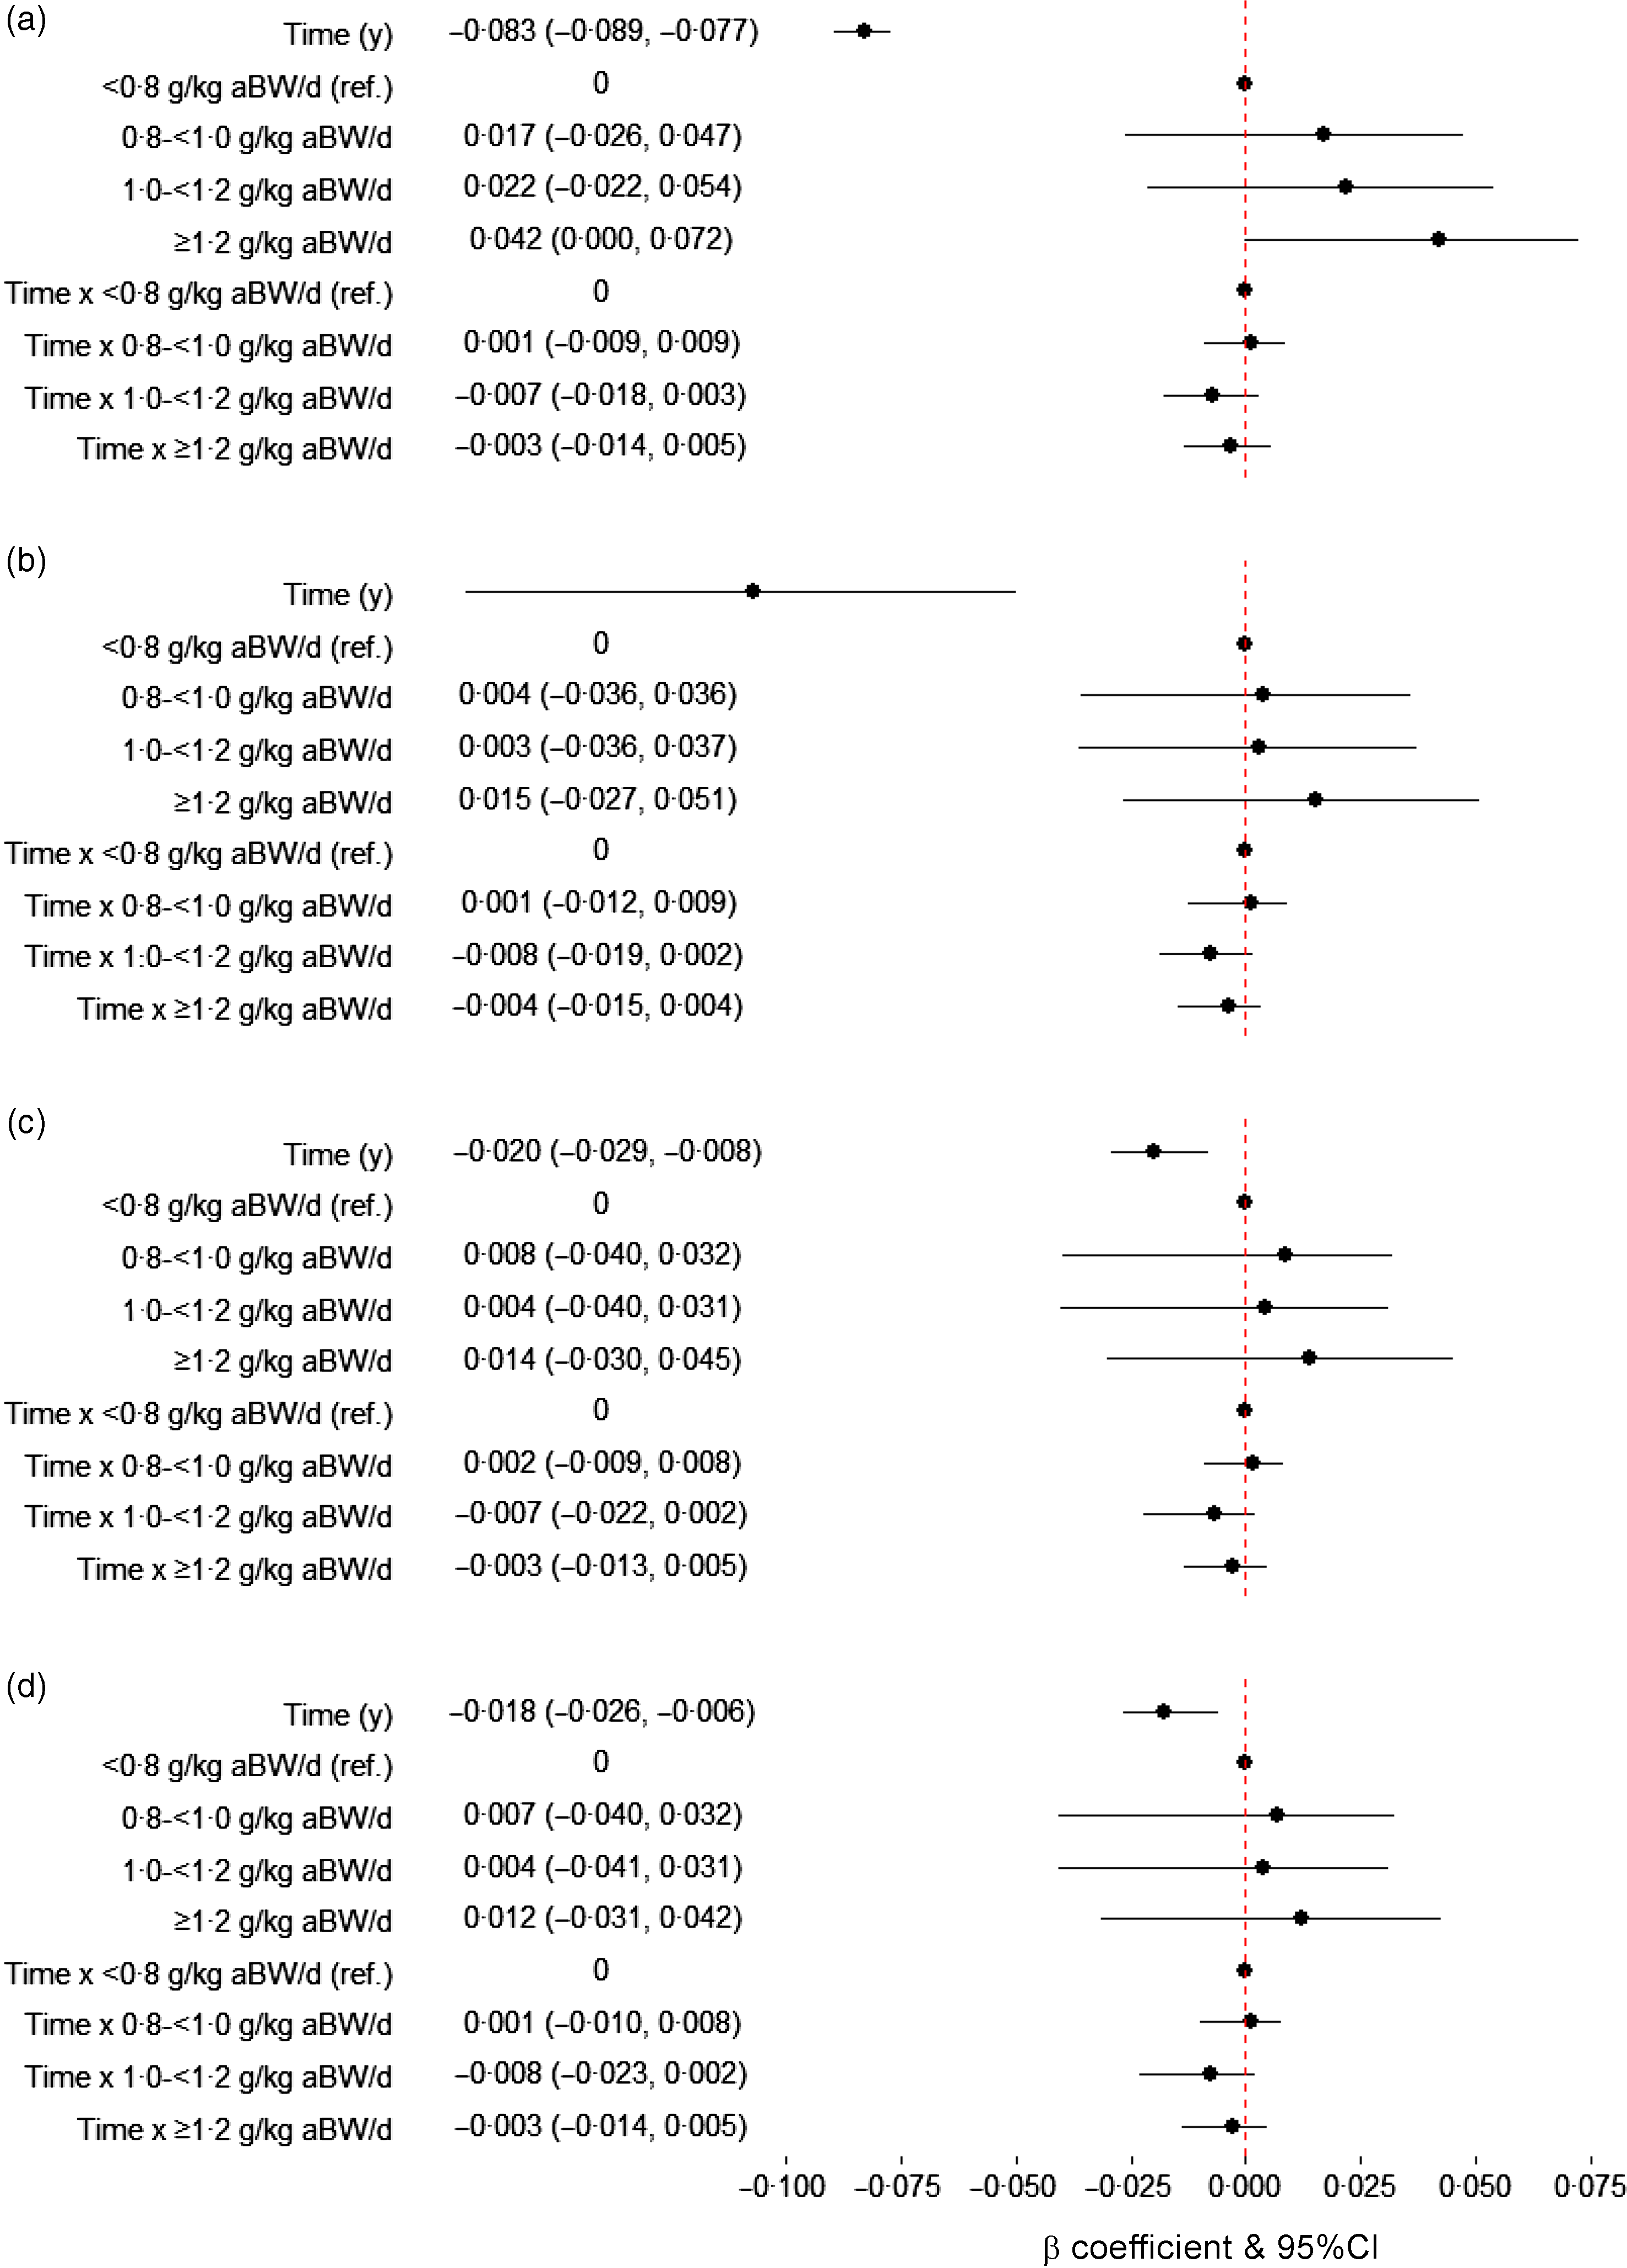
Fig. 1. Association between protein intake (g/kg aBW/d) at baseline and grip strength (sex- and cohort-specific z-score) over time. Model 1 (a) is adjusted for sex, age, education and height (n 18809 person-years). Model 2 (b) is further adjusted for smoking and, energy and alcohol intake (n 18794 person-years). Model 3 (c) is also adjusted for cognition (Mini-Mental State Examination) and multimorbidity (n 18663 person-years), and model 4 (d) is further adjusted for physical activity (n 18643 person-years). Results are presented as β coefficients and 95 % CI in the x-axis and the terms of interest in the y-axis. The β coefficient and 95 % CI for the term time (y) in panel (B) is –0·107 (–0·169, –0·050). educ, Education; g/kg aBW/d, grams of protein per kilogram of adjusted body weight per d; ref, referent.
Final models were re-run with 0·8–< 1·0 g/kg aBW/d of protein intake as referent, or with protein in g/kg BW/d (hence with non-adjusted BW), or with percentage of total energy from protein (%), or with protein intake per MJ of energy (online Supplementary Table 6), or further adjusted for BMI (time-dependent), or weight (time-dependent), or inputting the missing values for multimorbidity and cognitive status (if these were available at an adjacent observation of the same participant), or excluding each of the cohorts from the analysis (online Supplementary Fig. 3), or using cohort-specific z-scores of grip strength (not sex-specific), but none of these substantially changed the results. For example, participants with protein intake < 0·8, 1·0–< 1·2 and ≥ 1·2 g/kg aBW/d had similar rates of grip strength decline than those with 0·8–< 1·0 g/kg aBW/d (β = –0·001, 95 % CI –0·010, 0·007; β = –0·009, 95 % CI –0·020, 0·002; β = –0·004, 95 % CI –0·014, 0·005 sd per year, respectively). However, it is worth noting that, although not significant, the sensitivity analysis excluding HABC from the fully adjusted model resulted in the change of direction of the estimates for protein intake (not rate of decline) (online Supplementary Fig. 3).
Interaction between protein intake and physical activity
We found no clear interaction between protein intake and PA (all possible interactions P > 0·05, e.g. protein intake ≥ 1·2 g/kg aBW/d × high PA, β: –0·013, 95 % CI –0·113, 0·059). We also stratified the fully adjusted models by PA (low, medium and high) and found no strong evidence of protein intake being associated with grip strength in any PA category (Fig. 2). However, there was trend for higher protein intake to be associated with faster decline in grip strength within participants with low PA but not within medium or high PA (e.g. time × ≥ 1·2 g/kg aBW/d v. time × < 0·8 g/kg aBW/d protein intake; β = –0·020, 95 % CI –0·041, –0·003 sd per year).

Fig. 2. Association between protein intake (g/kg aBW/d) at baseline and grip strength (sex- and cohort-specific z-score) over time by physical activity category. The models are adjusted for sex, age, education, height, smoking, energy and alcohol intake, cognition, multimorbidity and stratified by physical activity (PA) category at baseline (lower PA: n 5583 person-years; medium PA: n 6411 person-years; higher PA: n 6702 person-years). Results are presented as β coefficients and 95 % CI in the x-axis and the terms of interest in the y-axis. g/kg aBW/d, grams of protein per kilogram of adjusted body weight per d; ref, referent.
Discussion
We found no associations in this study between protein intake measured at baseline (expressed as g/kg aBW/d) and grip strength and rate of decline of grip strength over a maximum follow-up of 8·5 years in community-dwelling older adults. Following from this, we also did not find evidence of an interaction between protein intake and PA in this pooled analysis of individual participant data from four longitudinal ageing cohorts.
In previous analyses of one of the individual cohorts of the pooled analysis, NuAge, higher protein intake was not associated with the 3-year change in grip strength or knee extensor strength(Reference Hengeveld, Chevalier and Visser12) nor with rate of decline in grip strength in Newcastle 85+ over 5 years(Reference Granic, Mendonça and Sayer9). However, higher protein intake was associated cross-sectionally with higher knee extensor strength in NuAge (but not grip strength) at the last data collection(Reference Hengeveld, Chevalier and Visser12) and with higher grip strength in Newcastle 85+(Reference Granic, Mendonça and Sayer9). Further, energy-adjusted protein intake was associated with muscle strength score (sex-specific sum of handgrip, elbow flexors and knee extensor strength) in NuAge as well(Reference Farsijani, Payette and Morais47). In Health ABC, no analysis of protein intake and grip strength has been conducted, but higher protein intake was associated with reduced lean mass and appendicular lean mass decline over 3 years(Reference Houston, Nicklas and Ding48,Reference Elstgeest, Schaap and Heymans49) , although, not with the change in mid-thigh muscle cross-sectional area and appendicular lean mass over 5 and 6 years, respectively(Reference Elstgeest, Schaap and Heymans49,Reference Verreijen, Engberink and Houston50) . We did not observe any association between protein intake and grip strength in this pooled individual data from the Health ABC, NuAge, LASA and Newcastle 85+. Prospective observational studies (cohorts not included in our study) on protein intake and grip strength in older adults are inconsistent with most finding a protective effect(Reference McLean, Mangano and Hannan7,Reference Beasley, Wertheim and LaCroix8,Reference Isanejad, Mursu and Sirola10) , while others did not(Reference Kim, Kim and Eun11). There are a few important differences that may explain the different results, namely that Beasley et al. (Reference Beasley, Wertheim and LaCroix8) and Mclean et al. (Reference McLean, Mangano and Hannan7) only recruited women, that Beasley et al. used protein intake adjusted for energy intake with the residual method(Reference Beasley, Wertheim and LaCroix8), that Mclean et al calibrated the FFQ for doubly labelled water and 24-h urinary nitrogen(Reference McLean, Mangano and Hannan7), and that Isanejad et al used 3-d food records(Reference Isanejad, Mursu and Sirola10). Our analysis adjusted for energy intake or used protein intake expressed by % of total energy or by 1 MJ of energy, but it is possible that residual confounding remained.
Previously, we showed that participants (pooled analysis of the same cohorts) with protein intake ≥ 0·8 g/kg aBW/d had slower decline in walking speed and were less likely to report incident mobility limitations, and in a dose-dependent manner(Reference Mendonça, Hengeveld and Visser51). This discrepancy with our previous findings may be because higher protein intake may be more relevant to physical function than to handgrip strength alone. Using a different measure of muscle strength than grip strength, such as knee extensor strength, or a combination of measures reflecting overall muscle strength might have yielded different results. In fact, the muscles are required to perform a grip strength test, but a small proportion of the overall muscle mass and a significant part of the decline in grip strength with ageing appear to relate to neuromuscular activation rather than contractile volume(Reference McGrath, Vincent and Hackney52).
In the fully adjusted models, grip strength declined on average by 0·018 sd per year. Original scores are from different distributions (so caution interpreting the back-transformation is needed), but using the mean (28·9 kg) and sd (10·3 kg) at wave 1, grip strength decline would be equivalent to a decline of 0·19 kg/ year or 0·9 kg (3 %) over 4·9 years. This is slightly lower than younger participants (mean: 66·0 years, sd:9·1) from the English Longitudinal Study of Ageing who lost on average 0·03 sd of grip strength every year which equated to a reduction of 1·6 kg (6 %) in women and 2·3 kg (5 %) in men over 9 years(Reference Dodds, Pakpahan and Granic53). Beasley et al. found that older women from the Women’s Health Initiative lost, on average, 3·8 % of the baseline grip strength over 7 years(Reference Beasley, Wertheim and LaCroix8), and Mclean et al found that older adults in the Framingham Offspring Cohort lost, on average, 1·6 % of the baseline grip strength over almost 6 years(Reference McLean, Mangano and Hannan7). It is possible that a more pronounced decline in grip strength in our study or longer follow-up would have been necessary to observe an association with protein intake. In fact, the minimal clinically important difference for grip strength is somewhere between 5·0 and 6·5 kg which is considerably higher than the mean grip strength decline in our study(Reference Bohannon54).
Future analysis of secondary data should consider strata of grip strength decline and/or extending the follow-up time during study design.
Previously in the Newcastle 85+, three dietary pattens were derived: a high red meat, a low meat (under-represented by meat but participants had the highest consumption of fruits, nuts, whole grains and fish) and a high butter dietary pattern. Very old adults with a high red meat dietary pattern had the highest protein intake (non-adjusted) and highest % of energy from protein of the three dietary patterns(Reference Granic, Sayer and Robinson55). However, those with the high red meat dietary pattern had worse grip strength (but not worse decline) than those with a low meat dietary pattern(Reference Granic, Jagger and Davies56). Although our analyses adjusted for several confounders, namely energy intake, several other dietary factors may affect muscle strength and the cumulative and synergistic effect of the complex mixture of foods may offer an alternative explanation for the null findings in this study.
We did not find a clear indication for effect modification by PA or a synergistic effect of protein and PA. A 2018 systematic review and meta-analysis of randomised controlled trials also failed to find a synergistic effect of protein supplementation and resistance exercise on muscle strength in non-frail community-dwelling older adults(Reference Ten Haaf, Nuijten and Maessen14). Muscle protein synthesis may be further stimulated if protein intake occurs in closer temporal proximity to exercise and especially if it involves resistant training(Reference Bauer, Biolo and Cederholm6). However, in this pooled analysis, we could not determine when protein intake or PA occurred with an acceptable degree of precision and accurately distinguish between exercise types. Furthermore, although PA was transformed into cohort-specific z-scores prior to analyses, it is possible that this transformation was not enough to deal with all residual differences. For example, PA was estimated in NuAge for the previous 7 d, while in LASA this was asked for the previous 14 d. A major strength of this study is that we harmonised data from four large ageing cohorts and performed an individual participant pooled analysis, which allowed us to significantly increase our sample size and test for interactions that we could not test in individual cohorts through stratification by PA level. For example, there were 103 participants in LASA with a protein intake of 0·8–1·0 g/kg aBW/d at baseline, and of those, 31, 32 and 40 had lower, medium and higher PA, respectively. A model that tested the interaction between protein intake and PA in a single cohort like LASA would have resulted in considerably more unprecise estimates than those we report. The use of an objective measure of muscle strength (grip strength), the large range of covariates adjusted for, and the use of joint modelling to account for non-random attrition and study membership are other major strengths of this study. One important, yet common limitation, is that protein intake was measured at baseline only and assumed to be stable or have declined proportionally over time. If that assumption does not hold, non-differential misclassification of protein intake during follow-up might have occurred and may have biased the results towards the null. Misreporting is a common limitation for self-reported methods, especially underreporting in dietary intake. Although protein-rich foods are not usually underreported(Reference Macdiarmid and Blundell57), it is possible that protein intake was misclassified and biased the association with grip strength towards the null. Additionally, although protein intake was categorised as part of the harmonisation process, dietary intake was assessed by FFQ in Health ABC and LASA, and with multiple 24-h recalls in NuAge and Newcastle 85+. These two methods may give slightly different estimates, resulting is misclassification. We also did not distinguish between animal and vegetable protein which may have yielded a different result than total protein. In fact, Mclean et al. found that older adults with higher total or animal protein intake had lower declines in grip strength but failed to see the same for vegetable protein intake(Reference McLean, Mangano and Hannan7). Body composition is a major driver of grip strength and as such, protein was expressed per kg of BW, analyses were adjusted for height, and sensitivity analyses further adjusted for weight or BMI. However, measures such as appendicular lean mass or fat-free mass were not available for all cohorts and may have been important effect modifiers.
Conclusions
We found no convincing evidence in this study that protein intake (measured at baseline and expressed as g/kg aBW/d) was associated with grip strength over time in community-dwelling older adults, or that there was an interaction between protein intake and PA. It is possible that a higher grip strength decline or longer follow-up was needed to observe an association.
Acknowledgements
The authors thank Maria Sudell for developing the JoineRmeta package and promptly responding to their queries. The authors also thank Jolanda Boer and Hanneke Wijnhoven for commenting on the research proposal and Valérie Turcot (NuAge Database and Biobank), Jan Poppelaars (LASA), and Liset Elstgeest (LASA) for preparing the datasets.
Funding for this research is provided by the European Horizon 2020 PROMISS Project ‘PRevention Of Malnutrition In Senior Subjects in the EU’, grant agreement no. 678732. NM has received funding from the European Union’s Horizon 2020 research and innovation programme under the Marie Sklodowska-Curie grant agreement no. 835577. The content reflects the authors’ views only, and the Commission is not responsible for any use that may be made of the information it contains. Health ABC has been supported by the Intramural Research Program of the NIH, National Institute on Aging (NIA) (NIA contracts N01-AG-6-2101, N01-AG-6-2103 and N01-AG-6-2106; NIA grant R01-AG028050; National Institute of Nursing Research grant R01-NR012459). The NuAge study was funded by the Canadian Institutes of Health Research (CIHR; MOP-62842). The NuAge Database and Biobank are supported by the Fonds de recherche du Québec (FRQ; 2020-VICO-279753), the Quebec Network for Research on Aging, a thematic network funded by the Fonds de Recherche du Québec – Santé (FRQS) and by the Merck-Frosst Chair funded by La Fondation de l’Université de Sherbrooke. Nancy Presse is a Junior 1 Research Scholar of the FRQS. The Longitudinal Aging Study Amsterdam is supported by a grant from the Netherlands Ministry of Health Welfare and Sports, Directorate of Long-Term Care. The Newcastle 85+ Study has been funded by a joint grant from the Medical Research Council and Biotechnology and Biological Sciences Research Council (G0500997) and the Dunhill Medical Trust (R124/0509).
N. M., C. J. and M. V. conceptualised the study. N. M. drafted the research proposal, and L. M. H, M. V. and C. J. critically reviewed it. N. M. conducted the study, analysed the data, performed statistical analyses and wrote the paper. N. M. had primary responsibility for the final content. All authors contributed to the interpretation of the findings, read, critically reviewed the paper, commented and approved the final manuscript.
No conflicts of interest declared.
Supplementary material
For supplementary material/s referred to in this article, please visit https://doi.org/10.1017/S0007114522002033


 Open access