


Introduction
The role of snow is often perceived as negative during ice formation because of its low heat conductivity, which reduces bottom growth rates. following recent studies conducted in the antarctic oceans, however, the positive contribution of snow cover to sea-ice growth has become of major interest (e.g. Reference Lange and EickenLange and others, 1990; Reference KoernerLange and Reference Eicken, Lange and DieckmannEicken, 1991; Reference Jeffries, Shaw, Morris, Veazey and KrouseJeffries and others, 1994). the contribution is due to two specific types of sea-ice growth processes: snow-ice (e.g. Reference Lange and EickenLange and others, 1990; Reference Eicken, Lange, Hubberten and WadhamsEicken and others, 1994; Reference Winebrenner, Nelson, Colony and WestWorby and others, 1998) and superimposed-ice growth (Reference Jeffries, Shaw, Morris, Veazey and KrouseJeffries and others, 1994, Reference Jeffries, Worby, Morris and Weeks1997; Reference Jeffries, Worby, Morris and WeeksKawamura and others, 1997; Reference Eicken and JeffriesEicken, 1998; Reference Haas, Thomas and BareissHaas and others, 2001). snow ice is formed from a mixture of surface snow and infiltrating sea water (e.g. Reference Lange and EickenLange and others, 1990). superimposed ice is formed by the refreezing of fresh meltwater that percolates through the surface snow cover onto the ice (Reference Kawamura, Jeffries, Tison and KrouseKoerner, 1970). both growth processes provide upward ice growth, in contrast with ordinary downward congelation growth at the bottom. the processes can be very effective thickening mechanisms because the freezing interface is close to the cooling source. from observation during full two years at the fixed sites in lützow-holm bay near the japanese antarctic syowa station, Reference Jeffries, Worby, Morris and WeeksKawamura and others (1997) suggested that landfast ice in the bay grows upward through the processes and that a transparent superimposed ice layer is added as an annual layer every summer.
We conducted sea-ice sampling in the bay from 1998 to 2003 to verify the results obtained in the previous study. we also carried out sea-ice monitoring using european remote-sensing satellite-2 (ers-2) data. in this paper, we report the physical and isotopic properties of sea-ice samples collected in lützow-holm bay. we also discuss the relation between the properties and backscatter coefficients obtained from ers-2 synthetic aperture radar (sar).
Background: Sampling Sites, Sampling and Analyses of SEA-ICE Cores
figure 1 shows sea-ice sampling sites in lützow-holm bay. recently, landfast sea ice in the bay has broken off frequently (Reference ShibuyaUshio, 2006). the latest break-up event occurred in autumn 1998, when, according to satellite images (Reference Notz, McPhee, Worster, Maykut, Schlün-zen and EickenShibuya, 2001), most fast ice except near the continental shore broke away. new ice grew again and covered the whole bay in winter 1998. afterward the fast ice remained fairly stable in spite of break-off far away from the sampling sites.

Fig. 1. Map of the study area in Lützow-Holm Bay, Antarctica, showing the location of sampling sites. The shaded area is the landfast ice remaining after the break-off event in autumn 1998.
Generally, the bay is characterized by thick snow cover (Reference Jeffries, Worby, Morris and WeeksKawamura and others, 1997). snow depth was low near the shore and increased consistently with distance from the shore. during our present observations, the maximum snow depth was up to 1.35 m as shown below.
We first selected a flat area as a sampling site. we then put up five or six snow stakes at 5 m intervals. we measured snow/ice accretion using a snow/ice gauge and snow depth and collected one sea-ice sample at each sampling site with a 75 mm diameter crrel (us army cold regions research and engineering laboratory)-type coring auger during several years. the sampling points in each year were within 20m of the fixed stake. we measured the thickness of the collected ice and the relative level of the sea water (freeboard) after the coring. table 1 summarizes the snow depth, ice thickness and freeboard height.
Table 1. Summary of snow depth, Z s, ice thickness, Z i, and freeboard height, Z f (unit:m)

The ice samples were deep-frozen and shipped to the institute of low temperature science, sapporo, japan, for analysis. in the cold laboratory, the cores were split lengthwise to obtain vertical thick and thin sections along the entire length of each core. the thick and thin sections were photographed in plain and polarized light, respectively, to obtain the texture and crystal structure. one-half of the split core was cut horizontally into small pieces of about 50mm length according to textural variability. the cut pieces were then melted, and together with snow and sea-water samples the chlorinity was determined by the titration method (toa electronics, sat-210). the chlorinity was converted to salinity by a formula (e.g. Reference BennettBennett, 1976) with an accuracy of 0.1 psu (practical salinity units). the melt samples were also analyzed for 18o/16o ratios (δ18o values) using standard mass spectrometer techniques (finnigan mat delta plus) with an accuracy of 0.05%.
Results and Discussion
Sea-ice properties and growth at sites P2 and P3
figures 2 and 3 show profiles of salinity and δ18o value of cores collected at sites p2 and p3, respectively, in january 2000, 2001 and 2003. all the cores had a typical sea-ice structure, being composed of granular and columnar ice in the upper and lower layers, respectively, whose boundary was clearly recognized (fig. 4). since the boundary between granular and columnar ice remains unaltered, we can assess upward ice growth relative to this horizon (figs 2 and 3). the arrows in the figures show the ice layer newly grown in the upward direction. an extremely large amount of upward growth, as high as 1.0 m, with large variation, was observed (table 2). such upward growth was verified by a method from Reference Jeffries, Worby, Morris and WeeksKawamura and others (1997), using a snow/ice gauge to measure snow/ice accretion during the two sampling periods.

Fig. 2. Profiles of salinity and δ18O value of cores collected at site P2 in January (a) 2000, (b) 2001 and (c) 2003. The horizontal solid line shows the boundary between granular and columnar ice, illustrated at the appropriate depth in each year. The horizontal dashed line indicates the minimum thickness during the previous summer. The shaded area shows a gap layer.

Fig. 3. Same as Figure 2, but for site P3.

Fig. 4. Thin-section photographs of the boundary, shown by the horizontal line, between upper granular and lower columnar ice of the samples collected at P2 in January of (a) 2000, (b) 2001 and (c) 2003.
Table 2. Amounts of sea-ice growth (unit: m)
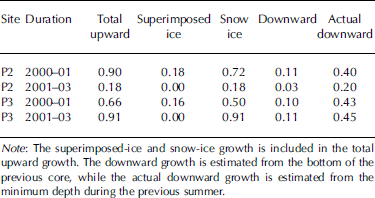
We examine the upper layer that contributes to upward growth. figure 5 shows a photograph of the uppermost layer of the p2 core in 2001. the photo shows that the uppermost part of the core was composed of transparent ice with coarse grains. the profiles of salinity and δ18o value indicate that the transparent ice had low salinity and extremely large negative δ18o values (fig. 2b). the δ18o values of the ice layer were nearly equal to those of the snow cover, i.e. as low as –20%, implying that the layer originated from the snow cover and represents superimposed ice. the top layer of the p3 core in 2001 had similar characteristics (fig. 3b). the above properties are quite similar to superimposed ice as described by Reference Jeffries, Worby, Morris and WeeksKawamura and others (1997). in this study, we regard ice layers with such properties as superimposed ice. the top layers in the 2003 cores were different from those in the 2001 cores. the layer at p2 and p3 had less distinct properties compared with the typical superimposed ice properties in the 2001 cores, which indicates that the top layers were snow ice rather than superimposed ice. according to the above criteria, superimposed ice growth contributed only slightly. it can be concluded that snow ice is the main contributor to upward growth (table 2).

Fig. 5. Thick- and thin-section photographs of the uppermost layer collected at P2 in January 2001 (a) in plain light and (b) between crossed polarizers. The arrow shows the sea-water level after sampling.
As shown in table 2, unlike the large amount of upward growth, only a small amount of downward columnar ice growth, so-called congelation growth, was found, which is caused by the insulating effect of the thick snow cover. the lowermost part of most cores had a thin horizontal layer with small bubbles (e.g. at 0.20 and 0.45m from the bottom in the p2 and p3 cores, respectively, in 2003). the ice properties, especially salinity, changed clearly at the layer (figs 2 and 3). the existence of the bubble layers suggests that bottom ice was melted to that depth in summer, ceased growth for a while and then grew again, leaving the bubble layer. the bubble layer indicates the minimum thickness during the previous summer. the amount of actual downward growth from the layer was considerably larger than that estimated from the bottom of the previous core (table 2).
It should be noted that some salinity and δ18o signatures existing in the 2000 cores, the first samples analyzed, are discernible in the cores taken in 2001 and 2003 (figs 2 and 3). for example, in the p2 core, precise observation shows that the columnar ice in the 2000 cores had an internal maximum in the salinity profile. it seems that a first-year ice layer with the c-shaped salinity profile is sandwiched between about 0.20 and 1.20m depth. then the ice layer grew both upward and downward to result in the 2001 core.
A peak in salinity is found in the 2000 core at about 1.20m depth. profiles of salinity and δ18o values including the peak remain intact in the 2001 cores. the results show that a strong salinity decrease as in arctic multi-year ice was not found, which was pointed out by Reference Eicken, Lange and DieckmannEicken and others (1991) and Reference Eicken and JeffriesEicken (1998) in antarctic ice. only slight desalination of about 0.5 psu in the corresponding columnar ice was observed during these years. likewise in the granular ice except for the top layer, the profiles are very similar in each core. a similar state of sustenance of salinity and δ18o signatures was also observed in the cores collected at p3 (fig. 3).
By contrast, δ18o values in the top layer changed from year to year (figs 2 and 3). for example, the extremely large negative values in the top superimposed ice in the p3 core in 2001 were not found at the corresponding depth in the 2003 core (fig. 3). the structural characteristics of the superimposed ice also disappeared. since the structure does not change in the solid state, the result suggests that the disappearance is due to surface melting or dissolution (Reference Morris, Jeffries, Li and JeffriesNotz and others, 2003). by contrast, in p2 cores (fig. 2) the superimposed ice layer in 2001 changed to a slush layer in 2003, which also implies the contribution of dissolution or melting.
Some sampled cores had a superimposed ice layer and an underlying slush- or water-filled porous layer, or gap at the top (figs 2 and 3). Reference Jeffries, Worby, Morris and WeeksKawamura and others (1997) reported a water layer and a superimposed ice layer at the snow/ice interface in a summer ice core. Reference Kawamura, Ohshima, Takizawa and UshioKawamura and others (2004) also found perched ice blocks in the snow cover at the top of ice cores in the ross sea. Reference Haas, Thomas and BareissHaas and others (2001) reported a similar layered structure in the weddell sea and discussed the processes responsible for its development during summer. they explained that the origin of the gap layers is caused by summer warming and the subsequent increasing brine volume or by the reopening of former, refrozen slush layers.
The overall results above could explain the upward growth process as follows: the slush layer is created initially by upward sea-water percolation through the warm, permeable ice depressed below sea level due to the mass of the snow cover. then the superimposed ice layer is formed, when less dense, fresh meltwater percolating through the snow refreezes at the surface of the cold, denser slush. thereafter the slush layer refreezes to form granular snow ice after autumn as air and snow temperatures decrease. however, the superimposed ice signature was obliterated and not found in the subsequent cores as described above. in other words, the sampled cores did not have buried superimposed ice (Reference Jeffries, Shaw, Morris, Veazey and KrouseJeffries and others, 1994; Reference Jeffries, Worby, Morris and WeeksKawamura and others, 1997, Reference Kawamura, Ohshima, Takizawa and Ushio2004) below the newly upward-grown ice layer. it is likely that the superimposed ice layer is dissolved with the slush layer. the above process removed characteristics of superimposed ice as clearly shown in the p3 core in 2003.
As shown above, the ice properties had some year-to-year and site-to-site differences, especially in the amount of upward growth, and the existence of the superimposed-ice and gap layers. previous observations of superimposed ice suggest that the summer snow and ice cover exist in a delicate state with weather conditions (Reference Kawamura, Ohshima, Takizawa and UshioKawamura and others, 2004). therefore, the differences might be caused by differences in the snow depth, meteorological conditions and sampling period. the dissolution or melting process of the top ice layers as well as the characteristics of the snow cover probably contributed to the difference. Reference Eicken, Lange and DieckmannEicken and others (1991) tested the spatial variability of sea-ice properties in the weddell sea pack ice and described some variability even within 2 and 20m of the sampling points. lateral variability of the cores might contribute to the differences, although the p2 and p3 cores had a simple landfast sea-ice structure as described above. multiple cores need to be sampled to interpret the results collected more definitely.
Sea-ice properties and growth at sites P1 and OW28
figure 6 illustrates profiles of ice types, salinity and δ18o value of the samples at p1 in 2000 and 2001. the 2000 core was not collected completely. both cores had a complex layered structure, i.e. alternating layers of granular ice (thicker at the top), columnar ice and intermediate granular/columnar ice (Reference Eicken and LangeEicken and lange, 1989).

Fig. 6. Profiles of ice types, salinity and δ18O value of the samples at P1 in January of (a) 2000 and (b) 2001. The ice types in each core are identified on the right side of each graph with the abbreviations g (granular ice), c (columnar ice) and g/c (intermediate granular/columnar ice). The shaded area shows a gap layer.
Salinity profiles show a complex variation, with a general trend of slightly higher values in the upper part than in the lower part. in the upper granular ice layer in the 2001 core, the salinity fluctuated greatly. the δ18o profiles tend to have very low values at the top at about 0.20 m depth, increasing to higher values just below in both cores. judging from the low δ18o values between snow and sea water, the upper granular ice in the 2000 core and ice layers above slush in the 2001 core consisted of snow ice. in contrast, the higher δ18o values, close to sea water of about 0%, suggest that most granular ice, except for the snow-ice layers, originated from sea water, i.e. frazil ice.
Measurement of the snow/ice gauge in both years indicated upward growth of up to 1.30 m during the period. the ice-core length and ice texture require that a corresponding amount or more melted at the ice bottom, because ice thickness remained the same, which is an unreasonably large amount of melt. additionally, if the ice grows upward, frazil granular ice should contribute to the growth. it is difficult to believe that frazil ice grows on the existing sea ice. furthermore, there is no correspondence in the core texture in 2000 and 2001 (fig. 6). these results would suggest that the differences of thickness and properties between ice in 2000 and 2001 are caused by differences between sampling points, despite their close proximity. possibly our core sampled old ice adjacent to the new ice that had formed after the break-out event of 1998.
figure 7 shows profiles of ice types, salinity and δ18o value of the samples at site ow28 in november of 1998 and 2000. the structure and properties of 1998 ice show characteristics of typical first-year ice (fig. 7a), in agreement with the fact that the ice grew after the break-up event in autumn 1998. the 2000 ice had an interesting structure: the lower thin granular ice was sandwiched by thick columnar ice (fig. 7b). the salinity shows three pairs of the c-shaped profile except for the top 0.15 m layer. the δ18o values were low in the top granular ice layer and remained constant at slightly above 0% in the lower layer.

Fig. 7. Profiles of ice types, salinity and δ18O value of the samples at OW28 in November of (a) 1998 and (b) 2000. The ice types in each core are identified on the right side of each graph with the abbreviations g (granular ice) and c (columnar ice).
Snow-/ice-gauge measurement and comparison of the two profiles suggest that the 1998 core grew in both upward and downward directions to result in the 2000 texture. upward growth resulted in granular snow ice at the top. in contrast, downward growth created not only columnar ice but also granular ice. judging from the δ18o values of about 0%, the granular ice sandwiched by columnar ice was frazil ice. Reference UshioWeeks and ackley (1986) proposed four possible mechanisms for frazil ice generation: (1) wind- and wave-induced turbulence, (2) water which is at a depressed freezing point due to pressure at depth, (3) contact between two water masses of significantly different salinity but both at their freezing point, and (4) thermohaline convection initiated by surface cooling and freezing. however, none of these mechanisms seems to offer a good explanation of the frazil ice formation in this case. therefore, the reason why the frazil ice grew onto the columnar ice remains unknown.
Radar backscatter characteristics of sea ice
We measured backscatter coefficients at p2 and p3 from january 2002 to february 2003 using ers-2 data. the ers-2 (c-band sar) data were directly received and processed at syowa station. c-band backscatter coefficients extracted from sar data were radiometrically calibrated using a man-made target whose radar cross-section was known. we deployed two corner reflectors at syowa station and in the skallen area. a radiometric calibration coefficient was derived based on the integration method proposed by Reference Gray, Vachon, Livingstone and LukowskiGray and others (1990). the radiometric accuracy was 1.2 db during the period. therefore, we applied geometric correction with several ground-control points. sar data were processed in four multi-looks and transformed into universal transverse mercator (utm) coordinates with 12.5 m of pixel spacing. in order to extract the backscatter coefficients of the sampling sites, eight by eight pixels (100m×100 m) centered at p2 and p3 were averaged.
figure 8 shows the significant seasonal variations in the backscatter coefficient at p2 and p3 from january 2002 to february 2003. the backscatter coefficient had a maximum value in february 2002, then decreased gradually and approached the minimum value in january 2003. in the next month, the backscatter rose abruptly to a value similar to that of the previous year. Reference HaasHaas (2001) observed time series of backscatter coefficients acquired by the ers-1/-2 c-band scatterometer for perennial sea-ice regions in the west antarctic from june 1991 to june 1999. his data showed a similar pronounced seasonal cycle in spite of different conditions (e.g. large spatial resolutions of 25 km). he explained that the spring backscatter rise is associated with internal snowmelt and the formation of superimposed ice and that gradual surface flooding with sea water becomes the dominant process, causing the decreasing backscatter in the autumn.

Fig. 8. Variation of the backscatter coefficients observed at P2 and P3 from January 2002 to February 2003.
In our observations, the coefficients had similar minimum values at p2 and p3 at the sampling time in january 2003 (day 378 in fig. 8). however, at these sites at that time, snow depth, ice thickness, freeboard (cf. table 1) and the surface ice conditions, as described above, were quite different. nevertheless the remarkable differences do not affect the coefficient. the result suggests that it is mostly the snow properties that influence the coefficient and mask the different conditions of the underlying layers.
Mean daily net radiation at syowa station attained a maximum value of 3.68 mjm–2 in the middle 10 days of january in 2003 and decreased quickly to 1.40 mjm–2 in the middle 10 days of february (jma, 2005). consequently, the mean air temperature at the station was also near the maximum of 0.3˚c in the middle 10 days of january (the actual maximum of 0.4˚c in the last 10 days of this month) and decreased to –1.1˚c in the middle 10 days of february. the data show that snowmelting and therefore wetness in the snow layer was probably at a peak during the sampling time. it is most likely that the minimum backscatter value on day 378 was caused by increase of the liquid water in the snow cover (Reference Weeks, Ackley and UntersteinerWinebrenner and others, 1994; Reference Barber, Papakyriakou, LeDrew and ShokrBarber and others, 1995). from their observation on arctic first-year ice, Reference Barber, Papakyriakou, LeDrew and ShokrBarber and others (1995) obtained a similar inverse relationship between net radiation and scattering cross-section in short periods during summer. our data show that when the net radiation attains a peak, the backscatter coefficient has the minimum value.
The subsequent sudden backscatter increase was probably due to scattering from rough surfaces caused by snow metamorphism during refreezing of liquid water (e.g. ice lenses; Reference Lange, Schlosser, Ackley, Wadhams and DieckmannMorris and others, 1998), and by superimposed ice formation (Reference HaasHaas, 2001). the gradual decrease during winter may be related to flooding and refreezing of the surface layer that reduces surface roughness of the snow/ice interface and obliterates superimposed ice signatures.
Conclusions
The crystal texture, δ18o values and salinity of ice cores in summer in lützow-holm bay are described. the most notable result obtained is an extremely large amount of upward growth as high as 1.0 m, which has not been reported previously. this growth is mostly due to snow ice and to a lesser extent to superimposed ice. deep snow cover in the bay contributes to such large upward growth. in contrast, only a small amount of downward growth was observed. the salinity profiles remain unchanged in the ice core, although the ice survives the summer melt season. the result suggests that only weak desalination occurred in this region, which could not change the profile. some sampled cores had slush-or water-filled porous layers, or gaps underneath surface superimposed ice layers. the slush and superimposed ice layers are created by a combination of upward sea-water percolation and downward meltwater percolation. no buried superimposed ice and corresponding annual layers were observed below the newly grown ice layer, which is attributed to a dissolution or melting process. the backscatter obtained with ers-2 sar showed remarkable annual variation. it is likely that the minimum backscatter value in midsummer is caused by increase of the liquid water in the snow cover. the sudden backscatter increase in late summer is probably due to scattering from rough surfaces caused by snow metamorphism during refreezing of liquid water and by superimposed ice formation.
The results, especially for the upward growth processes in connection with radar backscattering signatures, could not be described unambiguously and are not entirely clear since we have only summer ice properties and simple measurements on snow cover. furthermore, exact and detailed mechanisms of the processes remain unresolved. further study is required to investigate the properties of the snow and gap layers as well as the ice layer through the year.
Acknowledgements
We are indebted to s. uto and g. hashida for assistance with ice sampling and to the 41st, 42nd, 43rd and 44th members of the japanese antarctic research expedition for field support. we also thank h. eicken for critical reading of the manuscript. useful comments by anonymous reviewers are also acknowledged. this work was partly supported by a grant-in-aid for scientific research (13490002) from the japanese ministry of education, culture, sports, science and technology to t.k.


