


The quality of the long back vowels goose and goat has been changing in many dialects of English. The fronting of goose has been found in most varieties across the English-speaking world—in North America (e.g., Ash, Reference Ash, Arnold, Blake, Davidson, Schwenter and Solomon1996; Baranowski, Reference Baranowski2008; Fridland, Reference Fridland2008; Hall-Lew, Reference Hall-Lew2011; Labov, Reference Labov2001; Labov, Ash, & Boberg, Reference Labov, Ash and Boberg2006), South Africa (Mesthrie, Reference Mesthrie2010), Australia (Cox, Reference Cox1999), in the south of England (Bauer, Reference Bauer1985; Henton, Reference Henton1983; Wells, Reference Wells1982), and in Northern England (e.g., Haddican, Foulkes, Hughes, & Richards, Reference Haddican, Foulkes, Hughes and Richards2013; Hughes, Haddican, Richards, & Foulkes, Reference Hughes, Haddican, Richards and Foulkes2011; Hughes, Haddican, & Foulkes, Reference Hughes, Haddican and Foulkes2012; Jansen, Reference Jansen, Calamai, Celata and Ciucci2012). The fronting of goat is not as widespread, but it has been found in a number of dialects, for example, in the South, the Midland, and to a lesser extent in the West of the United States (Baranowski, Reference Baranowski2008; Fridland & Bartlett, Reference Fridland and Bartlett2006; Hall-Lew, Reference Hall-Lew2009; Labov et al., Reference Labov, Ash and Boberg2006); it is found in the south of England (Kerswill, Torgersen, & Fox, Reference Kerswill and Fox2008; Wells, Reference Wells1982; Williams & Kerswill, Reference Williams, Kerswill, Foulkes and Docherty1999) and has recently been reported in some Northern dialects, for example, in York and in Manchester (Haddican et al., Reference Haddican, Foulkes, Hughes and Richards2013; Hughes et al., Reference Hughes, Haddican, Richards and Foulkes2011, Reference Hughes, Haddican and Foulkes2012).
One unresolved question concerns the relationship between the fronting of goose and the fronting of goat. Labov (Reference Labov and Eckert1991, Reference Labov1994) proposed a structural connection whereby the two changes are coordinated in a parallel shift, with the fronting of goose always preceding the fronting of goat. One well-known counterexample is a conservative variety of Received Pronunciation, where goat is fronted and goose is firmly at the back of the vowel space (Wells, Reference Wells1982). Similarly, goat fronting without goose fronting has been reported in Newcastle (Watt, Reference Watt2000) and Bradford (Watt & Tillotson, Reference Watt and Tillotson2001). Nonetheless, the vast majority of English dialects showing fronting of the long back vowels do follow this pattern: goose fronting occurs in most dialects but goat fronting only in some, and if both occur, goat fronting tends to follow goose fronting. One goal of this paper is to explore the social patterning of these two changes in the same dialect of English, Manchester, UK, with a view to elucidating the connection, if any, between them. If they are indeed coordinated shifts or if they are due to the same underlying force, then one might expect the same social groups within the community to be involved in both shifts, and those groups leading one might be expected to be leading the other as well.
Another goal is to shed light on the mechanism through which these fronting changes propagate throughout the community, by comparing the role of social class construed in terms of the distance between different social groups in the community, that is, a mechanical factor, with the role played by attitudes toward the community. Recent work on mathematical modelling of language change by Kauhanen (Reference Kauhanen2017; cf. Blythe & Croft, Reference Blythe and Croft2012) has shown that the propagation of language change can be modelled successfully just on the basis of the frequency of contact between speakers, without additional social biases, such as attitudinal factors. At the same time, a recent study of the goose and goat in York, UK (Haddican et al., Reference Haddican, Foulkes, Hughes and Richards2013) has found that attitudes toward the community have a significant effect on the realization of the two back vowels. The goal of this paper then is to explore the effect of social factors such as socioeconomic status, gender, ethnicity, and age on the realization of goose and goat in Manchester on the basis of a large sample and to compare the role of social class with the effect of attitudes toward the community.
METHODS
For the purpose of this study, Manchester is defined as the area within the M60 ring road, including the neighborhoods of Sale, Wythenshawe, and Stockport just south of the M60, as they form part of the same uninterrupted urbanized area. It does not include the urban conurbation of Greater Manchester with satellite towns such as Rochdale, Oldham, or Bolton, whose linguistic systems are different from Manchester itself (Baranowski & Turton, Reference Baranowski, Turton and Hickey2015).
This paper is based on the acoustic analysis of the speech of 122 informants, stratified by age, gender, social class, and ethnicity. Of those informants, 96 speakers identify themselves as White British; the other 26 represent the two largest ethnic minoritiesFootnote 1 in Manchester— Pakistani (15 speakers) and Black Caribbean (11 speakers). The informants all grew up in Manchester and, in the case of the White speakers (with the exception of the upper-middle class), at least one of their parents is native to the Manchester area as well.
Socioeconomic status is operationalized in terms of five occupational levels, from lower working as the lowest level, to upper working, lower middle, middle middle, and upper middle at the highest end of the scale. The assignment of informants to either the working or the middle classes reflects the traditional division into blue-collar workers and white-collar labor. Unskilled working-class informants are assigned to lower working class, whereas skilled workers, such as plumbers and electricians, represent the upper working class. Occupations such as administrative assistants, secretaries, and small business owners are assigned to the lower middle class; middle middle class includes occupations such as teachers, managers, and higher level administrators; the upper middle class includes accountants, company directors, university professors. Speakers are assigned to a particular occupational level on the basis of their entire occupational history, not just the most recent occupation, and, in the case of children and teenagers, on the basis of their parents' socioeconomic status.
Sociolinguistic interviews were centered around the topic of growing up in Manchester, with a focus on eliciting narratives of personal experience (Labov, Reference Labov, Baugh and Sherzer1984); spontaneous speech was supplemented with word list reading and minimal pair tests for a number of vocalic and consonantal contrasts (see Baranowski, Reference Baranowski2015). In addition, a questionnaire on attitudes and links to Manchester was conducted for 63 of the speakers. The interviews were recorded on Sony PCM-M10 recorders with Audio-Technica ATR3350 lavaliere microphones, at a sampling rate of 44.1 kHz at 24 bits.
The interviews with the White and the Pakistani speakers were conducted by University of Manchester students local to the area. Six of the Pakistani speakers were interviewed by Pakistani interviewers; the other nine were interviewed by a White Mancunian interviewer with a network of close Pakistani friends, who all grew up in predominantly Pakistani neighborhoods. The Black Caribbean informants were all interviewed by a Black Caribbean interviewer from Manchester. In addition, two interviews conducted by William Labov in Manchester in 1971 with speakers growing up at the beginning of the 20th century are added to the sample to provide real-time data points.
The informants' entire vowel systems, that is, F1 and F2 for all vowel phonemes in different consonantal environments, were measured in Praat (Boersma & Weenink, Reference Boersma and Weenink2014). For 25 speakers the point of measurement was selected individually for each token, following Labov et al. (Reference Labov, Ash and Boberg2006; see also Baranowski, Reference Baranowski, Bayley, Cameron and Lucas2013c) for the nucleus and the glide target. The speech of 75 speakers was measured automatically using the online version of the Forced Alignment and Vowel Extraction suite developed at the University of Pennsylvania (Rosenfelder, Fruehwald, Evanini, & Jiahong, Reference Rosenfelder, Fruehwald, Evanini and Jiahong2011), using the default measurement point selection option (faav) in the FAVE online interface, with the mahalanobis option selected for the formant prediction method (see Rosenfelder et al., Reference Rosenfelder, Fruehwald, Evanini and Jiahong2011); the 80% time point was selected for the analyses of glide targets. The formant measurements were normalized using Lobonov's (Reference Lobonov1971) method and scaled back to Hertz values. The normalized vowel plots presented below were produced in Plotnik 10.3 (Labov, Reference Labov2016).
The statistical analyses reported herein are based on 8465 tokens of goose, as in two, food, school and 8456 tokens of goat in checked position, as in goat, soap, coke, goal. The formant measurements are subjected to a series of mixed-effects linear regression analyses (in Rbrul [Johnson, Reference Johnson2009] and in R [R Core Development Team, 2014], using the lme4 package [Bates, Maechler, Bolker, & Walker, Reference Bates, Maechler, Bolker and Walker2015]), with the following independent variables: age, gender, social class, ethnicity, attitudes toward Manchester, phonological environment, and style; speaker and word are entered as random effects.
RESULTS
Fronting of goose
The long back goose vowel has been involved in a process of fronting in Manchester, similar to that found in many other dialect areas of the English-speaking world. Figures 1 and 2 present the position of the nuclei of the vowel in phonetic space for two speakers interviewed in Manchester by William Labov in 1971. The older of them, Lilly R., born in 1907, representing the state of the dialect at the beginning of the 20th century, shows little fronting, with most tokens back of the F2 center line (Figure 1).Footnote 2 Tokens with coronal onsets, referred to here as /Tuw/, as in two, do, show moderate fronting, with the mean in the center of the vowel space on the F2 dimension. This suggests that the fronting of the vowel first started in this environment, likely as an effect of coarticulation with a preceding coronal consonant (Hall-Lew, Reference Hall-Lew2011; Harrington, Kleber, & Reubold, Reference Harrington, Kleber and Reubold2008; Ohala, Reference Ohala, Masek, Hendrick and Miller1981). This differentiation between coronal and noncoronal onsets is also seen in the speech of Jim R., born in 1922, with noncoronal tokens (/Kuw/, as in goose, boot, food) showing less fronting than /Tuw/ (Figure 2). An initial regression analysis of the data reveals that indeed the place of articulation of the preceding consonant, that is, coronal versus noncoronal, shows a significant interaction with age (p < .0001); similarly, goose before /l/, as in school, forms a separate category. Therefore, following previous studies, the vowel in these three environments will be analyzed separately.
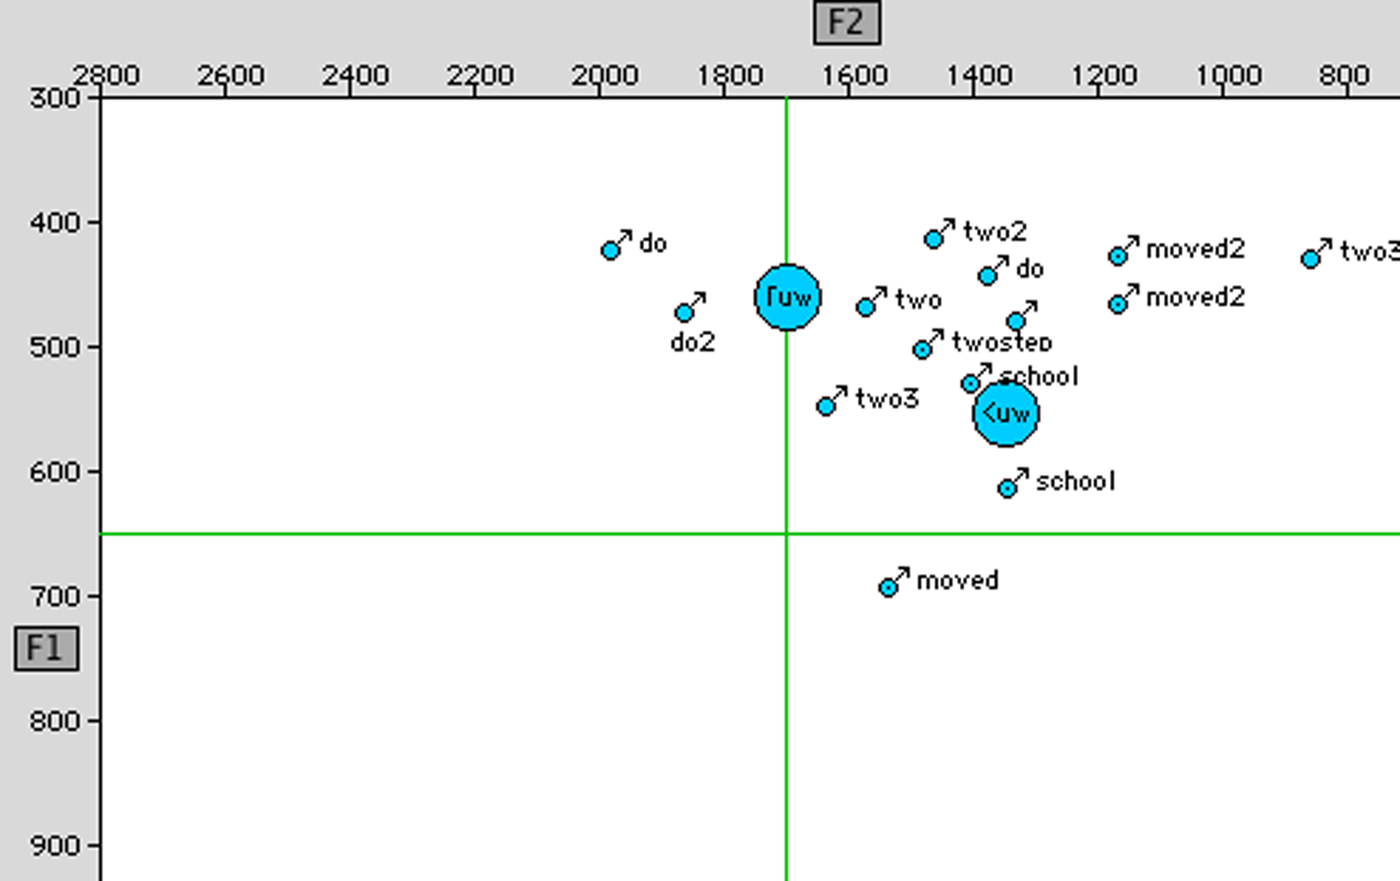
Figure 1. Lilly R., b. 1907 (interviewed in 1971), working class: /Tuw/ (two, do), /Kuw/ (goose, boot).
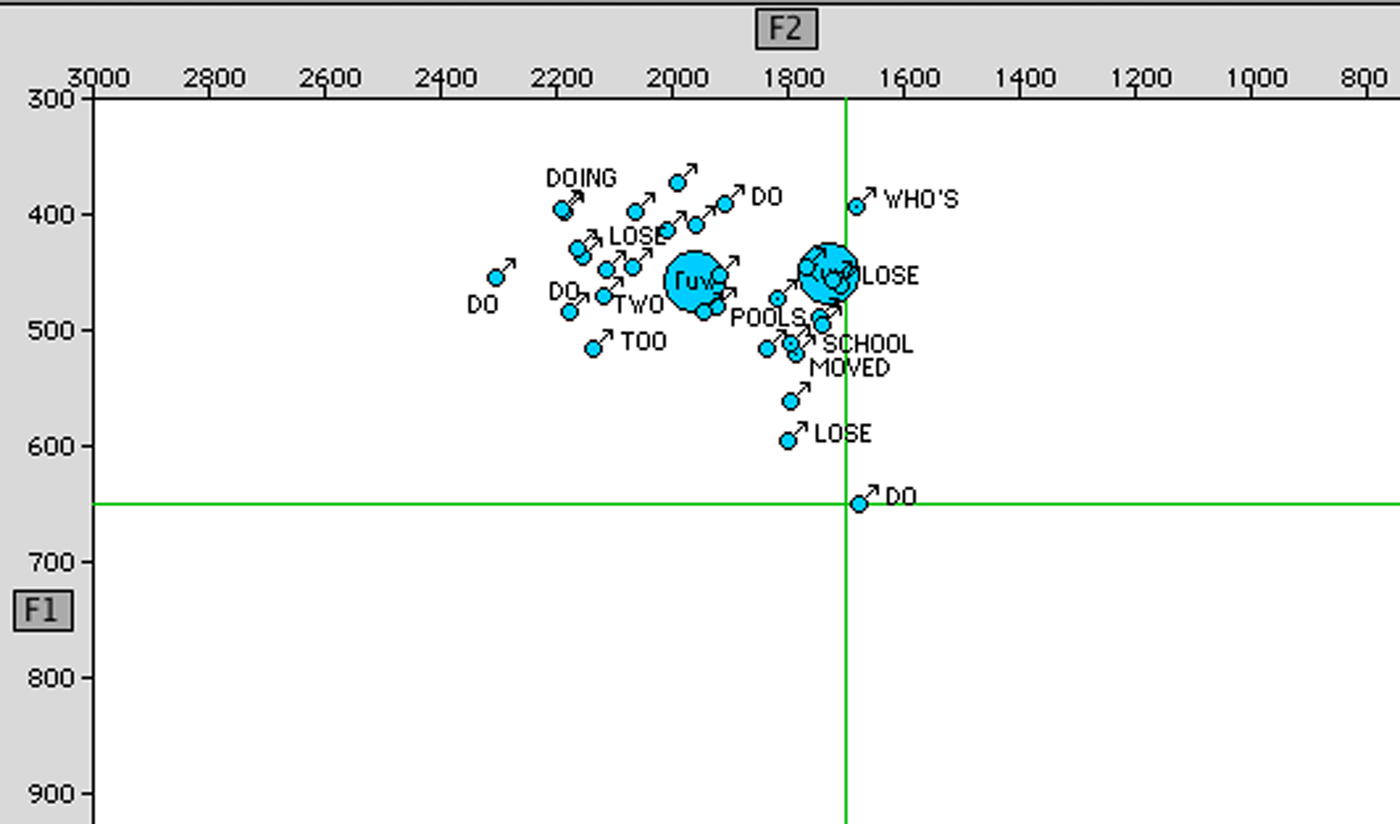
Figure 2. Jim R., 49, b. 1922 (interviewed in 1971), working class: /Tuw/ (two, do), /Kuw/ (goose, boot).
Figure 3 plots the position of the goose vowel for Frances E., born in 1937, one of the oldest speakers in the current sample. /Tuw/, as in do and two, shows considerable fronting, with a mean F2 of 2026 Hz, indicating that by the mid-20th century, the goose vowel with coronal onsets had moved to the front region of the vowel space. At the same time, /Kuw/, as in goose and boot, while fronter than for Lilly R., born in 1907 (Figure 1), is still back of the center line, with a mean of 1612 Hz (Figure 3).
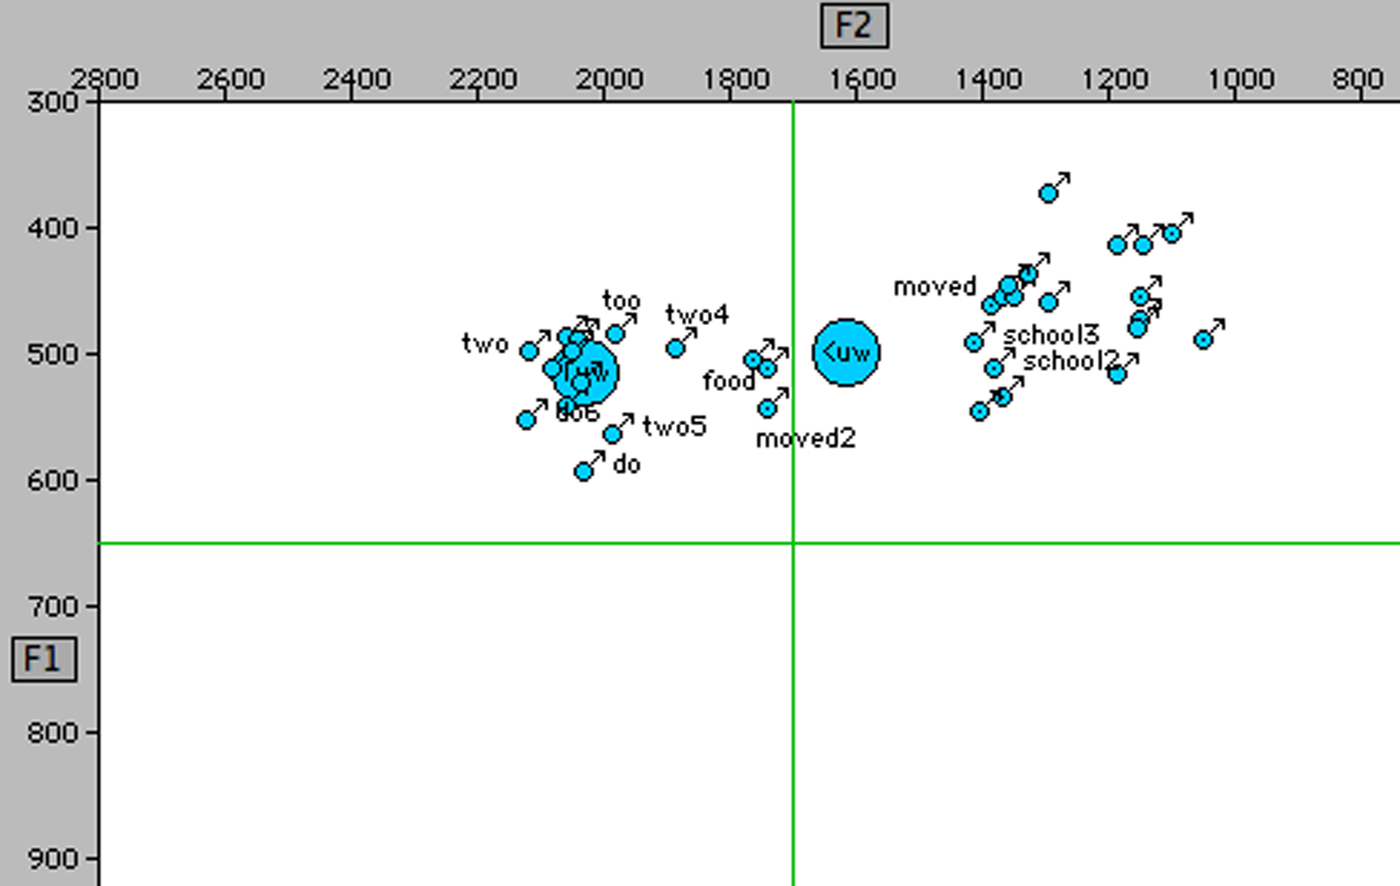
Figure 3. Frances E., 70, b. 1937, upper working class: /Tuw/ (two, do), /Kuw/ (goose, boot).
For Mancunians over the age of 40, there is a difference between tokens with coronal onsets, /Tuw/, as in two, do, and ones with noncoronal onsets, /Kuw/, as in goose, boot, food, in that the fronting of /Tuw/ is more advanced, in other words, this change must have started earlier in this environment and was then followed by the fronting of /Kuw/ (Figure 4). This mirrors the situation found in most dialects of English, where the fronting of goose after noncoronals, as in goose and boot, is usually less advanced. What is striking about Manchester, however, is that for the youngest generation, there is no longer a difference between the two phonological environments—both kinds of tokens are equally fronted, occupying high front position with an average expected F2 of around 2200 Hz, as in the speech of Keith T., 21, and Paul M., 22, in Figures 5 and 6.
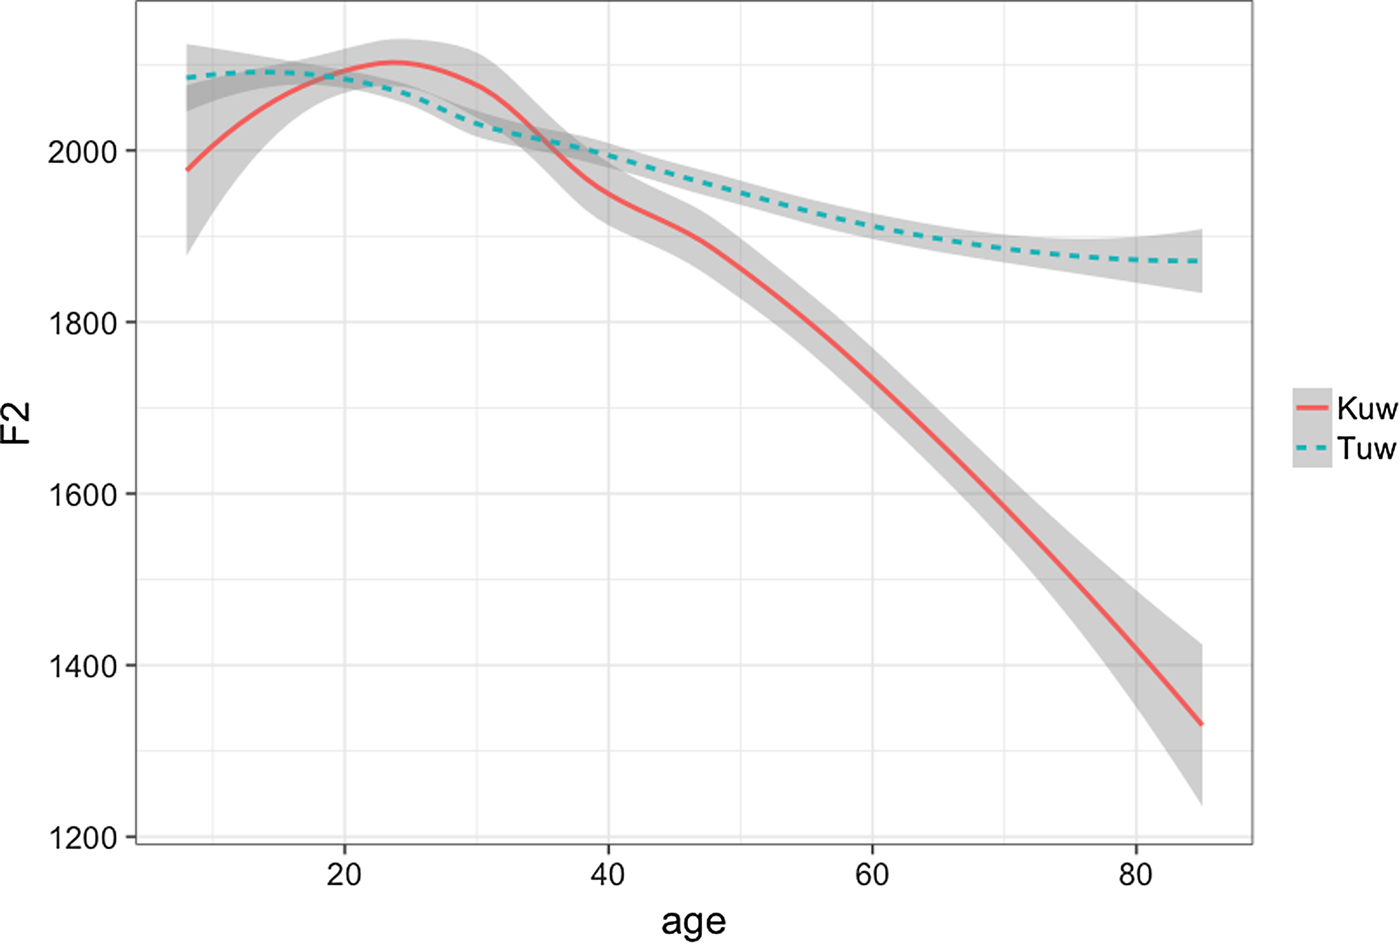
Figure 4. F2 of the nuclei of/Tuw/ (two, do) and /Kuw/ (goose, boot) by age.
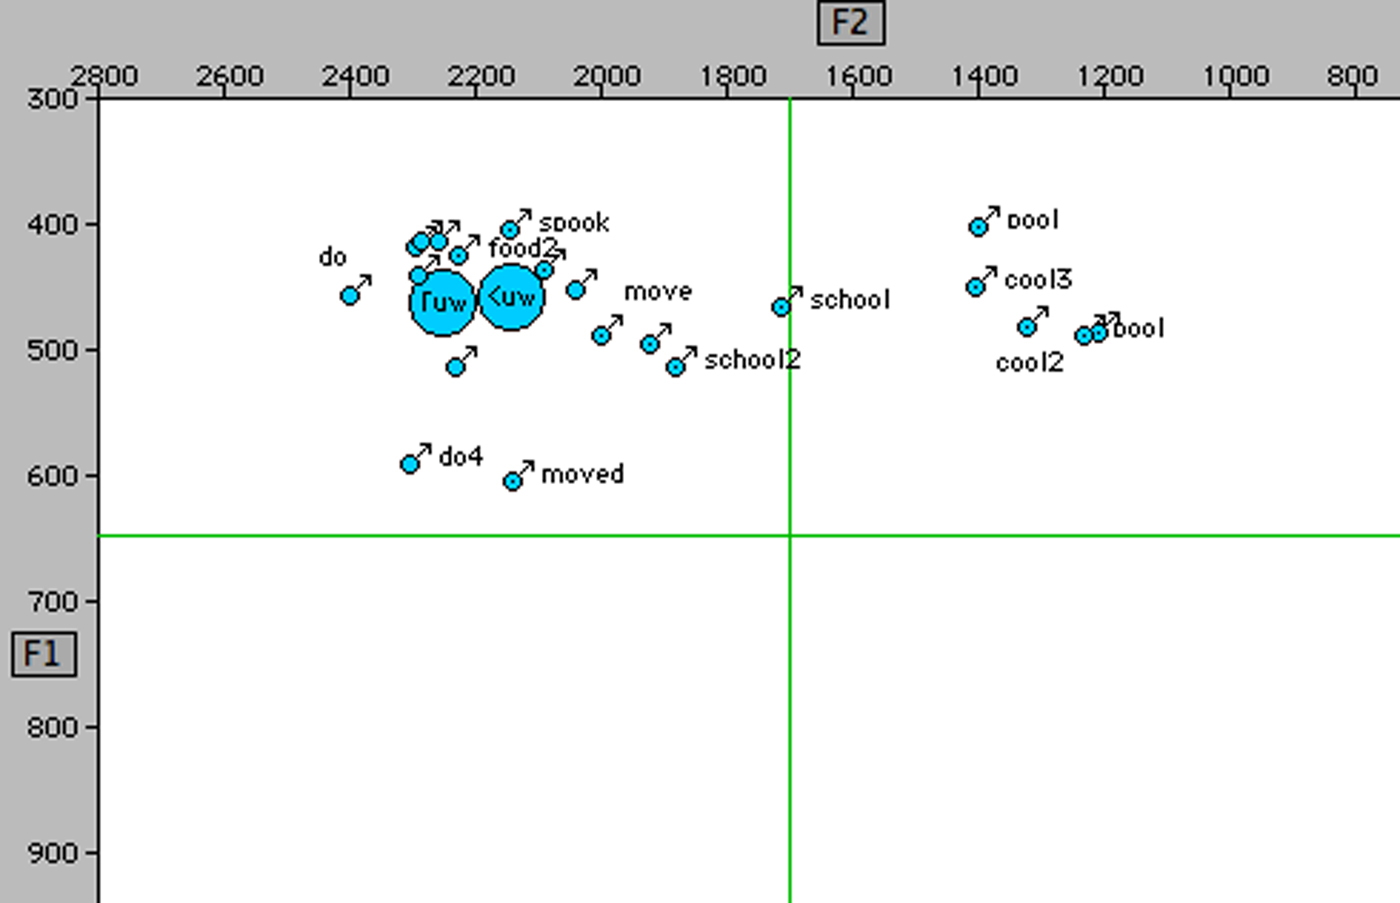
Figure 5. Keith T., 21, lower working class: /Tuw/ (two, do), /Kuw/ (goose, boot).
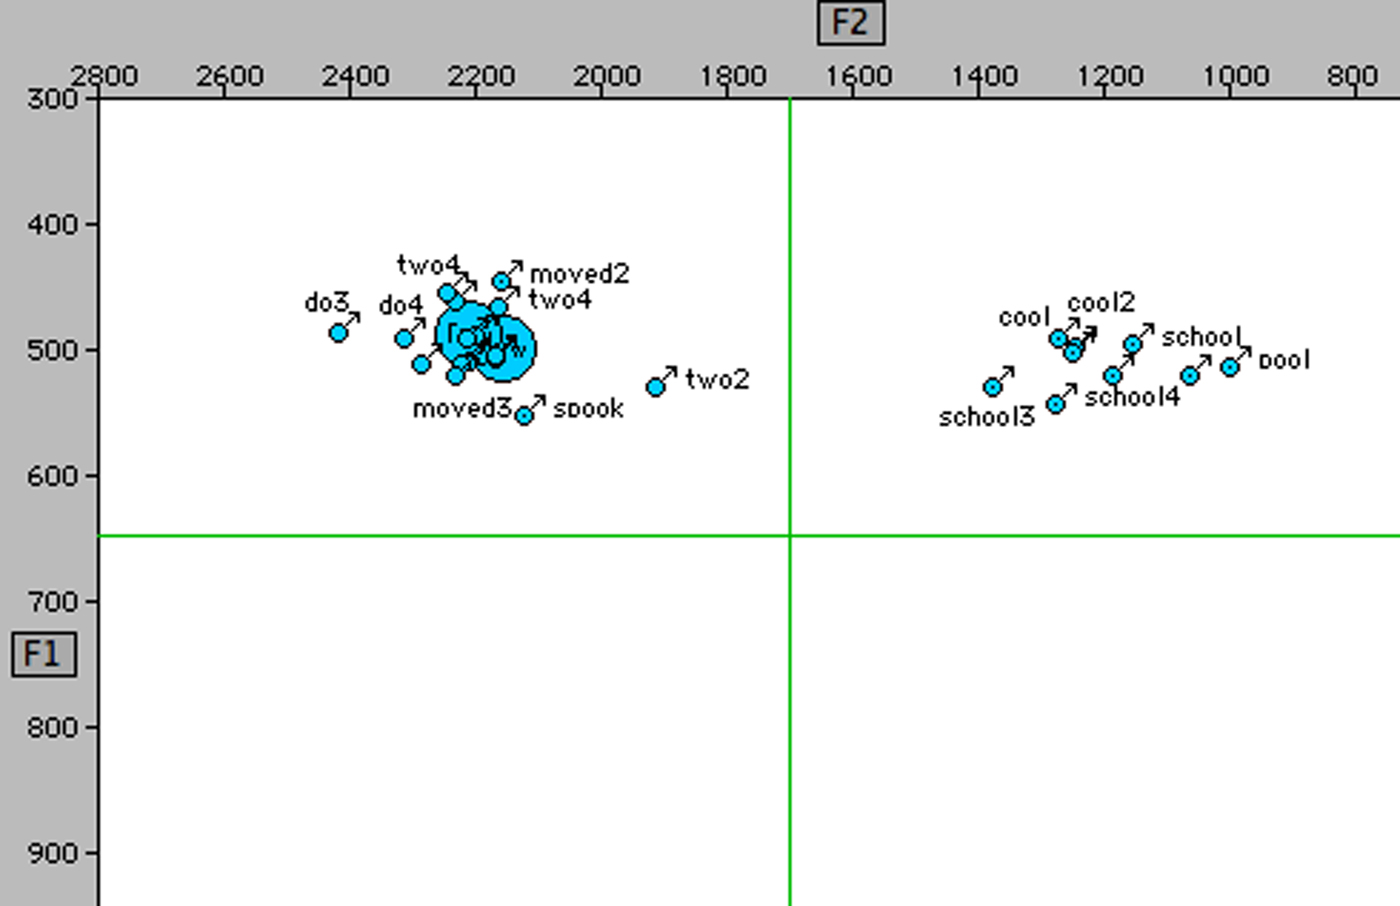
Figure 6. Paul M., 22, upper middle class: /Tuw/ (two, do), /Kuw/ (goose, boot).
At the same time, Figure 4 also reveals what is referred to as the “adolescent peak,” resulting from the conservative behavior of children, who increment the change only when they enter adolescence (Bermúdez-Otero, Reference Bermúdez-Otero2017; Labov, Reference Labov2001:453; Tagliamonte & D'Arcy, Reference Tagliamonte and D'Arcy2009). It is worth noting that the peak is sharper for the more recent and more vigorous of the changes, that is, the fronting of /Kuw/. This is exactly what Labov's (Reference Labov2001:453) model of logistic incrementation predicts. If child conservatism is caused by the fact that children's speech reflects that of their adult caregivers, then the difference between children and adolescents will be smaller when the difference between adolescents and adults is itself smaller, in other words, when the change is close to floor or close to ceiling.
Table 1 Footnote 3 presents the regression analysis of the F2 of /Kuw/, as in goose and food, the more vigorous of the changes, as indicated by Figure 4. It shows that in addition to the internal factor of preceding sound, age and ethnicity are the only social factors playing a role in this change in Manchester. Interestingly, there are no significant effects of gender or social class. In terms of apparent time differences, it turns out to be a rather vigorous change, as indicated by the value of the age coefficient: −10.67 Hz for each additional year means that with each generation 25 years younger, F2 is expected to be higher by 267 Hz (25 × 10.67 Hz).
Table 1. Mixed-effects regression analysis of F2 of /Kuw/ (goose, boot)
n = 1547 Intercept: 2325.02
Deviance: 21,793.15 Grand mean: 1963.36
AIC: 21,672.15 R 2 = .58
df: 23
There is an effect of ethnicity, but it is rather small. Although for Pakistani speakers goose is not quite as fronted as in the rest of the community, they nevertheless show advanced fronting, with an expected F2 in the 2000 Hz region, that is, phonetically quite front. Furthermore, it is worth noting that there is no significant difference between Black Caribbean and White speakers, with both groups showing equally advanced fronting of the vowel.
A comparison of the age coefficients confirms that the fronting of /Kuw/, as in goose, boot (Table 1), is a much more vigorous change than the fronting of /Tuw/, as in do, two (Table 2). This is in line with the age patterns presented in Figure 4: the fronting of /Tuw/ is an older, more advanced, change with the oldest generation of speakers already having relatively high F2 values. Nevertheless, this is still an active change, with a significant age coefficient of -4.166, indicating that for each generation younger by 25 years, the expected F2 increases by around 104 Hz.
Table 2. Mixed-effects regression of F2 of /Tuw/ (two, do)
n = 4597 Intercept: 2118.65
Deviance: 62,492.14 Grand mean: 2013.23
AIC: 62,432.86 R 2 = .37
df: 17
There is a small effect of style for /Tuw/ (and none for /Kuw/), but it disappears in a regression model run for only the 96 White speakers. The lack of any social conditioning beyond age in the fronting of goose is consistent with a scenario in which this is an advanced change nearing completion, one with no apparent social affect, involving different social groups in the speech community (as well as different phonological environments) at similar rates by this stage. It is worth noting, for example, that Keith T. in Figure 5 is a lower-working-class speaker whose /Kuw/ (goose, food, move) is as front as that of the upper-middle-class Mancunians of his generation, such as Paul M. in Figure 6. A similar indication of completion was reported by Hall-Lew (Reference Hall-Lew2011) for the fronting of /Tuw/ in California English, where no significant effects of gender or ethnicity were found.Footnote 4
The fronting of the nucleus of goose is accompanied by the fronting of its glide. Figures 7 and 8 illustrate the change by presenting the glide targets for two speakers: 70-year-old Frances E., one of the oldest speakers in the sample, and 22-year-old Paul M., representing the youngest generation. The change in the position of the glide target in apparent time for the whole sample is shown in Figure 9; again, there is a significant interaction between age and the place of articulation for the preceding consonant (p = .0139).
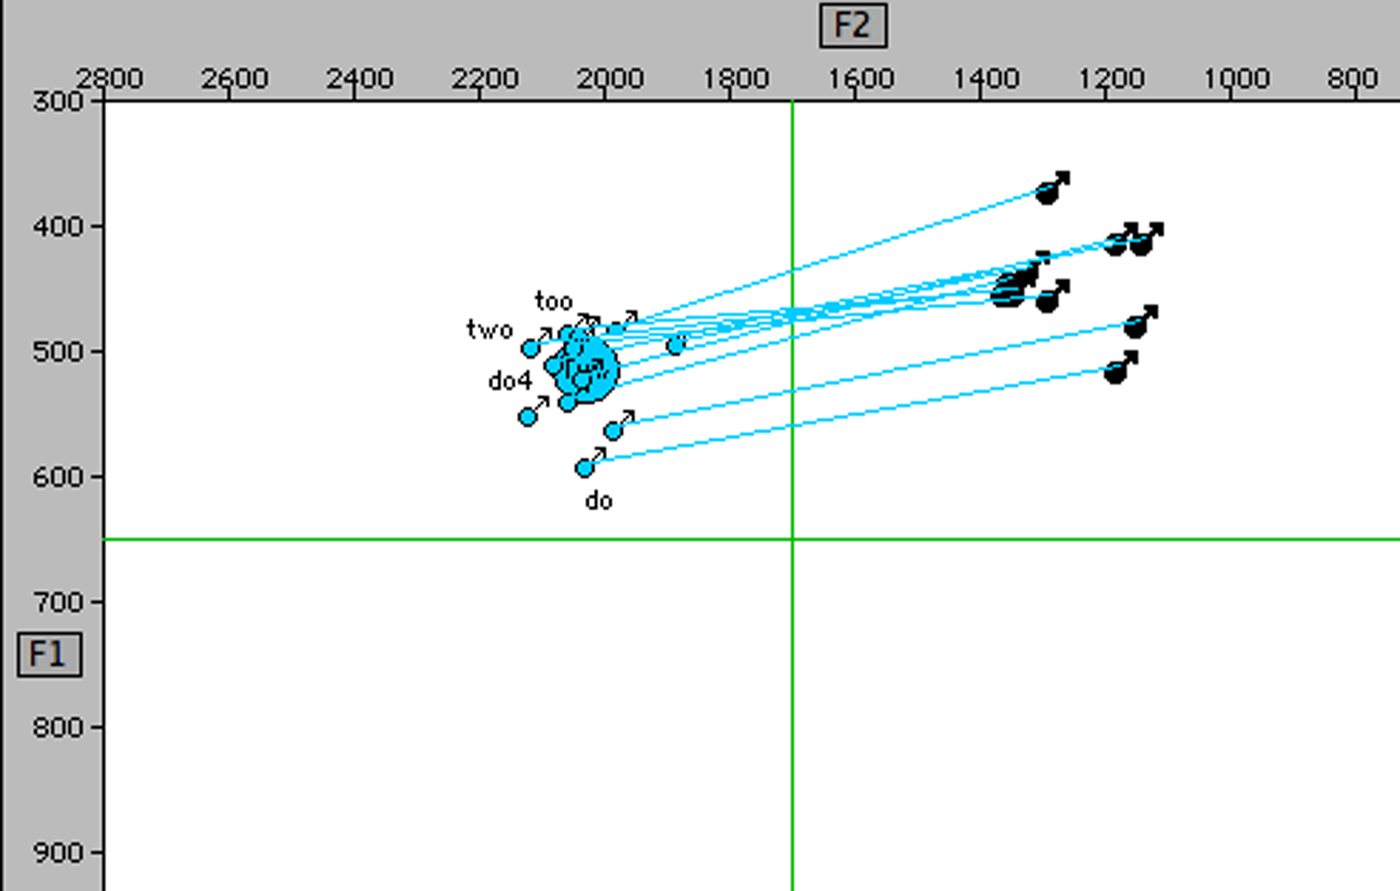
Figure 7. Frances E., 70, upper working class: glide target of /Tuw/ (do, two).
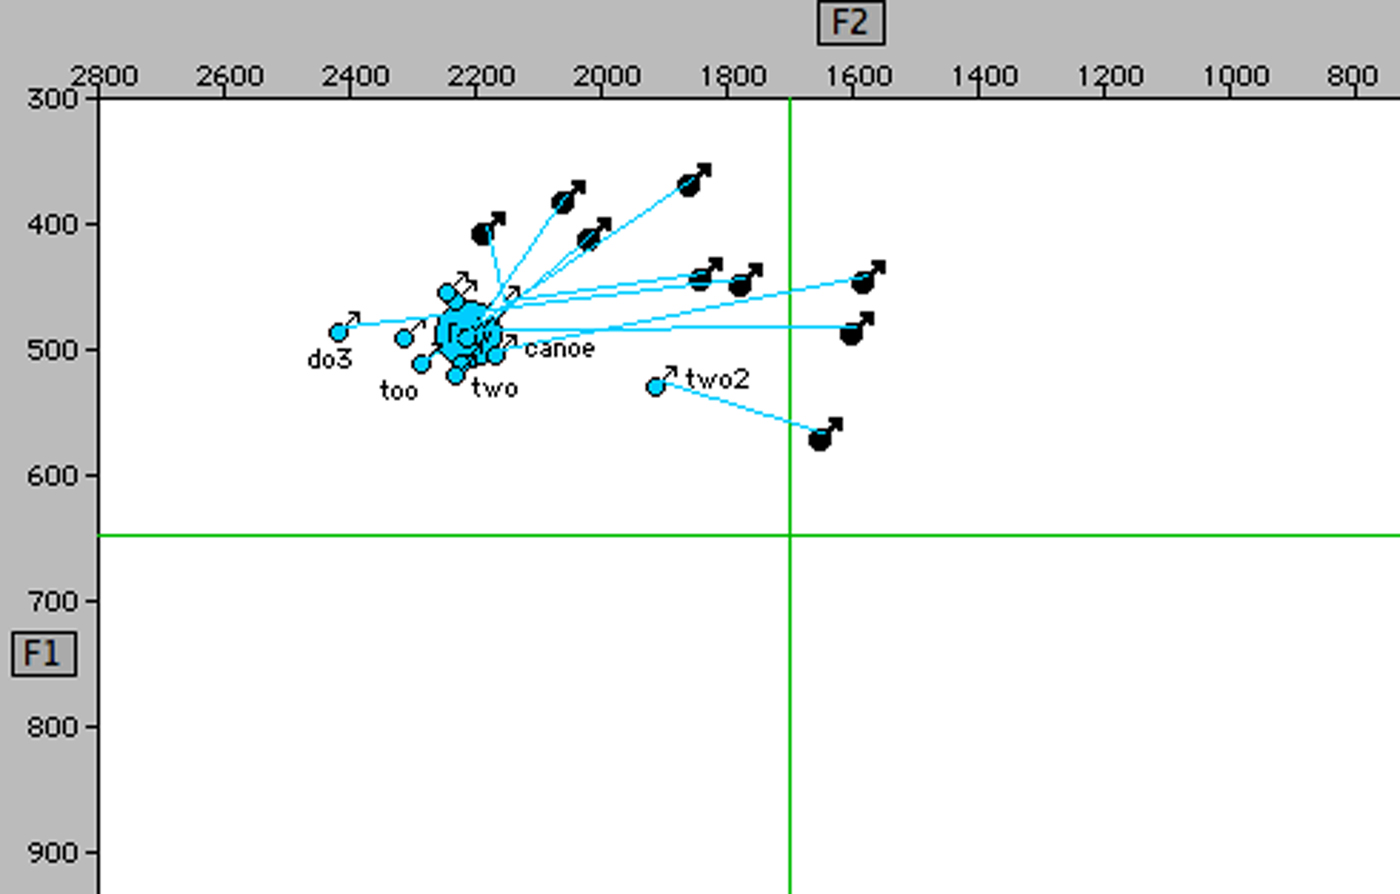
Figure 8. Paul M., 22 upper middle class: glide target of /Tuw/ (do, two).
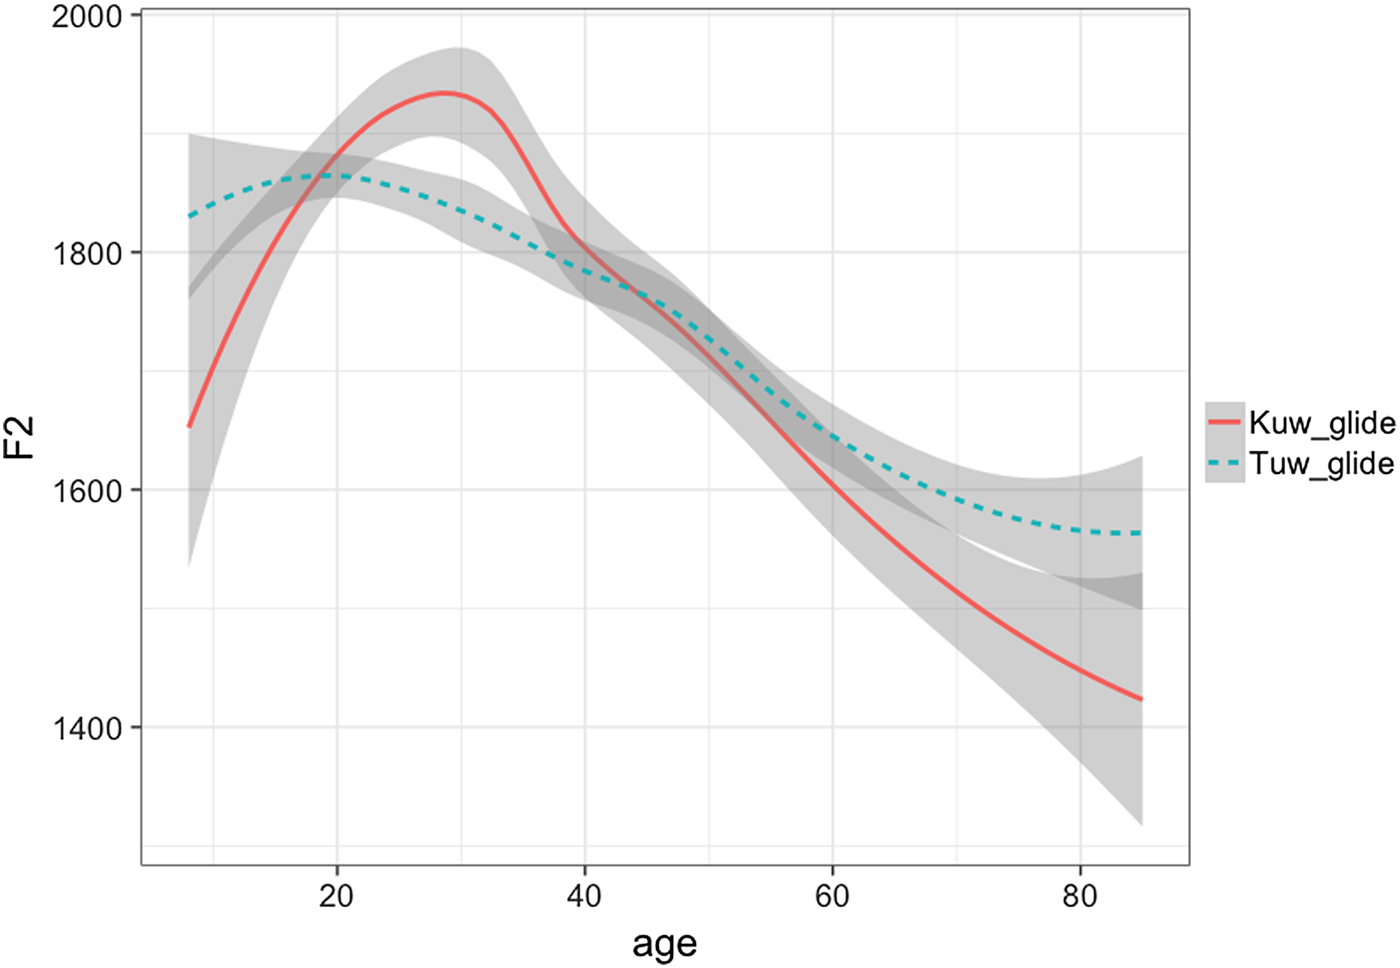
Figure 9. F2 of the glide target of /Tuw/ (two, do) and /Kuw/ (goose, boot) by age.
As with the goose nucleus, age turns out to be by far the most important factor in the fronting of the glide target (Table 4). There is a moderate lag in the fronting by the Pakistani speakers (though not by the Black Caribbean speakers), but, importantly, as in the case of the nucleus, there are no significant effects of gender or social class, with most of the community fronting the glide target at similar rates.
Table 3. Mixed-effects regression analysis of F2 of /Tuw/ (two, do) glide target
n = 4283 Intercept: 2038.64
Deviance: 63,430.38 Grand mean: 1785.25
AIC: 63,351.44 R 2 = .19
df: 18

Table 4. Mixed-effects regression analysis of F2 of /Kuw/ (goose, boot) glide target
n = 1324 Intercept: 2041.12
Deviance: 19,338.32 Grand mean: 1796.84
AIC: 19,213.23 R 2 = .30
df: 23
goose before /l/
One context in which social class does play a significant role is when goose is followed by /l/, as in pool or school. While there are exceptions (such as some speakers in the US South [Fridland & Bartlett, Reference Fridland and Bartlett2006; Labov et al., Reference Labov, Ash and Boberg2006; Thomas, Reference Thomas2001]), in the vast majority of dialects of English, there is no fronting of goose before /l/, resulting in an allophonic split: back before /l/ and fronted elsewhere. Hughes et al. (Reference Hughes, Haddican, Richards and Foulkes2011, Reference Hughes, Haddican and Foulkes2012) reported, on the basis of a sample of 16 speakers, that fronting is indeed prohibited pre-/l/ in Manchester. However, the larger sample in the current study reveals that while the nucleus of goose before /l/ is usually less fronted than in other phonological environments, the fronting before /l/ is nevertheless quite advanced for many speakers, and its degree appears to be strongly (inversely) correlated with socioeconomic status.
If we examine the speech of middle class speakers, such as Paul M. in Figure 6, we can see the allophonic split characteristic of most dialects of English, with clear phonetic separation between goose before /l/, firmly at the back of the vowel space, and tokens fronted to around 2200 Hz in other environments. However, when we look at working-class speakers, such as Keith T. in Figure 5, we see some lateral tokens positioned in front of the center line. Other working-class speakers, such as Jane F. in Figure 10, show even more advanced fronting: her mean F2 of goose before /l/ is in the center of the vowel space, with some tokens as front as 2400 Hz.
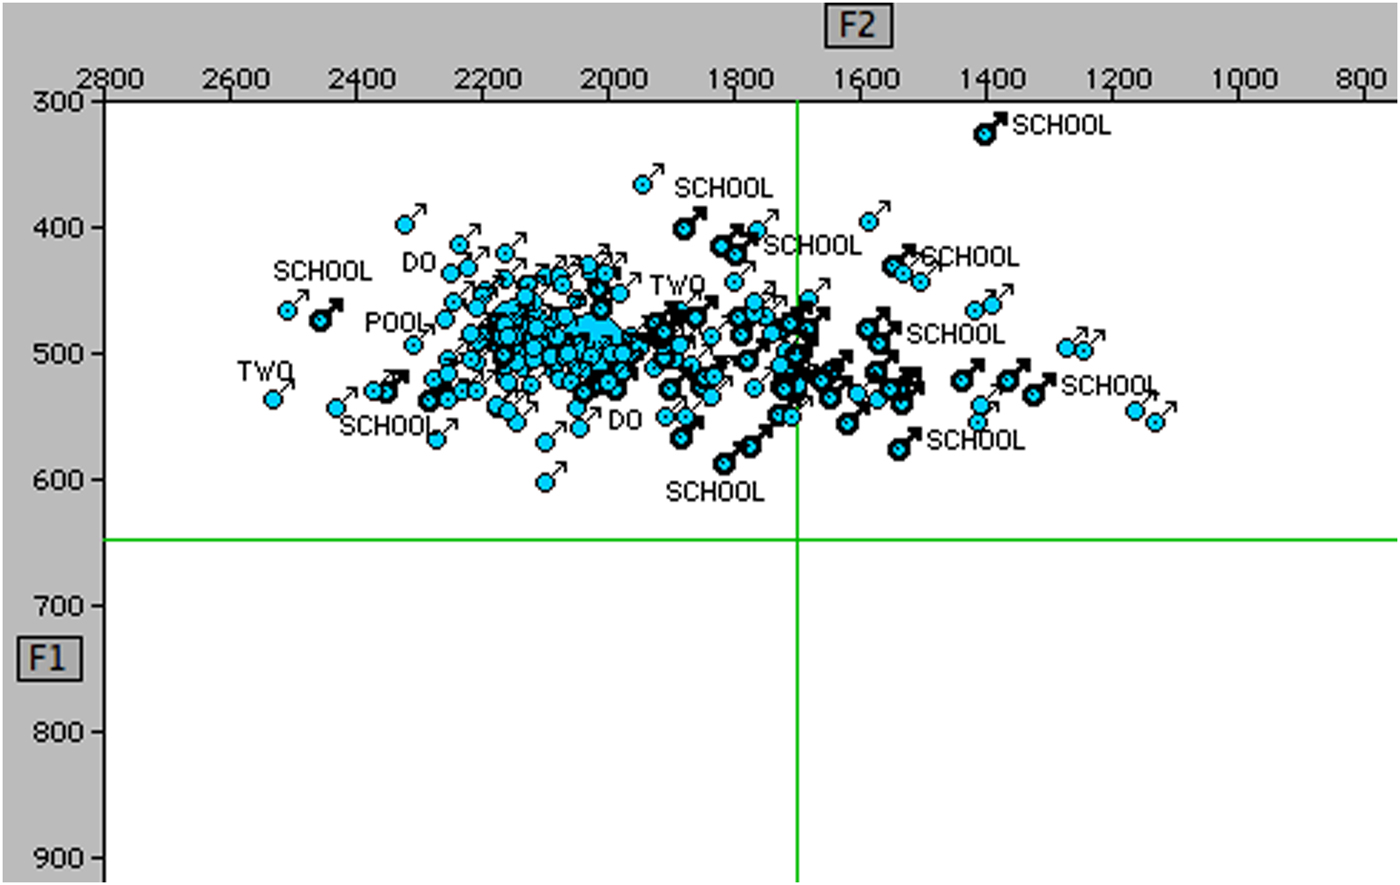
Figure 10. Jane F., 30, lower working class, Manchester: /Kuw/ (goose, boot, food); highlighted tokens before /l/, means not before /l/.
The data suggest that the fronting of goose before /l/ is not a recent development in Manchester. In fact, it can already be seen in the speech of Jim R., born in 1922 and interviewed by William Labov in 1971, in Figure 11. The two tokens before /l/, pools and school, are front of the center line, at around 1800 Hz. They are in the same region as the two other tokens of goose after noncoronals for this speaker, suggesting that at least in the beginning, there was no allophonic differentiation, in other words, that a single category was moving toward the front as a unit. This lack of allophonic differentiation is also seen in the speech of Alan H., 76, one of the oldest speakers in the sample, for whom the tokens of goose before /l/ are just as front as the tokens in other environments, suggesting a single phonological category (Figure 12). Although for the speakers in Figures 13 and 14, aged 53 and 30, respectively, the tokens of goose before /l/ may not be quite as fronted as in other environments, they are nevertheless well front of center, with many tokens occupying high front positions in the 2000 Hz region, in other words, much fronter than what we see in most other dialects of English.
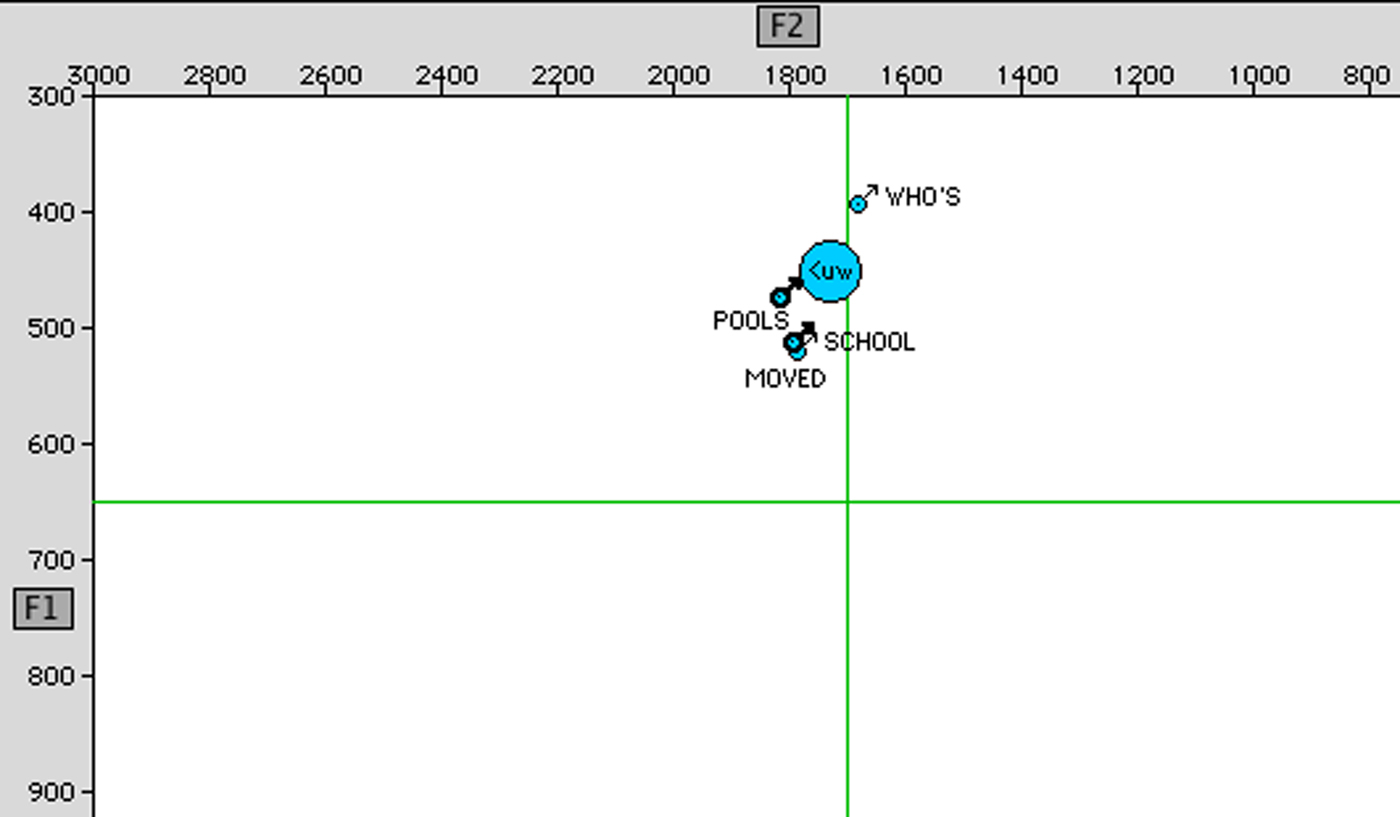
Figure 11. Jim R., 49 b. 1922 (interviewed in 1971), working class: /uw/ (goose, boot, food) highlighted tokens before /l/.
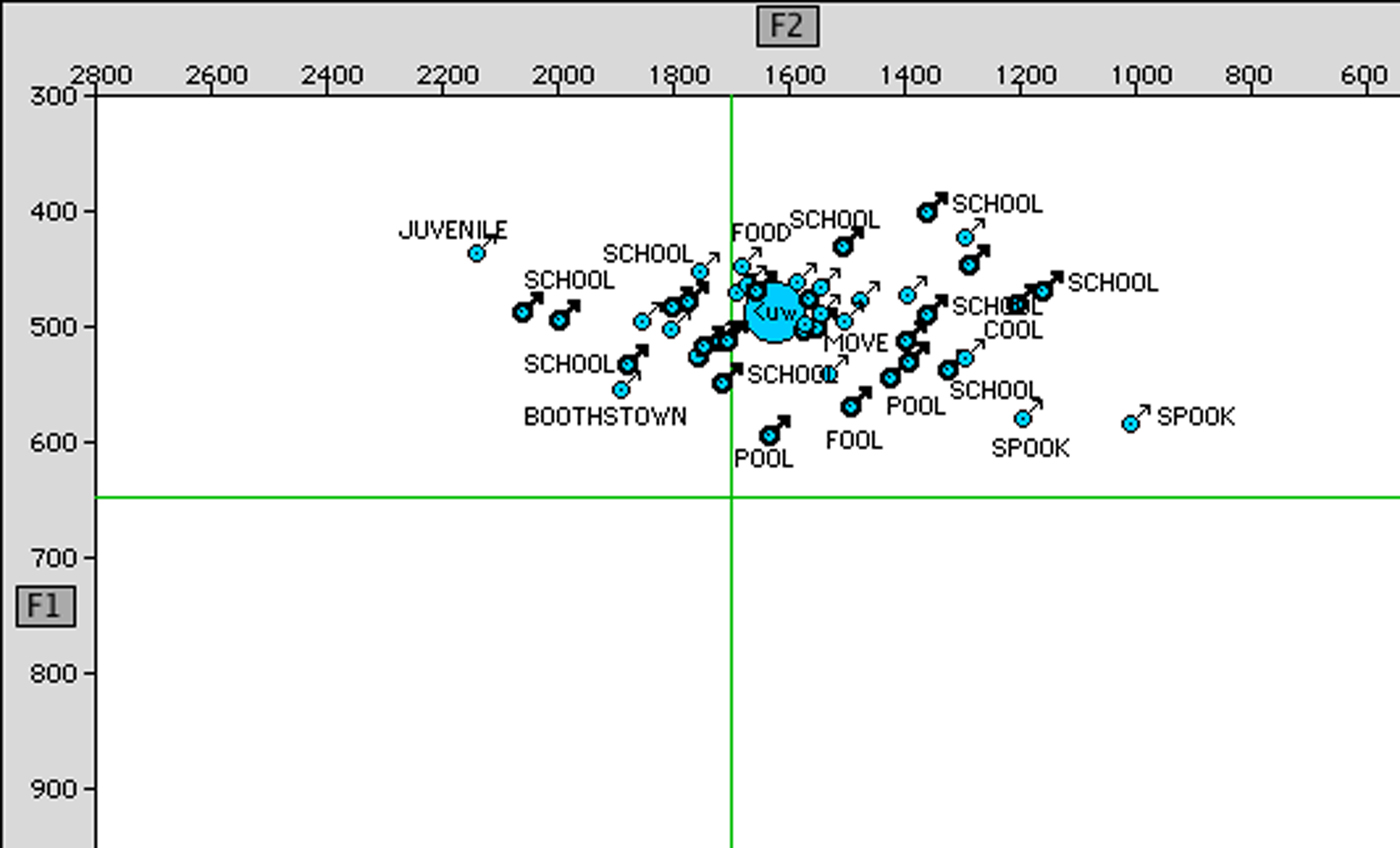
Figure 12. Alan H., 76, lower working class: /uw/ (goose, boot, food) highlighted tokens before /l/.
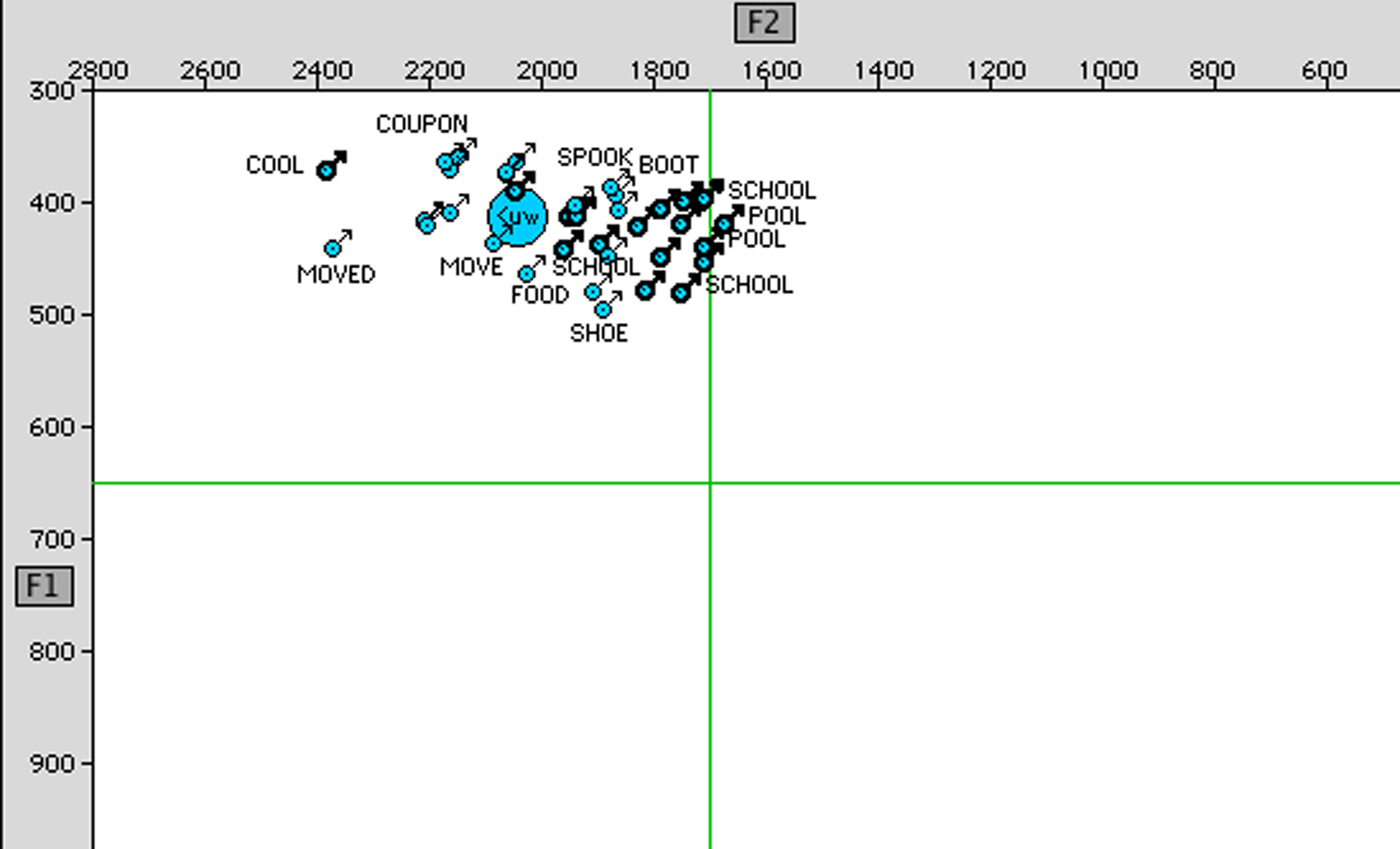
Figure 13. Allison K., 53, lower working class: /uw/ (goose, boot, food) highlighted tokens before /l/.
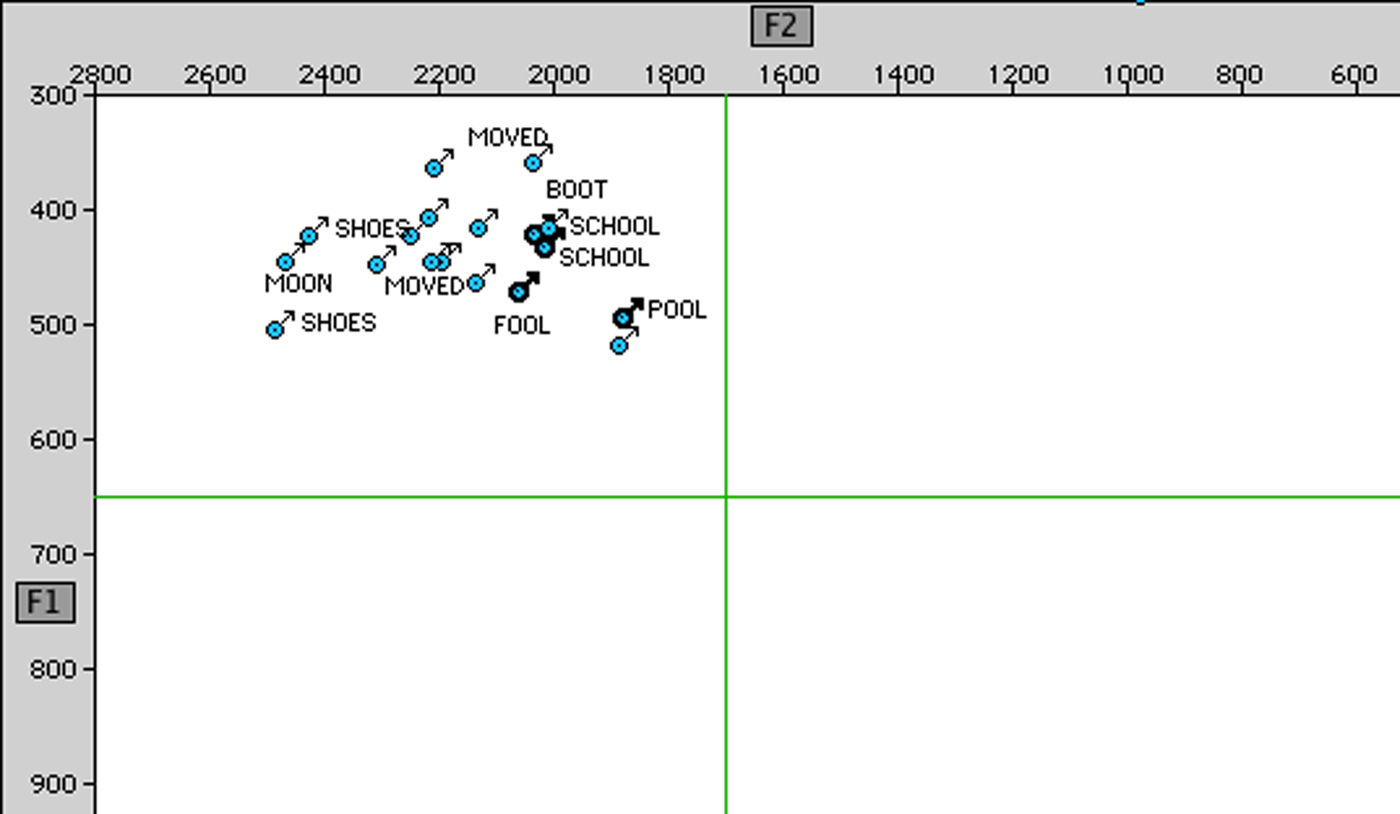
Figure 14. Madonna D., 36, lower working class: /uw/ (goose, boot, food) highlighted tokens before /l/.
As the fronting of goose before /l/ is not a recent development, in that it is as old as the fronting of goose in Manchester in general, it is not surprising that it may be above the level of awareness in the community at this stage, as suggested by a comment made by Frances E. (Figure 15). Most of her tokens of goose before /l/ are at the back of the vowel space. However, one token of school, is in front of the center line and in fact is fronter than her other tokens of /Kuw/, such as moved. This fronted token of the word school comes from her response to the interviewer's request for an example of a feature of the Manchester accent, in which she says, “school [sounding front], that's another one, school, school [laughter]. I don't know any other words that's really Manchester.” It seems therefore that not only is there advanced fronting of goose before /l/ in Manchester, as opposed to most other dialects of English, but also that, at least for some Mancunians, the fronting in this environment may be part of the stereotype of the local accent.
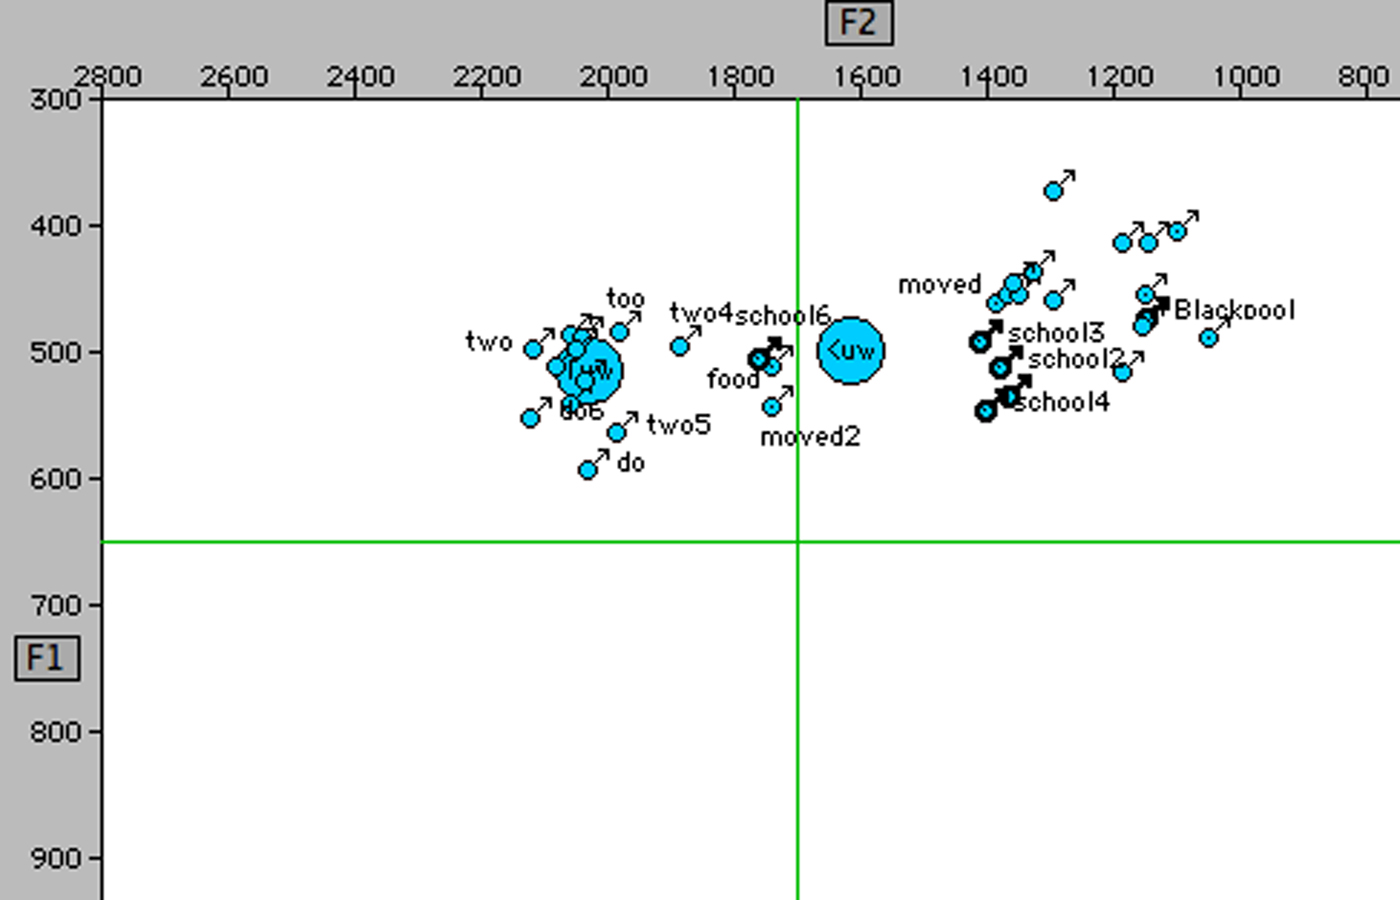
Figure 15. Frances E., 70, upper working class: goose vowel; highlighted tokens before /l/.
The regression analysis in Table 5 reveals that social class and ethnicity play a role in the fronting of goose before /l/, with Black Caribbean speakers and lower social classes having higher expected F2 values. An analysis of the 96 White speakers reported in Table 6 reveals that gender is also significant, with men showing more fronting of the vowel before /l/. In terms of social class, there is a clear monotonic pattern: the lower the social class, the higher the expected F2 value, in other words, the more advanced the fronting. This is presented graphically in Figure 16, where the regression coefficient for each class has been added to the regression constant (Table 5) to produce the expected F2 value for each class, showing a clear pattern of social stratification.
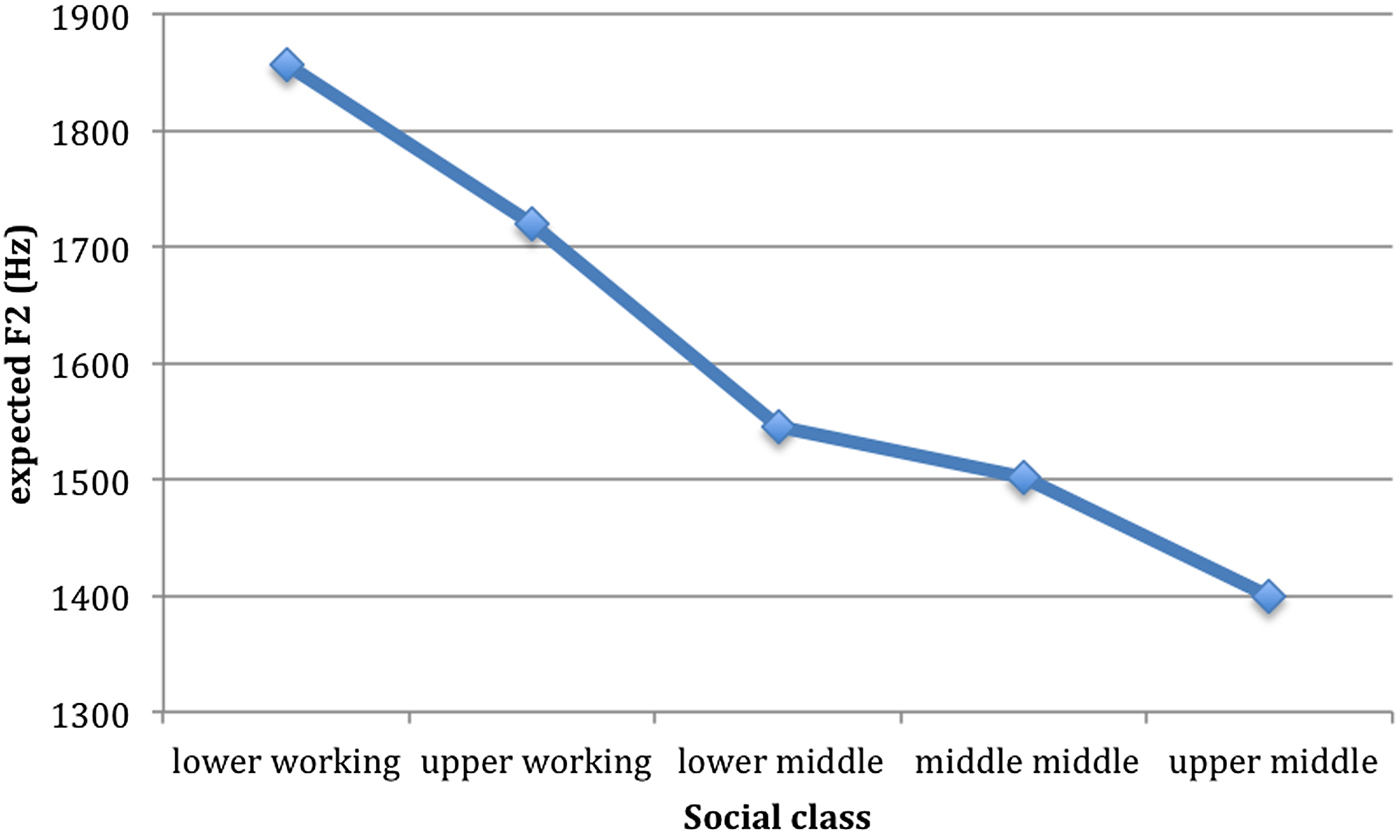
Figure 16. Expected F2 of /KuwL/ (school, pool) by social class; expected F2 = F2 intercept + F2 regression coefficient for each social class.
Table 5. Mixed-effects regression analysis of F2 of /uwL/ (school, pool)
n = 2062 Intercept: 1604.39
Deviance: 28,579.28 Grand mean: 1369.09
AIC: 28,488.77 R 2 = .66
df: 18
Table 6. Mixed-effects regression analysis of F2 of /uwL/ (school, pool) for White speakers
n = 1490 Intercept: 1562.30
Deviance: 20,458.19 Grand mean: 1359.33
AIC: 20,385.58 R 2 = .67
df: 16

Interestingly, age does not come out as a significant factor, suggesting that the variable fronting of goose before /l/ in Manchester is a case of stable sociolinguistic variation rather than a change in progress. At the same time, gender has a significant effect, with women expected to front the vowel less than men by 111 Hz (Table 6). In this way, women align themselves linguistically with the higher social classes in that they use forms common in the lower social classes (i.e., fronted goose before /l/) at lower rates than men. This is reminiscent of the social stratification of well-known stable variables such as (ing) or (th, dh) found in studies of other speech communities, such as Philadelphia (Labov, Reference Labov2001), New York City (Labov, Reference Labov2006), or Norwich (Trudgill, Reference Trudgill1974), where, all other things being equal, higher social classes and women tend to use forms considered to be standard at higher rates than those used by other groups.
One intriguing question is why Manchester should be different from most other dialects of English in having advanced fronting of goose before /l/. We have articulatory and acoustic evidence that Manchester /l/ is phonetically very dark in all positions, that is, it has backer tongue body and reduced tongue tip gesture (Turton, Reference Turton2014). As suggested by Turton and Baranowski (Reference Turton and Baranowski2014), a potential lack of a phonological categorization between light and dark /l/ in Manchester may mean that speakers do not have the reported rule blocking fronting pre-/l/ that most varieties do; their final /l/s may be phonetically dark, but phonologically there is no dark (in opposition to light) allophone to block fronting before /l/. Crucially, Turton and Baranowski found that the working-class speakers had the lack of two distinct phonological categories of /l/ initially and finally, which is consistent with their lead in the fronting of goose before /l/ reported here.
Fronting of goat
The fronting of the goat vowel in Manchester is not nearly as advanced as the fronting of goose; it appears to be a much more recent development in the dialect. It is also sociolinguistically more complex, showing greater differentiation between different social groups involved in the process at different rates. Figure 17 illustrates the position of the vowel nucleus in Manchester at the beginning of the 20th century, plotting the tokens of goat in checked position, /owC/, as in goat, most, home, for Lilly R., born in 1907 and interviewed by William Labov in 1971. It shows a fairly conservative system in comparison with most dialects of English today: although some tokens are as front as the center of the vowel space, most tokens are quite back, with a mean of 1420 Hz. The oldest speakers in the sample show a very similar picture in that their tokens are generally in the back region of the vowel space, for example, Bobby R., aged 69, with a mean F2 of 1334 Hz (Figure 18), or Frances E., aged 70, slightly fronter with a mean F2 of 1529 Hz, though with most tokens still back of the center line (Figure 19). This suggests that there was little fronting of goat in Manchester in the first half of the 20th century.
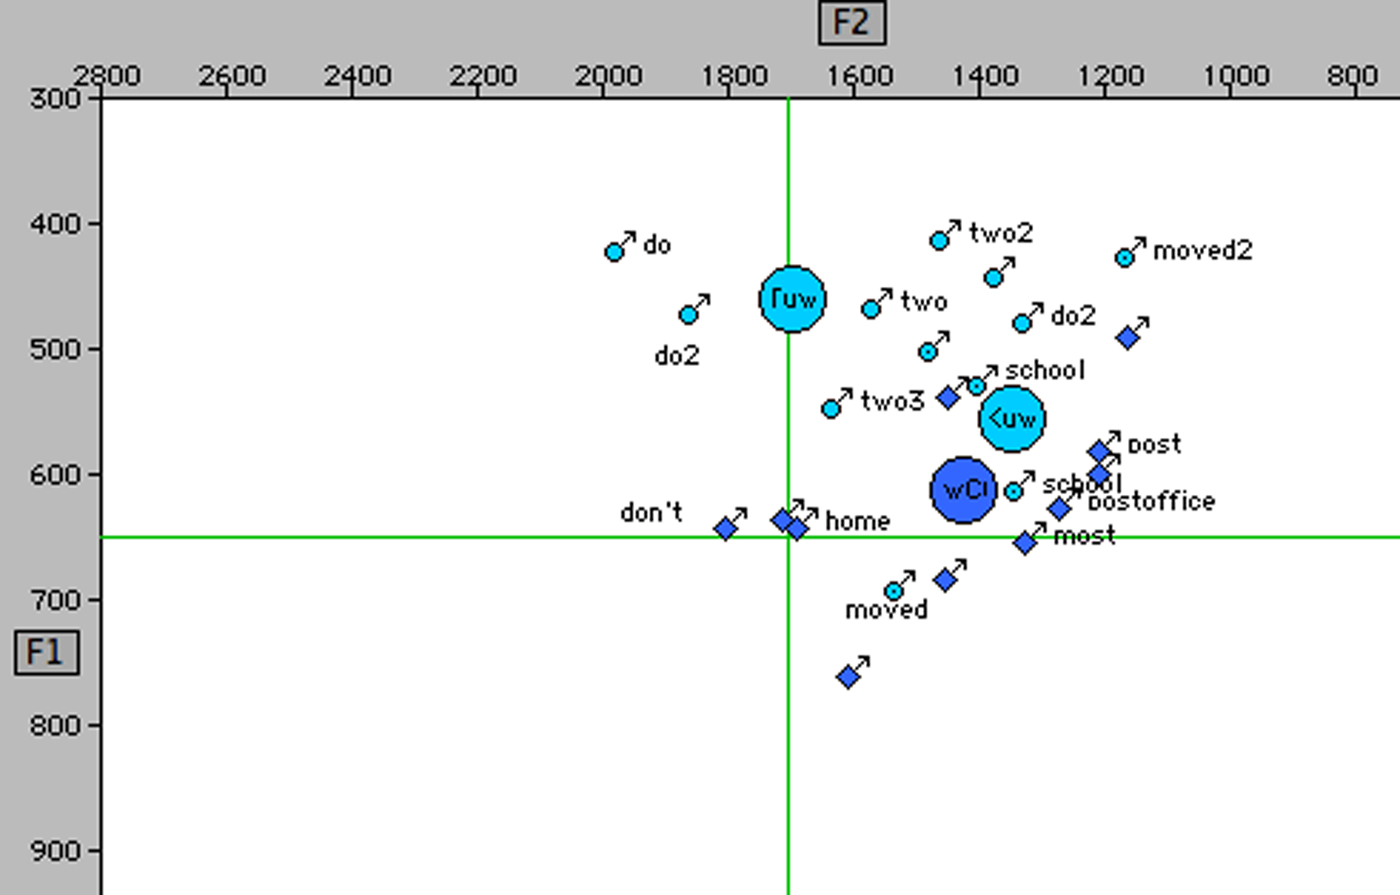
Figure 17. Lilly R., b. 1907 [1971], working class: /Tuw/ (two, do), /Kuw/ (goose, boot), /owC/ (goat, soap).
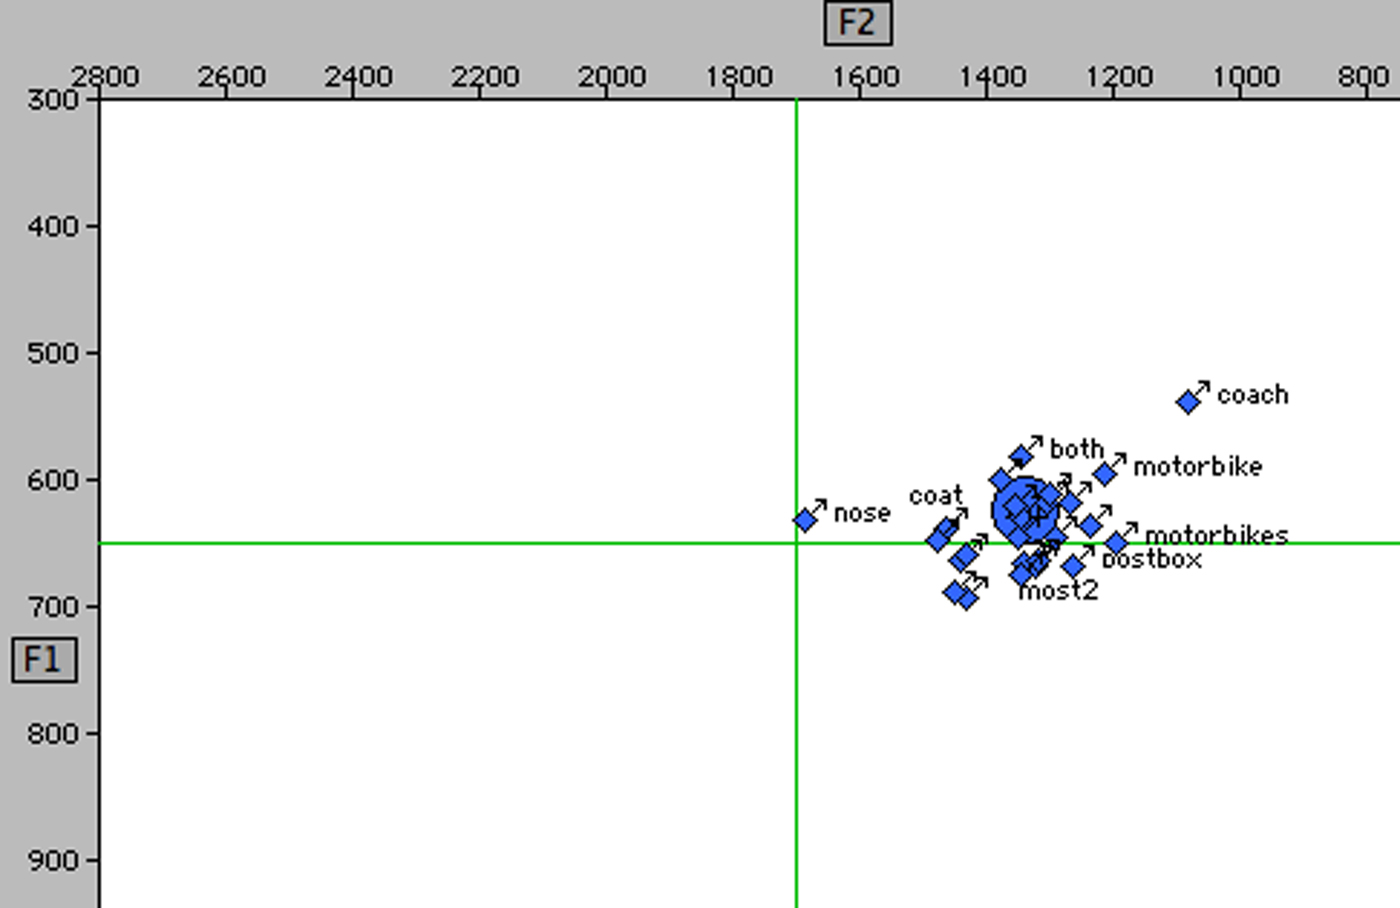
Figure 18. Bobby R., 69, upper working class: /owC/ (goat, soap).
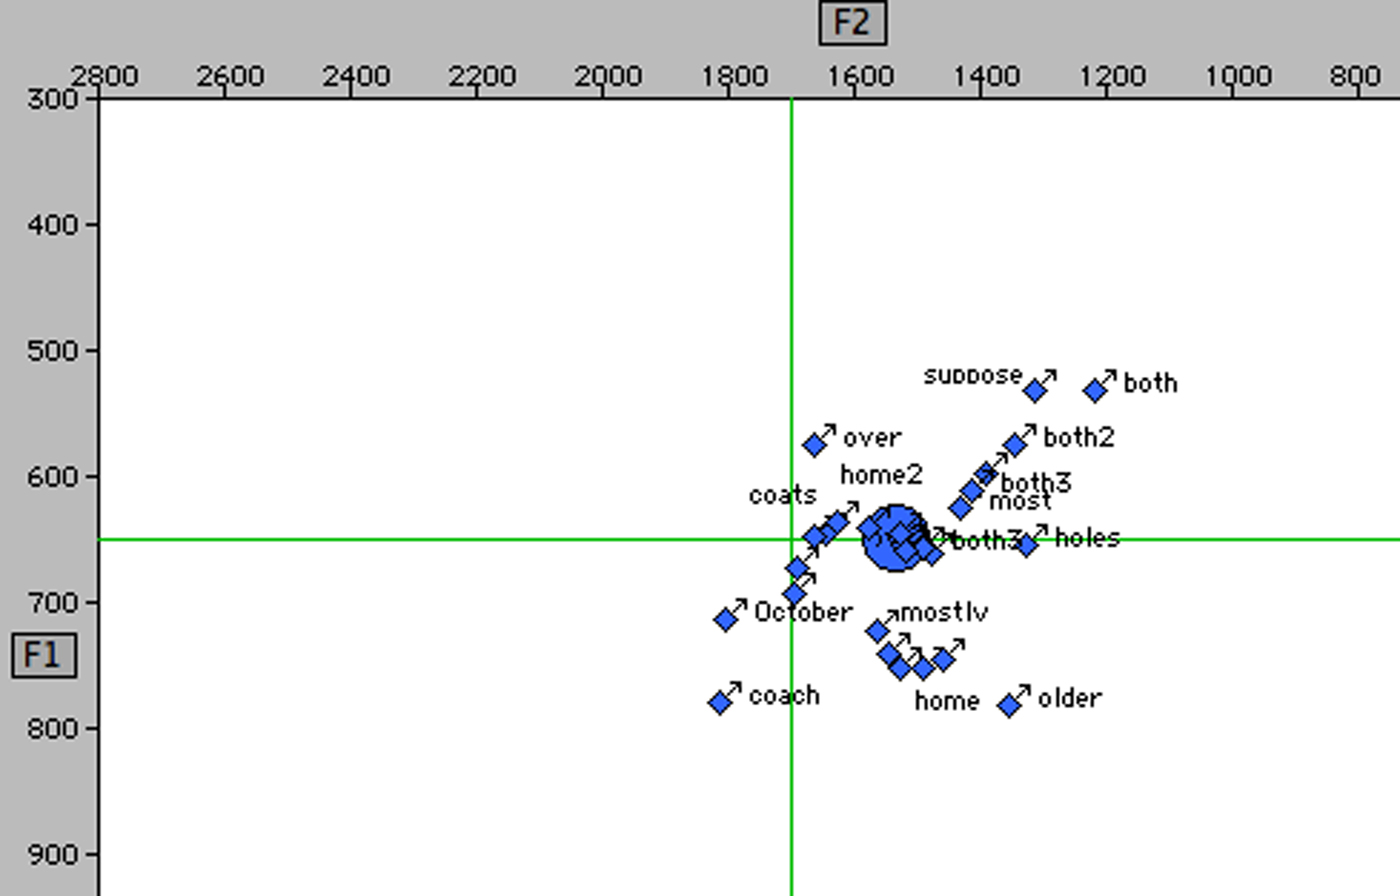
Figure 19. Frances E., 70, upper working class: /owC/ (goat, soap).
Interestingly, however, many speakers representing the youngest generation are not much different in terms of their position of the goat nucleus, with most tokens in the back of the vowel space, as in the speech of Jane F. (Figure 20) or Keith T. (Figure 21). This contrasts sharply with the picture in Figure 22, presenting the position of the nuclei of goat in checked position for 22-year-old Paul M.: nearly all his tokens, when not followed by /l/, are front of center, with a mean F2 of 1927 Hz, which is considerably fronter than, for example, the mean F2 of 1280 Hz for Jane F. in Figure 20. One difference between these speakers is in their socioeconomic status: Paul M. is an upper-middle-class Mancunian, whereas Jane F. and Keith T. are working-class speakers.
Figure 20. Jane F., 30, lower working class: /owC/ (goat, soap).
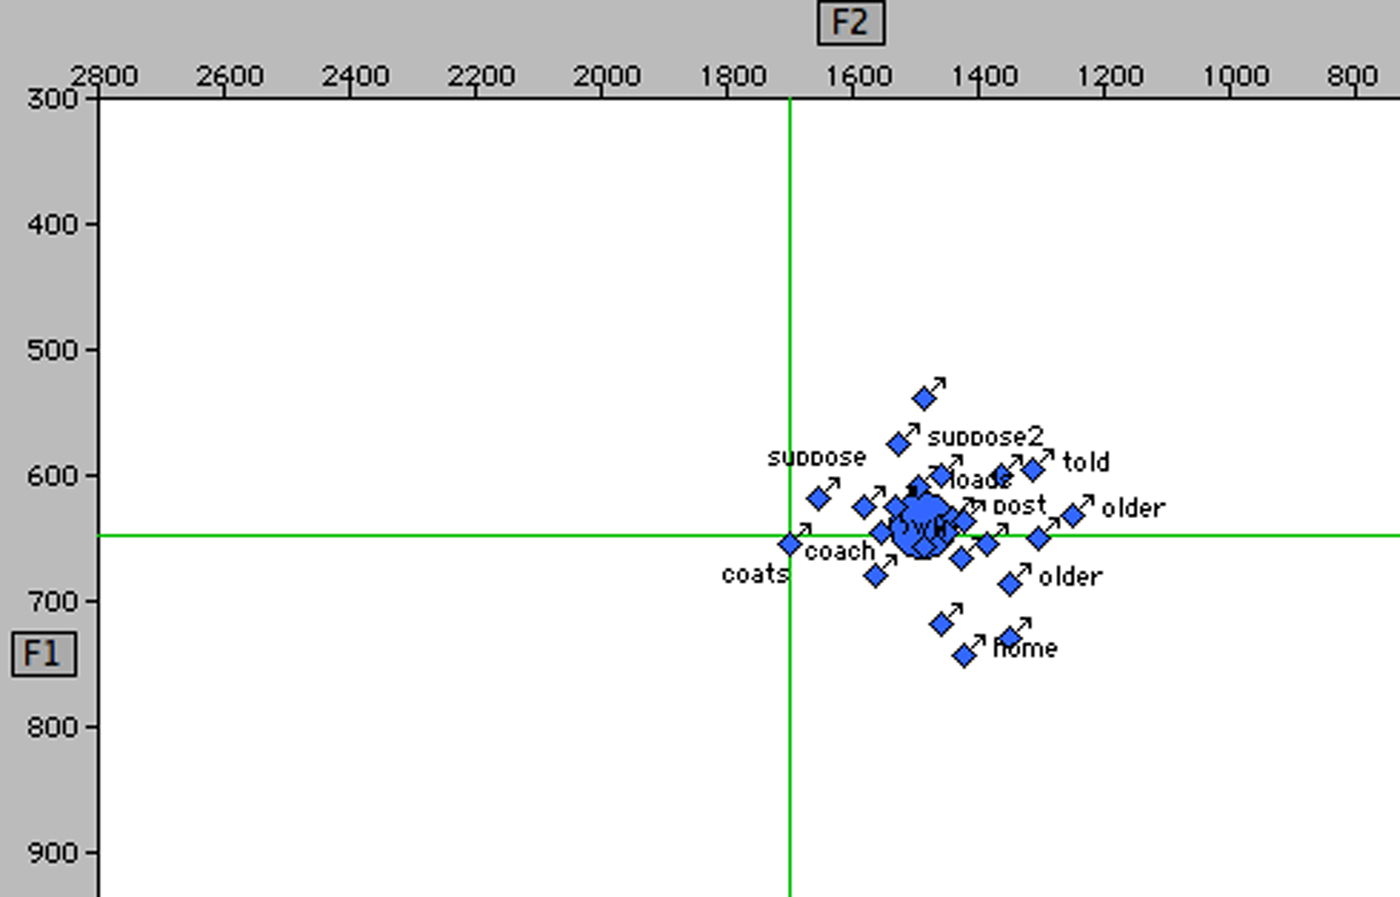
Figure 21. Keith T., 21, lower working class: /owC/ (goat, soap).
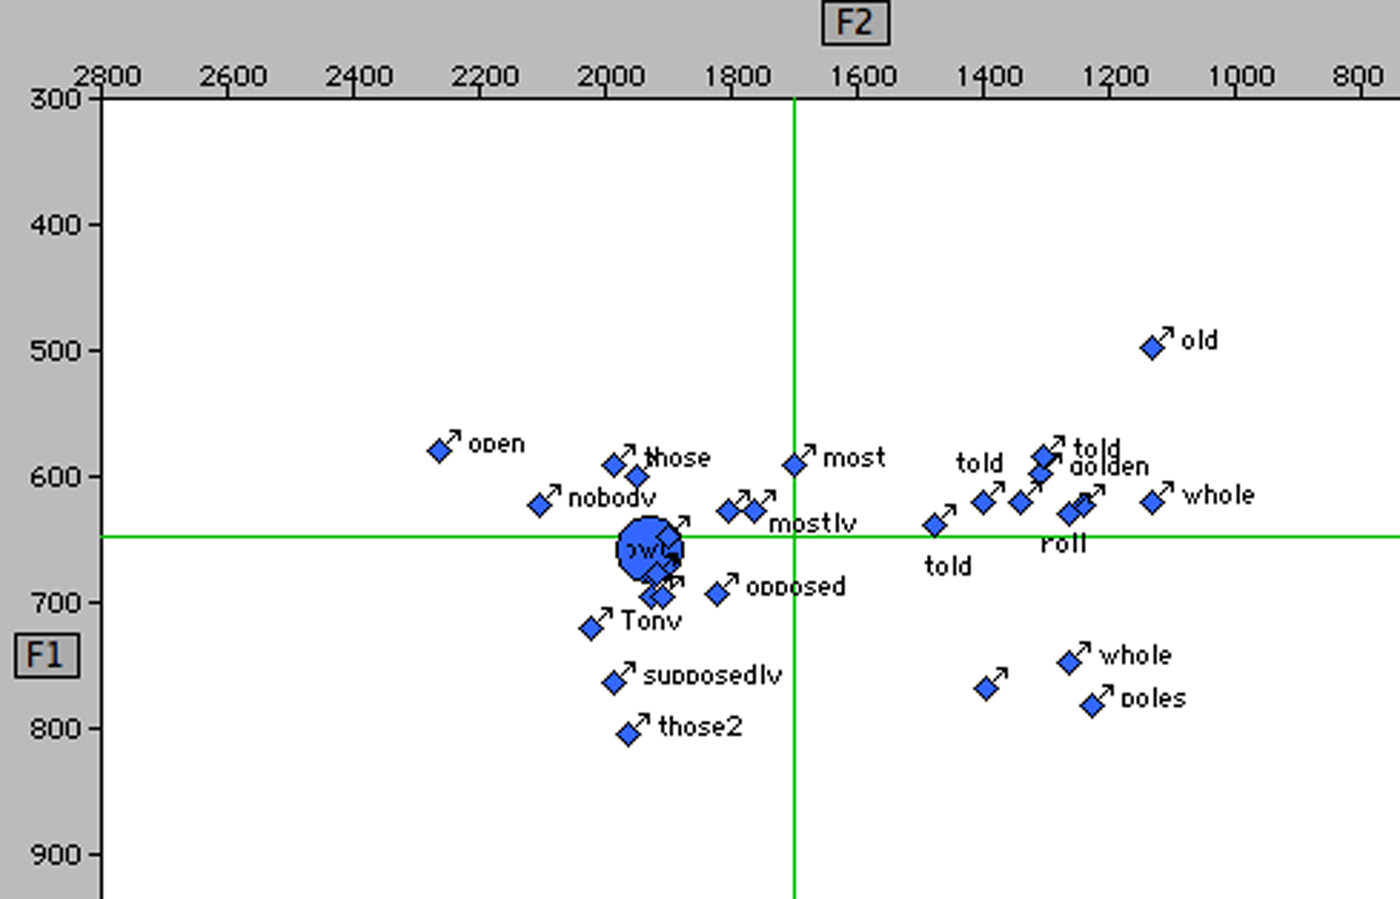
Figure 22. Paul M., 22, upper middle class: /owC/ (goat, soap).
Indeed, the regression analysisFootnote 5 reported in Table 7 shows that social class is a significant constraint on the fronting of the vowel, with higher social classes having higher expected F2 values. The social class coefficients are added to the regression constant and plotted against each other in Figure 23, indicating that the fronting of goat in Manchester is in a monotonic relationship with social class, with each higher socioeconomic level having a higher expected F2 value. In other words, the fronting of the vowel is led by the highest status social group, with groups further away from it showing proportionately less fronting.
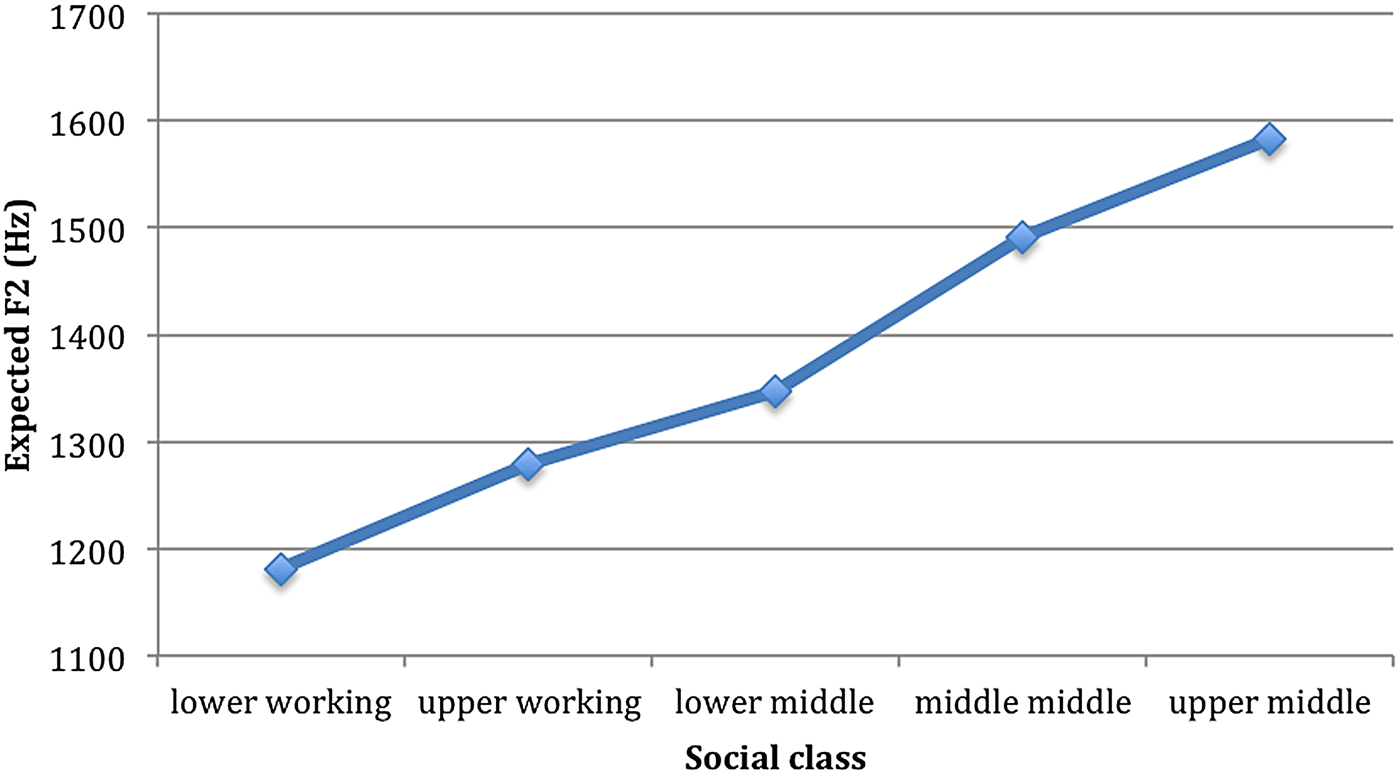
Figure 23. Expected F2 of /owC/ (goat, soap) by social class; F2 constant + F2 coefficient for each class.
Table 7. Mixed-effects regression analysis of F2 of /owC/ (goat, soap)
n = 8188 Intercept: 1376.26
Deviance: 107,633.9 Grand mean: 1392.16
AIC: 107,514.9 R 2 = .64
df: 29
A similar social class effect has been found in other dialects of English, some quite distant from Manchester, such as Philadelphia (Labov, Reference Labov2001), Memphis (Fridland, Reference Fridland2001), or Charleston, South Carolina (Baranowski, Reference Baranowski2008; see also Jansen, Reference Jansen, Calamai, Celata and Ciucci2012), where goat fronting does not seem to conform to the curvilinear principle characteristic of changes internal to the dialect, in other words, changes from below (Labov, Reference Labov2001). Labov (Reference Labov2001:169) noted, for instance, that in Philadelphia the fronting of /ow/ seems to show different social patterning from most other vowel changes, and that it has “become associated with middle-class norms” (187). In Charleston, goat fronting is clearly led by the highest status groups and is arguably a change brought into the dialect (by the highest status group) from outside, that is, the rest of the US South (Baranowski, Reference Baranowski2008), where, as Fridland (Reference Fridland2001) noted, goat fronting is increasingly perceived as a prestige norm. This is therefore not an internal change, but rather a change from above, and, as such, it does not constitute counterevidence to the curvilinear principle. Similarly, in the case of Manchester, it is likely an importation from the South of England, where goat has long shown advanced fronting (Wells, Reference Wells1982). As it happens, a number of the upper-middle-class informants have spent considerable amounts of time in the South, including London and Oxford, for example, for university, and they visit London regularly, to attend opera performances, for instance.
In addition to social class, there is a moderate gender effect in the fronting of goat in Manchester: women can be expected to be more advanced in the fronting by some 90 Hz in comparison with men (Table 7). This is consistent with the findings of other studies of back vowel fronting, both in the United States (e.g., Baranowski, Reference Baranowski2008, Reference Baranowski2013b; Hall-Lew, Reference Hall-Lew2009; Labov, Reference Labov2001) and in England (e.g., Hughes et al., Reference Hughes, Haddican and Foulkes2012; Jansen, Reference Jansen, Calamai, Celata and Ciucci2012; Watt & Tillotson, Reference Watt and Tillotson2001).Footnote 6 However, there is also an interaction between gender and social class: while the middle classes, including the lower middle class (p = .0051), do show a significant female lead, the working class shows no significant gender difference, suggesting that the fronting has not reached this social group yet.
However, one important question is whether the fronting of goat in Manchester is a change at all, as age is intriguingly missing from the list of the significant coefficients in Table 7. On closer inspection, this lack of an age effect for the sample as a whole turns out to be due to the interaction of age and social class (p = .0283). Figure 24 plots the F2 values of /owC/ by age for three major social classes: middle class (upper middle and middle middle), lower middle class, and working class. It shows that there is a change in apparent time, but it is limited to the highest status groups. Regression analyses conducted separately for the three major classes confirm that while there are no significant trends in apparent time for the working and the lower middle class, there is indeed a significant change in apparent time for the highest status groups, with fronting expected to increase by 91 Hz with each younger generation of 25 years (−3.65 Hz for each year in Table 8).
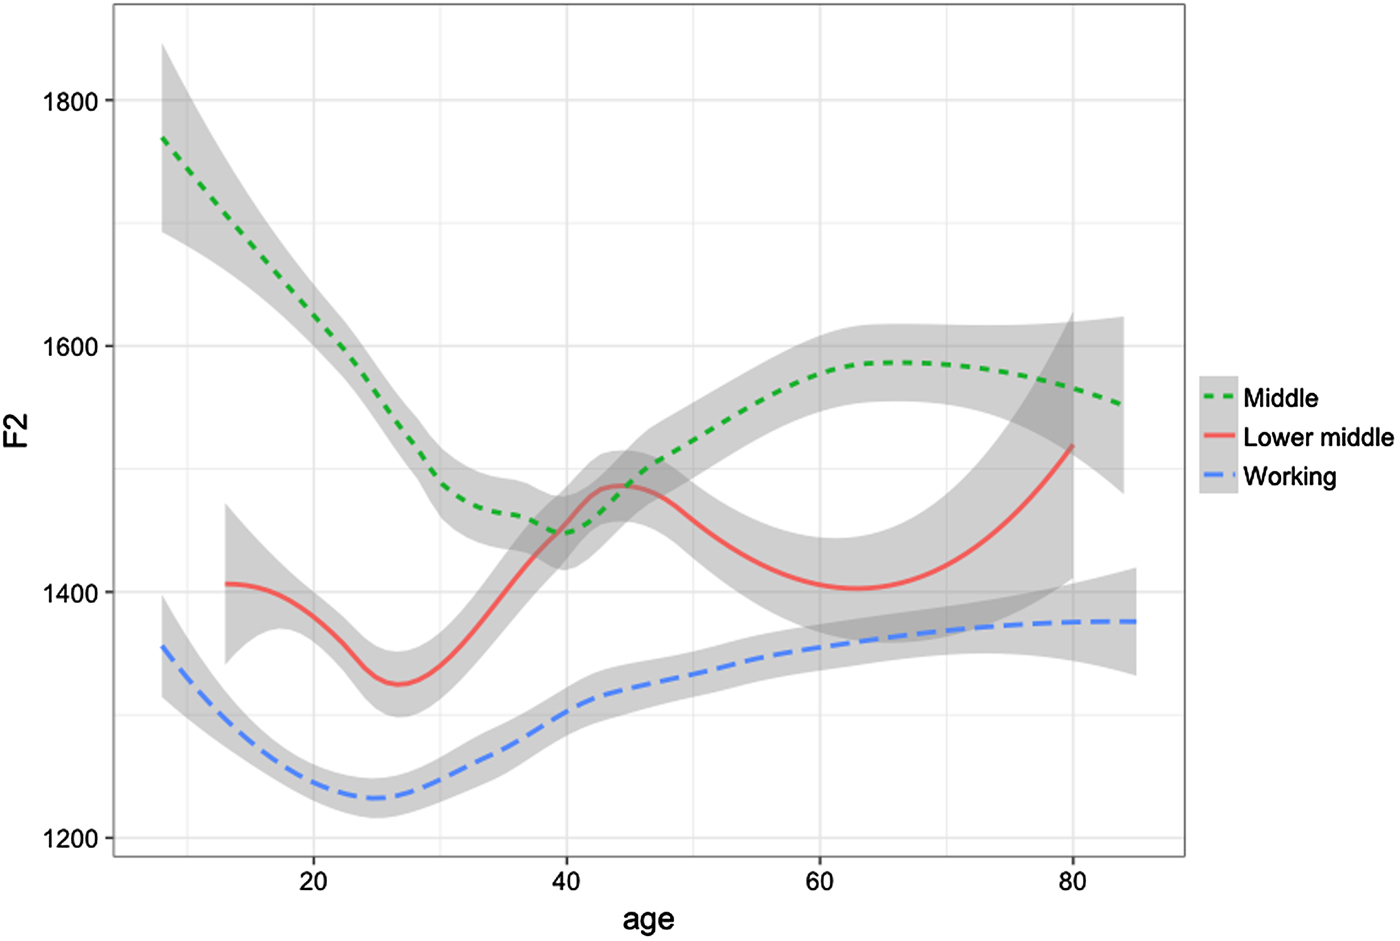
Figure 24. F2 of /owC/ (goat, soap) by age and social class.
Table 8. Mixed-effects regression analysis of F2 of /owC/ (goat, soap) for middle and upper middle class only
n = 1935 Intercept: 1562.58
Deviance: 25,610.04 Grand mean: 1551.63
AIC: 25,498.67 R 2 = .63
df: 25
Ethnicity
Ethnicity turns out to be another significant factor in the fronting of goat in Manchester. Table 7 reports regression coefficients for the three ethnic groups in the sample: White, Pakistani, and Black Caribbean. The two ethnic minorities show considerably less fronting than the White population. The expected F2 of /owC/ for Pakistani and Black Caribbean speakers is lower by some 182 Hz in comparison with White Mancunians (Table 7). The difference is even greater for the middle classes, the leaders of the change, where White speakers are ahead of Pakistani speakers by 377 Hz (Table 8).
While ethnic minorities have been found to participate in the fronting of goose in a number of dialects of English (e.g., Fought, Reference Fought1999; Mesthrie, Reference Mesthrie2010), they are usually less advanced in the fronting of goat. This is the case with African Americans in the United States (e.g., Fridland, Reference Fridland2003; Fridland & Bartlett, Reference Fridland and Bartlett2006; Thomas, Reference Thomas2001; see also Yaeger-Dror & Thomas, Reference Yaeger-Dror and Thomas2010). In Charleston, South Carolina, for example, goat fronting shows very similar social constraints to those operating in Manchester—the change is led by the highest-status groups—with African Americans having significantly lower F2 values (Baranowski, Reference Baranowski2013a). They are quite distant socially from the group introducing the change into the dialect, that is, the White upper middle class. Similarly, in Manchester, ethnic minorities are likely to be more socially distant from the White upper middle classes leading the change than the socioeconomic level assigned to them on the basis of their occupation might suggest.
Another reason for this sizeable effect of ethnicity, one that may be at least as important, is possible substrate influence from the heritage languages. It may be particularly strong for Black Caribbean speakers, as Caribbean English is known for its back and often ingliding goat (and face) vowel (Wells, Reference Wells1982). Indeed, some of the Black Caribbean speakers in the sample, having grown up in Manchester, show some ingliding of the long mid vowels, which, in contrast to some other Northern areas (Orton, Sanderson, & Widdowson, Reference Orton, Sanderson and Widdowson1978; Wells, Reference Wells1982), is not a feature of the local dialect.
Glide target of goat
In addition to the fronting of the nucleus, there has also been some fronting of the glide of goat in Manchester, operating with similar social constraints. Figures 25 and 26 present the glide targets of goat for two speakers representing the oldest and the youngest generations in the sample: the glide targets in the speech of 22-year-old Paul M. (Figure 25) occupy a much fronter position in comparison with the speech of 70-year-old Frances E. (Figure 26), indicating a change in apparent time, affecting the relative positions of the nucleus and the glide. However, age is clearly not the only factor at play, as shown by the speech of 21-year-old Keith T. (Figure 27): his goat tokens glide toward the high back area of the vowel space, in other words, they are much closer to those of Francis E., aged 70, than to those of Paul M., aged 22.

Figure 25. Frances E., 70, upper working class: glide target of /owC/ (goat, soap).
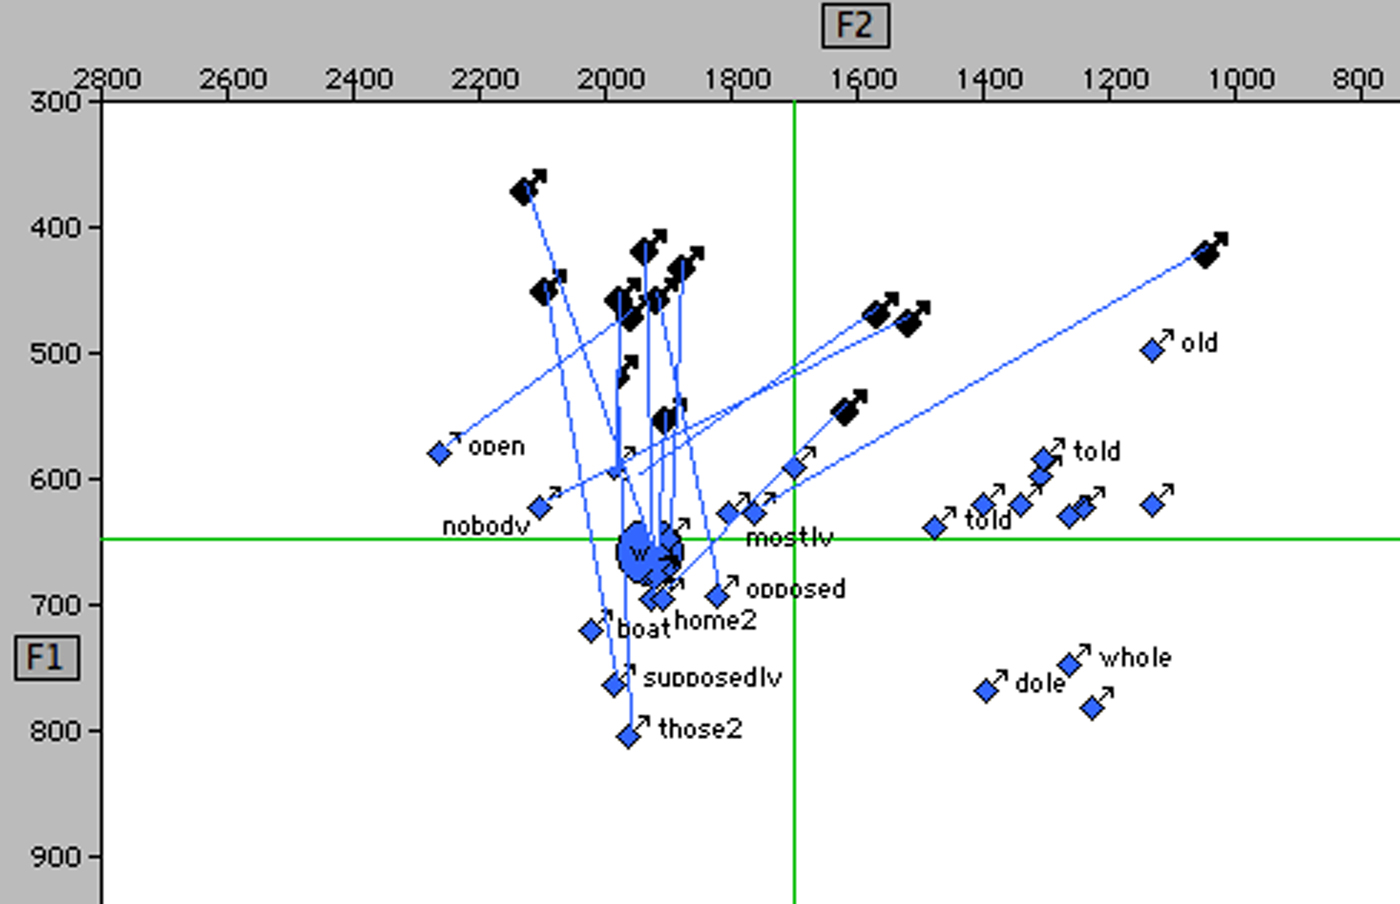
Figure 26. Paul M., 22, upper middle class: glide target of /owC/ (goat, soap).
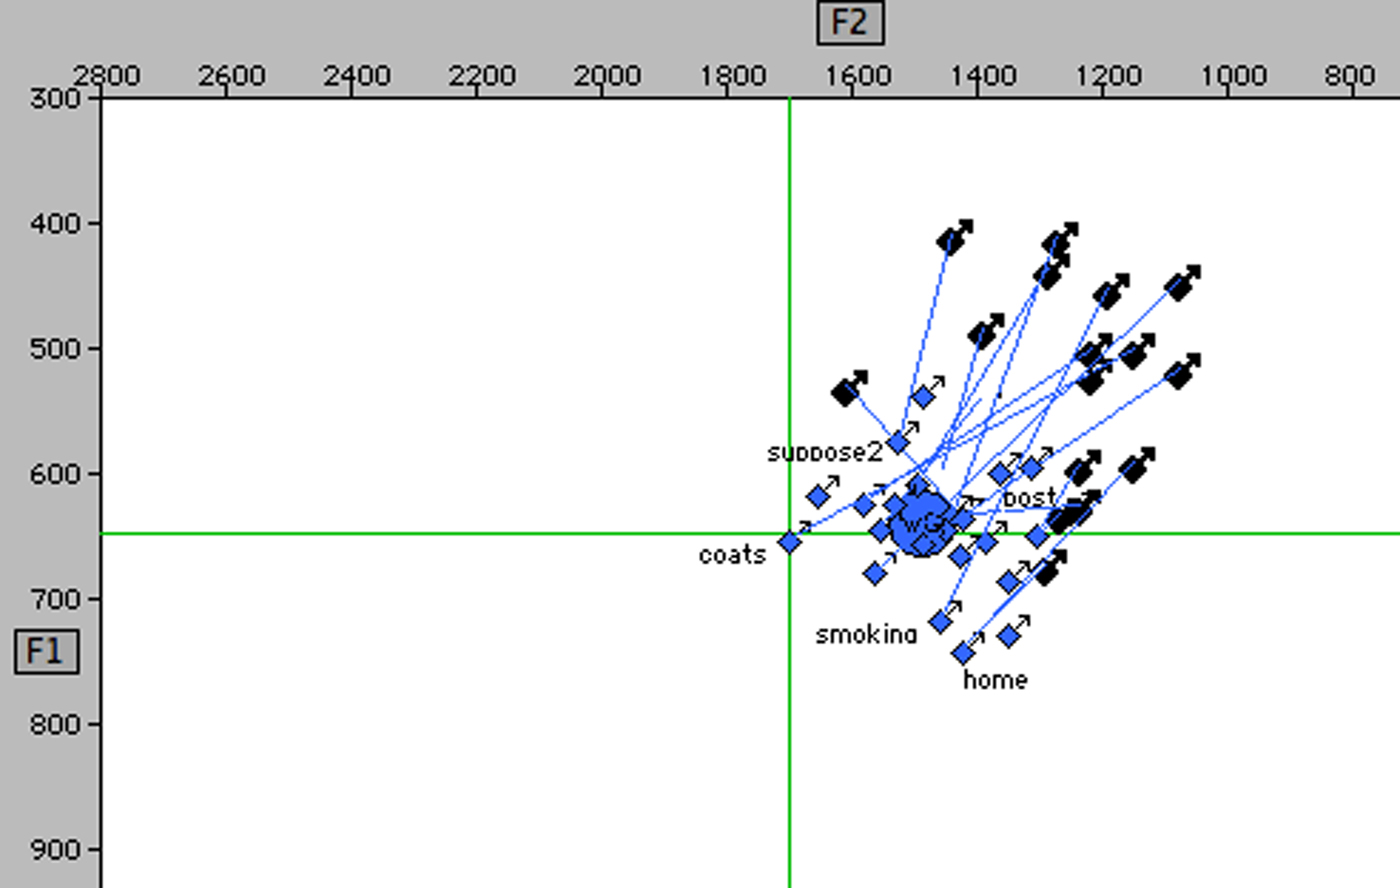
Figure 27. Keith T., 21, lower working class: glide target of /owC/ (goat, soap).
Again, social class plays an important role, showing a monotonic relationship with the fronting with higher classes being more advanced in the fronting of the glide (Table 9). The ethnic minorities show considerably lower F2 values, paralleling their lag in the fronting of the nucleus seen in Table 7. There is a significant age trend for the sample as whole with each younger generation of 25 years expected to have higher F2 values by around 59 Hz (Table 9), but the change is most vigorous for the middle classes, with working class speakers showing no change in apparent time. A regression analysis conducted separately for the middle class (middle middle and upper middle class) in Table 10 shows an expected increase of 78 Hz for each younger generation of 25 years; there are no significant age trends for the lower middle and the working classes. There is again a female lead for the middle classes (including the lower middle class), but no gender difference for working-class speakers.
Table 9. Mixed-effects regression analysis of F2 of /owC/ (goat, soap) glide target
n = 7749 Intercept: 1351.7
Deviance: 107,904.8 Grand mean: 1255.93
AIC: 107,767.1 R 2 = .43
df: 29

Table 10. Mixed-effects regression analysis of F2 of /owC/ (goat, soap) glide target for middle class only
n = 1791 Intercept: 1446.21
Deviance: 24,882.94 Grand mean: 1453.79
AIC: 24,755.99 R 2 = .40
df: 25

Attitudinal factors
A questionnaire on attitudes toward Manchester was administered to a subset of 63 White speakers at the end of the interview. The informants were asked to answer three questions:
-
1. “On a scale of one to ten, how Mancunian do you feel?”
-
2. “On a scale of one to ten, how happy are you living in Manchester?”
-
3. “On a scale of one to ten, how much would you like to live in a different UK city?”
Since none of the responses were lower than 4, they were transposed onto a 1 to 7 scale for the statistical analysis, where they were entered as an independent factor in a series of mixed-effects regressions in R (lmer)Footnote 7 with the F2 of goose and goat as the dependent variables; the goal was to explore the effect of attitudes on the realization of the vowels. There was no significant effect of attitudes for goose, except before /l/, as in school and fool, for Question 1: the more Mancunian the speakers feel the fronter the vowel before /l/ (see Table 12). Question 1 also turned out to be significant for the realization of goat: the more Mancunian the informants feel, the backer the vowel (see Table 15). We shall focus on this significant effect found for Question 1.
At first glance, this result is not unexpected, given that attitudes have been argued to play a similar role in previous studies, most notably in the recent study of back vowel fronting in another northern UK city, York, by Haddican et al. (Reference Haddican, Foulkes, Hughes and Richards2013), using a similar questionnaire to assess local identity. Unfortunately, the York study does not take social class into account in a systematic fashion, so it is not clear whether the attitudinal effects found in York could not be explained just as well or perhaps even better by socioeconomic status. Given the large body of sociolinguistic research pointing to the importance of social class in language variation and change, it seems that attitudinal effects should be considered along with other social factors, particularly socioeconomic status. At least in the case of Manchester, the significant attitudinal result may in fact be a secondary effect due to social class differences, as attitudes toward Manchester turn out to be inversely correlated with socioeconomic status. Figure 28 shows the mean scores for the Mancunian question for five social classes: there is a clear trend whereby the lower the socioeconomic level, the more Mancunian the informants feel; this is confirmed by a Pearson correlation of –.44 between the attitudinal scores and social class (p < .0001).
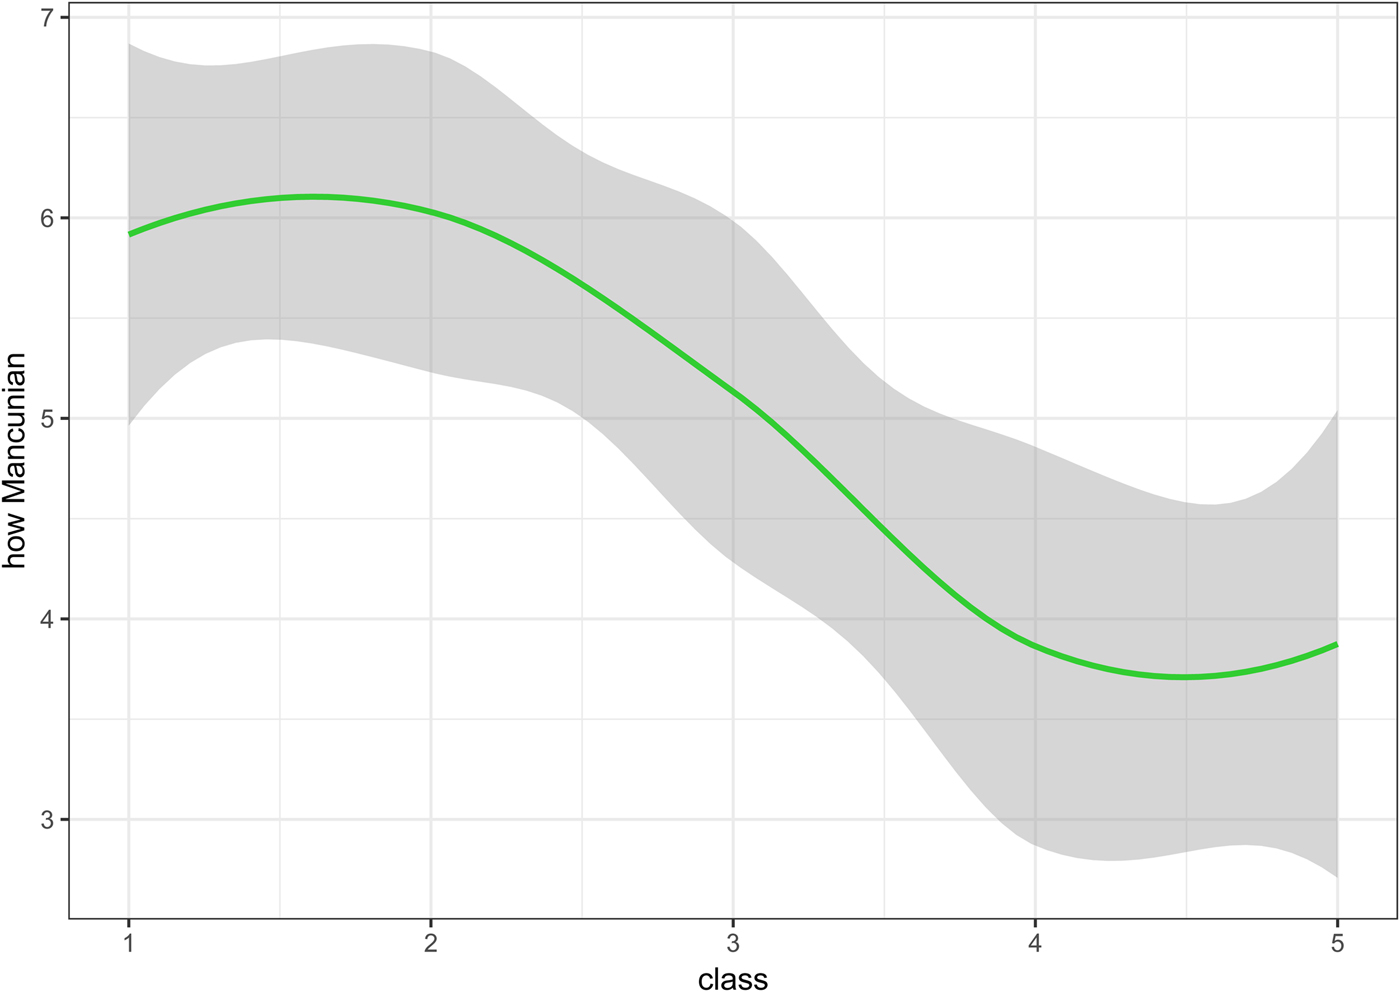
Figure 28. Attitudinal score of “How Mancunian do you feel?” by social class.
It is not surprising therefore that the attitudinal effects that have been found to be significant should be in the same direction as the social class effects discussed in the previous sections: the fronting of goose before /l/ is greater with lower social classes, who also have more positive attitude scores, and the fronting of goat is led by higher social classes, who also have less positive attitude scores. Interestingly, when social class is not found to play a significant role in Manchester, that is, for the fronting of goose (not before /l/), there is no significant effect of attitudes. In other words, attitudes only turn out to be significant when social class is significant. All of this taken together suggests that the effect of attitudes may be a secondary effect arising from the connection between social status and attitudes.
Let us then assess the contribution of each of these two independent variables. We shall first compare two models: one with social class and one with the attitudinal scores (and all other factors that have been found to be significant in the analyses for the full dataset that has already been discussed) in order to determine which explains the linguistic variation better; both are entered as continuous variables. Note that the dataset we are using now is smaller than the full dataset, as it only includes 63 White speakers for whom attitudinal data is available.
Tables 11 and 12 present the regression analysis of F2 of /uwL/ (pool, school), the first including social class without attitudes, the second with attitudes instead of social class.Footnote 8 Although Table 12 shows that attitudes have a significant effect, this model is worse than the one with social class as indicated by the higher Akaike information criterion (AIC) value: 15,645 (Table 12) versus 15,627 (Table 11), and by the higher Bayesian information criterion (BIC) value: 15,715 (Table 12) versus 15,698.Footnote 9 In other words, the variation in /uwL/ is explained better by socioeconomic status than by attitudes toward Manchester.
Table 11. Linear mixed model of F2 of /uwL/ (school, pool) excluding attitudinal factors
df: 14 LogLik: −7799.5
AIC: 15,627 Deviance: 15,599
BIC: 15,698 No. of obs: 1137
Note: a The preceding sound effect is significant; see the full dataset model in Table 5 for the role of the preceding sound.
Table 12. Linear mixed model of F2 of /uwL/ (school, pool) with attitudes instead of social class
df: 14 LogLik: −7808.3
AIC: 15,645 Deviance: 15,617
BIC: 15,715 No. of obs: 1137
One immediate question at this point is the following: even though social class is a better predictor than attitudes when the two are considered separately, does local identity nonetheless contribute to the explanation of variation in addition to what social class offers, or, in other words, is a model with both social class and attitudes better than one with just social class? Although the correlation between attitudes and social class makes entering both in the same model potentially problematic, the low value of the variance inflation factor (or VIF) at 1.26 (calculated with the usdm package in R)Footnote 10 indicates that colinearity between those two independent variables is unlikely to be a problem. A model including both independent variables is reported in Table 13.
Table 13. Linear mixed model of F2 of /uwL/ (school, pool) with both social class and attitudes
df: 15 LogLik: −7797.1
AIC: 15,624 Deviance: 15,594
BIC: 15,700 No. of obs: 1137
The two nested models—one with social class only (Table 11) and the other with both social class and attitudes (Table 13)—are significantly different by an ANOVA comparison in R (p = .028). However, it is not clear that the more complex one (with attitudes added) is better: it is better on AIC (with a lower value of 15,624 vs. 15,627 for the simpler model), but it is worse on BIC (with a higher value of 15,700 vs. 15,698 for the simpler model). Given that these two measures point to a different model as the better one, we cannot confidently conclude that adding attitudes to social class improves the explanation of the variation. Note at the same time that a model with attitudes only (Table 12) is clearly worse than one where social class has been added (in addition to attitudes; Table 11): the two models are significantly different by an ANOVA comparison (p < .0001), and the values of both AIC and BIC are lower for the model that also includes social class: 15,624 versus 15,645 for AIC, and 15,700 versus 15,715 for BIC. In other words, adding social class to attitudes significantly improves the model, whereas adding attitudes to social class does not.
The next two tables present the regression results for goat. As we saw in the previous sections, the working class is not participating in the fronting of this vowel—there was no significant age effect for this social group and no significant gender difference. Therefore the following analyses include three social classes: lower middle, middle middle, and upper middle. Table 14 confirms the most important findings from the full dataset: a significant effect of preceding sound, a sizeable social class effect, with higher classes leading the fronting, a female lead, and a trend in apparent time. Table 15 presents the model with attitudes instead of social class, showing that attitudes have a significant effect on the fronting of the vowel, with positive attitudes associated with less fronting. However, as in the case of goose, the model with attitudes is worse than the one with social class, as measured by the AIC and BIC.
Table 14. Linear mixed model of F2 of /owC/ without attitudinal factors (excluding WC speakers)
df: 18 LogLik: −13,336
AIC: 26,709 Deviance: 26,673
BIC: 26,810 No. of obs: 2023
Note: a The preceding sound effect is significant; see the full dataset model in Table 7 for the role of the preceding sound.
Table 15. Linear mixed model of F2 of /owC/ with attitudinal factors instead of social class (excluding WC speakers)
df: 18 LogLik: −13,341
AIC: 26,717 Deviance: 26,681
BIC: 26,818 No. of obs: 2023
Attitudes turn out not to be significant (though class is) in a model with both social class and attitudes entered, and, at the same time, an ANOVA comparison shows that the more complex model (with attitudes added) is not significantly different from the simpler one (with class only). In other words, the best model is one with social class but, crucially, without attitudes.
We can conclude therefore that social class is a better predictor than attitudes toward Manchester, that is, socioeconomic status explains the linguistic variation found in the production of goose and goat better than attitudinal factors, and that attitudes do not seem to contribute much to the explanation beyond what social class offers. Consequently, the effect of attitudes on the realization of the back vowels that is found is arguably not a result of attitudes toward Manchester as such, but rather one that is driven primarily by social class differences.
CONCLUSIONS
Although Manchester is involved in the fronting of goose and goat, the social patterning of these two vowels is rather different, suggesting that the origins of these two processes may be different as well. The fronting of goose after coronal onsets is a change nearing completion, with most speakers producing the nucleus in high front position. The fronting of goose after noncoronal onsets is a more vigorous change, showing greater differences between generations. The apparent and real-time data show that the fronting in this environment started later than after coronals, but for the youngest generation, goose in both environments now shows equally advanced fronting, with an F2 above 2000 Hz. Both environments show the adolescent peak, which is sharper for the more vigorous change, the fronting after noncoronals—exactly as predicted by Labov's (Reference Labov2001:453) model of logistic incrementation.
There is generally a lack of social differentiation in the fronting of goose in Manchester. Although Pakistani speakers have slightly lower F2 values than other groups, their goose vowel is nevertheless quite front in the 2000 Hz region. Importantly, there are no gender or social class differences. The one exception is the fronting before /l/, as in school or pool, which is inhibited in most dialects of English, but is quite advanced in Manchester. It is a stable variable showing a monotonic pattern of social class stratification, with lower social classes leading the fronting before /l/, and a male advantage, reminiscent of stable sociolinguistic variables, such as h-dropping and (ing).
goat shows much more social differentiation than goose in Manchester, with socioeconomic status being by far the most important factor. The fronting of the vowel displays a monotonic relationship with social class: the highest-status groups lead the fronting and groups lower on the socioeconomic scale, that is, groups more distant from the leaders, show proportionately less of it. In fact, working-class Mancunians do not show any fronting of goat for any generation—it is not a change in progress for this social group. There are also strong effects of ethnicity, with Pakistani and Black Caribbean speakers showing significantly less fronting than White speakers at the same occupational levels. In other words, ethnic minority speakers holding middle-class occupations show goat fronting at similar levels to those of White working-class Mancunians, which is likely due to ethnic minorities being socially quite removed from the White upper middle classes, the leaders of the change in Manchester.
Given the rather different social patterning of goose and goat in Manchester, it is likely that these two fronting changes have different sources. The fronting of goat has all the hallmarks of a change coming from outside the dialect, led by the highest status social group and showing a female lead. This resembles the development of this change in Charleston, South Carolina, where the fronting of goat is argued to be an importation from the rest of the US South by the upper class (Baranowski, Reference Baranowski2008). Similarly in Manchester, it is likely a borrowing from the South of England,Footnote 11 where the vowel has long shown considerable fronting. Speakers in the highest socioeconomic levels tend to be more mobile and tend to have more contact with the South, and with London, than other Mancunians, and have been the first to adopt the fronting of goat prevalent in the South. Working-class speakers in Manchester have so far resisted this innovation, and it remains to be seen whether they will join the trend in the future or whether goat fronting will form a pattern of stable social stratification.
The fronting of goose, on the other hand, is likely an internal change and not a feature brought from outside the dialect by the most mobile social group. Although we do not see a curvilinear pattern for social class, that is, a lead by an interior social class, which we might expect for an internal change from below (Baranowski, Reference Baranowski2013b; Labov, Reference Labov2001), the fronting of goose may be at too advanced a stage at this point for a curvilinear pattern to be observable in the data, that is, now that the change has spread through the community.
The question remains, however, as to what kind of social patterning goose fronting may have had early on. One way to try to find out is by looking at goose after noncoronals in the oldest generation of speakers in the sample, in other words, speakers over the age of 60, to search for traces of the initial social conditioning of this change. However, regression analysis reveals no significant social class or gender differences even for this oldest generation. If anything, the mean F2 is highest for the lower middle class for speakers over the age of 60, suggesting a curvilinear pattern, but the differences are not statistically significant.Footnote 12 The important point is that we do not see any traces of the highest status groups leading, which would have pointed to a diffusion pattern similar to that of goat. Thus, goose fronting is likely not a case of diffusion from outside—with no clear outside source or a group of transmitters—but an internal change spreading uniformly throughout the community and not led by an extreme social class. This supports Haddican et al.’s (Reference Haddican, Foulkes, Hughes and Richards2013) conclusion that goose fronting in the United Kingdom is unlikely to be a uniform process spreading between different localities, as the linguistic conditioning of the fronting varies, suggesting independent developments.
The results reported herein demonstrate the importance of social class in our understanding of the propagation of language change within the community. One of the most striking findings of this study is the fine-grained layering of the social class effects found for goose before /l/ and for goat, that is, the clean monotonic patterns of social stratification seen for the five socioeconomic levels. The stratification goes beyond just working versus middle class: each adjacent socioeconomic level shows a higher or lower (depending on the variable) level of the linguistic variable in a consistent way. It is clearly not a feature of a particular variable only or found only in a particular direction, because, for example, the fronting of goose before /l/ is led by the lowest class, with each higher class showing proportionately less fronting (Figure 16), whereas the fronting of goat is lowest in the working class and increases with each step up on the socioeconomic scale (Figure 23). The same fine-grained layering of social class effects has been found for other variables in Manchester, such as, the north-force merger (Baranowski, Reference Baranowski2015) and t-glottalling (Baranowski & Turton, Reference Baranowski, Turton and Hickey2015).
This social class pattern, which is found repeatedly and cannot be accidental, is consistent with the classical view of social class, whereby the speech community is composed of layers or strata where some layers are adjacent to each other whereas others are further apart. Adjacent layers are more similar linguistically than layers more distant from each other, separated by other layers. When an innovation starts out in a particular layer, the layers adjacent to it will acquire it faster and will show higher rates of the incoming form than layers further apart from it. This process is then quite mechanical and can be derived from the distance between different groups and the amount of contact that different groups engage in with each other, in other words, this stratification pattern is compatible with the principle of density of contact (Bloomfield, Reference Bloomfield1933; Labov, Reference Labov2001; Trudgill, Reference Trudgill2008, Reference Trudgill2014):
The principle of density implicitly asserts that we do not have to search for a motivating force behind the diffusion of linguistic change. The effect is mechanical and inevitable; the implicit assumption is that social evaluation and attitudes play a minor role. (Labov, Reference Labov2001:20)
Indeed, as the results show, attitudes toward Manchester do not seem to play an important role in the diffusion of the fronting of goose and goat in Manchester. Social class construed in terms of distances between social groups has been shown to be a sufficient and, in fact, better predictor, supporting Labov's (Reference Labov2001:192) conclusion that “the account based on covert attitudes is redundant to the extent that the network daily interaction brings people into contact with the new form in proportion to their distance from the originating group.” These findings are also compatible with recent work on mathematical modelling of language change by Kauhanen (Reference Kauhanen2017; see also Stanford & Kenny, Reference Stanford and Kenny2013) demonstrating (pace Blythe & Croft, Reference Blythe and Croft2012), through computer simulations and mathematical analysis, that change will propagate throughout the community in a well-behaved fashion (i.e., essentially following an S-curve) in the absence of social biases. In other words, it can be modelled successfully just on the basis of the number of connections speakers have in their speech community, without extra social biases.
This does not mean that attitudinal factors should be ignored in investigations of language variation and change, as they have been shown to play an important role in some changes in progress, starting with Labov (Reference Labov1963) on Martha's Vineyard, and recently, for example, by Roberts (Reference Roberts2016) in Vermont. Attitudinal factors likely interact with socioeconomic status in creating linguistic variation, and, as the results suggest, the two factors may not be entirely independent. However, the data presented above is not compatible with a scenario in which attitudes are the primary driving force behind the linguistic variation—they would need to explain the data better than socioeconomic status, which they do not; in fact, for the Manchester variables under investigation, they do not seem to be needed at all.Footnote 13 This suggests that the role of attitudes and local identity may be overestimated in research focusing solely on attitudinal factors. These should be considered along with other social variables, particularly social class, whose importance in elucidating the mechanism of language change remains undiminished.


 Open access