1 INTRODUCTION
During the pre-main sequence (PMS) evolution, the young stellar objects show various types of stellar activity. PMS stars are separated into two main types: low-mass (M ⩽ 2 M⊙) T Tauri stars (TTS) and the more massive (2 M⊙ ⩽ M ⩽ 8 M⊙) Herbig Ae/Be stars (HAEBES) (Joy Reference Joy1945; Herbst et al. Reference Herbst, Herbst, Grossmann and Weinstein1994; Hillenbrand et al. Reference Hillenbrand, Strom, Vrba and Keene1992; Petrov Reference Petrov2003). A special kind of variability can be seen in the PMS stars, which undergo outbursts and/or obscurations. The outbursts of the PMS stars—with amplitude reaching up to 5 mag—are grouped into two types: FUors with the prototype FU Orionis (Reipurth & Aspin Reference Reipurth, Aspin, Harutyunyan, Mickaelian and Terzian2010; Audard et al. Reference Audard, Beuther, Klessen, Dullemond and Henning2014) and EXors with the prototype EX Lupi (Herbig Reference Herbig2007; Reipurth & Aspin Reference Reipurth, Aspin, Harutyunyan, Mickaelian and Terzian2010). Such outbursts are rare occurrences and they are related to PMS stars during their evolutionary state, which ranges from early deeply embedded Class 0/I stage to a late Class II-type object. Theoretical models (see Vorobyov & Basu Reference Vorobyov and Basu2015) predict that after a sequence of eruptions the stars enter a more quiescent phase becoming classical TTS. Also, according to Fehér et al. (Reference Fehér, Kóspál, Ábrahám, Hogerheijde and Brinch2017), FUors might represent the link between Class I and Class II low-mass young stars and the FUor outbursts may play the key role in this transition.
The outbursts of both types of eruptive PMS stars are generally attributed to a sizable increase in the accretion rate from the circumstellar disk onto the stellar surface. In the case of FUors, the accretion rate rapidly increases and remains elevated over several decades or more. EXors exhibit shorter and repetitive outbursts associated with lower accretion rates (Audart et al. Reference Audard, Beuther, Klessen, Dullemond and Henning2014). Spectroscopic observations of EX Lupi itself in outbursts and during its quiescence phases revealed that it is an M0 classical TTS that suffers episodes of variable mass accretion (Herbig et al. Reference Herbig, Aspin, Gilmore, Imhoff and Jones2001; Herbig Reference Herbig2007).
The drops in the brightness of the PMS stars with amplitude reaching up to 3 mag in V-band are mostly seen in the early types of TTS and in HAEBES (Grinin et al. Reference Grinin, Kiselev, Minikulov, Chernova and Voshchinnikov1991; Herbst et al. Reference Herbst, Eisloffel, Mundt, Scholz, Reipurth, Jewitt and Keil2007). Such stars are called UXors, named after their prototype UX Orionis. Different members of this group show different photometric activity which can change over time (Zaitseva Reference Zaitseva1986). It is generally accepted that the observed minima result from the variations in the density of the dust in the orbit around the star, which crosses the line of sight and obscures the star. This idea was first proposed by Wenzel (Reference Wenzel and Detre1969) and then discussed in further research by Grinin (Reference Grinin1988), Voshchinnikov (Reference Voshchinnikov1989), Grinin et al. (Reference Grinin, Kiselev, Minikulov, Chernova and Voshchinnikov1991), Natta & Whitney (Reference Natta and Whithey2000), and Dullemond et al. (Reference Dullemond, van den Ancker, Acke and van Boekel2003).
An important characteristic of UXors is that in their deep minima these objects become bluer—the so-called ‘blueing effect’ or ‘colour reverse’ (Bibo & Thé Reference Bibo and Thé1990). The interpretation of this effect states that the star is surrounded by circumstellar clouds and/or cometary bodies (Grady et al. Reference Grady, Sitko, Russell, Lynch, Hanner, Perez, Bjorkman, de Winter, Mannings, Boss and Russell2000). When one of these objects crosses the line of sight, a decrease in star’s brightness is observed. Because of the absorption, the star initially becomes redder, but in a large extinction the scattered light from the dust clouds begins to dominate and the star becomes bluer. The interferometric millimetre observations of some UXors and their analysis show that these stars are surrounded by circumstellar disks similar to those around TTS: optically thick with a mass 0.01−0.1 M⊙ (Natta et al. Reference Natta, Prusti, Neri, Thi, Grinin and Mannings1999). A large number of UXors are found to be HAEBES, but among the low-mass objects also there are representatives exhibiting the characteristics of UXors, for example, see V582 Aur (Semkov et al. Reference Semkov, Peneva, Munari, Dennefeld, Mito, Dimitrov, Ibryamov and Stoyanov2013) and V350 Cep (Semkov et al. Reference Semkov, Ibryamov and Peneva2017).
Variability of V2492 Cyg (also known as IRAS 20496+4354, PTF 10nvg, and VSX J205126.1+440523) was discovered by Itagaki & Yamaoka (Reference Itagaki and Yamaoka2010). On the basis of the photometric and spectral observations of the object, Covey et al. (Reference Covey2011) concluded that its brightening is indicative of enhanced accretion and outflow similar to the behaviour of V1647 Ori in 2004–2005. According to Aspin (Reference Aspin2011), the spectral characteristics of V2492 Cyg during its outburst in 2010 are very similar to those exhibited by EX Lupi during its 2008 outburst, and V1647 Ori during its elevated phase in 2013. Their conclusion is that V2492 Cyg is similar to EX Lupi although apparently significantly younger. Kóspál et al. (Reference Kóspál2013) concluded that a single physical mechanism is responsible for the brightness changes of the object and the colour variations suggest that the most likely explanation is the changing extinction along the line of sight. Hillenbrand et al. (Reference Hillenbrand2013) discussed the object as a possible source exhibiting both accretion- and extinction-driven high-amplitude variability phenomena. Aspin (Reference Aspin2011) reported periodicity of ~100 d for V2492 Cyg, while Hillenbrand et al. (Reference Hillenbrand2013) found ~220 d quasi-periodic signal from the object.
In this paper, we present our optical BVRI observations of V2492 Cyg and discuss its light curves and colour–magnitude diagrams. Using ours and the available archival observations and data in the literature and in the aavso database, we built the long-term multicolour photometric light curves of the object.
2 OBSERVATIONS AND CALIBRATION OF THE STANDARD STARS
The photometric BVRI observations of V2492 Cyg were carried out with the 2-m Ritchey–Chrétien–Coudé (RCC), the 50/70-cm Schmidt and the 60-cm Cassegrain telescopes administered by Rozhen National Astronomical Observatory in Bulgaria and the 1.3-m Ritchey–Chrétien (RC) telescope administered by Skinakas ObservatoryFootnote 1 in Greece.
Our CCD observations were performed from 2010 August to 2017 December. The technical parameters and specifications for the cameras used, the observational procedure, and the data reduction process are given in Ibryamov, Semkov, & Peneva (Reference Ibryamov, Semkov and Peneva2015). All data were analysed using the same aperture, which was chosen to have a 4 arcsec radius, while the background annulus was taken from 9 to 14 arcsec.
A sequence of six comparison stars labelled from A to F in the field of V2492 Cyg was calibrated in the VRI-bands by Kóspál et al. (Reference Kóspál2011). Since these stars are relatively bright and there is no B-band—we decided to calibrate new BVRI sequence of comparison stars including stars from B to F of Kóspál et al. (Reference Kóspál2011). We chose six more single stars in the field of V2492 Cyg and calibrated all of them in the BVRI-bands of the standard Johnson–Cousins system. Calibration was made during eight clear nights (2010 August 26, 2011 August 17, 2011 September 10, 2011 September 19, 2012 September 03, 2012 September 09, 2012 September 22, and 2015 August 12) with the 1.3-m RC telescope. Standard stars from Landolt (Reference Landolt1992) were used as a reference. Table 1 contains the photometric data for the BVRI comparison sequence. The corresponding average errors in the table are also listed. The stars are labelled from B to L in order of their V-band magnitude and retaining the marks from B to F for the stars from the paper of Kóspál et al. (Reference Kóspál2011). By comparing our measured magnitudes with those of Kóspál et al. (Reference Kóspál2011), we get a very good match for V- and relatively significant differences (0.1–0.2 mag) for R- and I-band. Due to the relative major errors from measurements of the star F, we suspect that it is a possible variable with small amplitude and we advise the observers to use it with discretion.
Table 1. Photometric data for the BVRI comparison sequence.
The chart with the findings of the comparison sequence is presented in Figure 1. The magnitudes of V2492 Cyg from all CCD frames are measured with the standard stars reported in the present paper. The average value of the errors in the reported magnitudes are 0.01−0.02 mag for the I- and R-band data, 0.01−0.03 mag for the V-band data, and 0.02−0.04 mag for the B-band data.
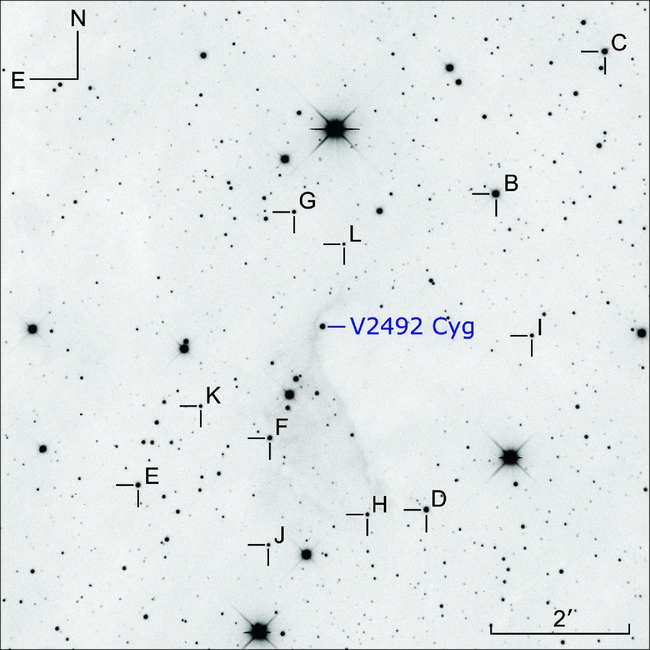
Figure 1. Finding chart for the BVRI comparison sequence around V2492 Cyg received in R-band with the 1.3-m RC telescope.
3 RESULTS AND DISCUSSION
The optical photometric BVRI data of V2492 Cyg received during our photometric monitoring and the ones available in the literature and in the aavso database are presented in Figure 2. The results of our CCD observations are summarised in Table A1 Footnote 2 .
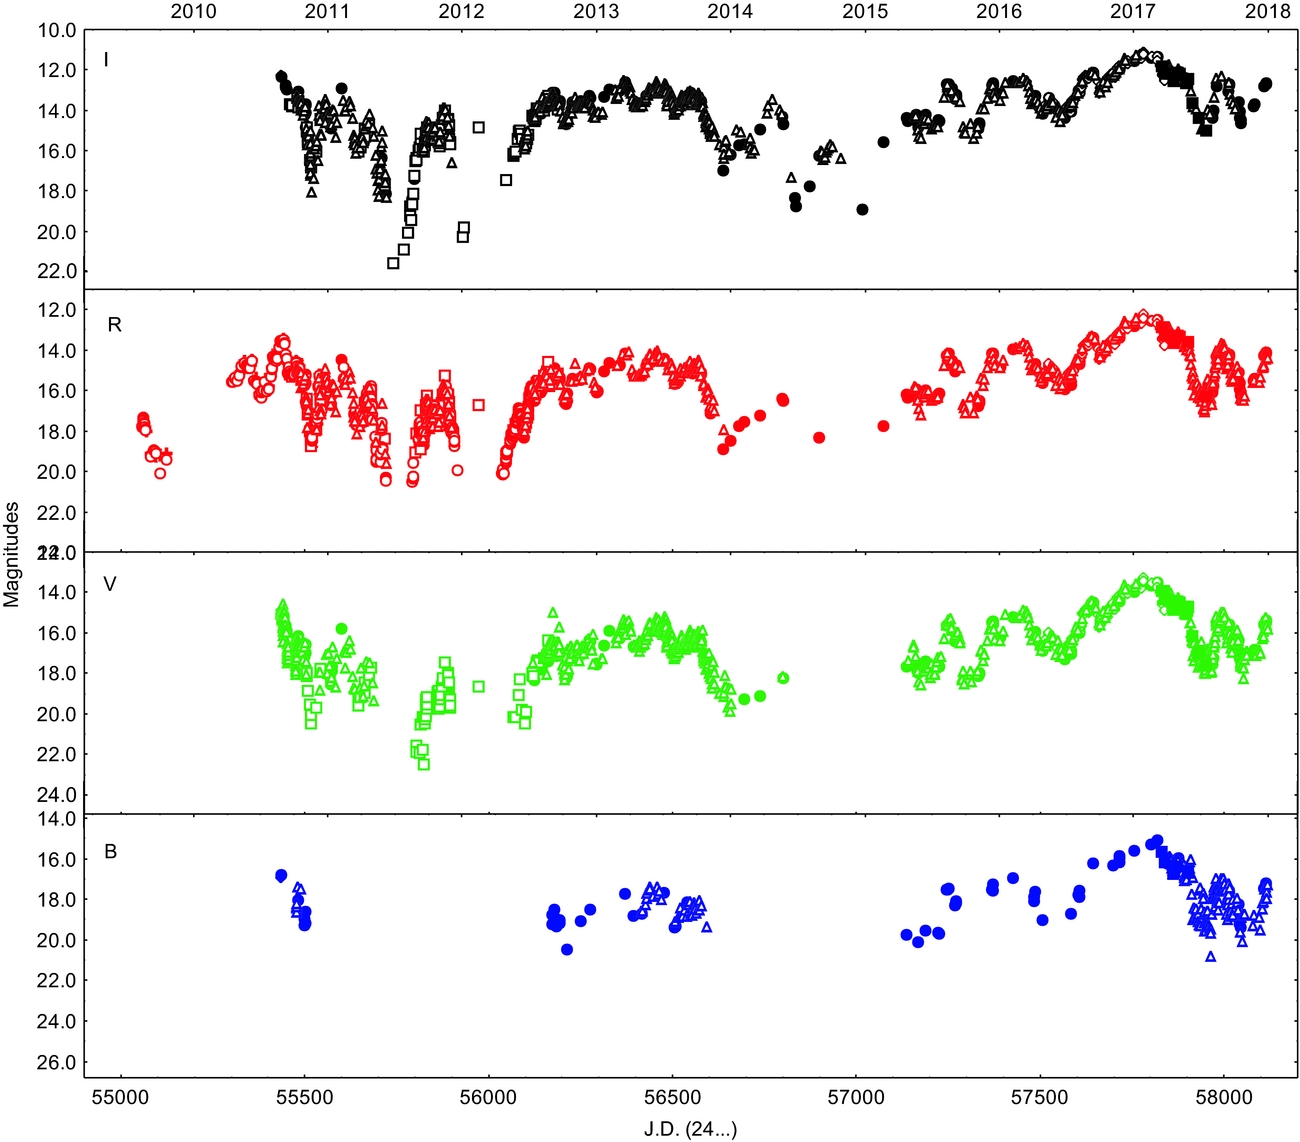
Figure 2. BVRI light curves of V2492 Cyg for the period 2010 August−2017 December. The circles denote our CCD photometric data (present paper); the empty triangles represent the data from aavso database (http://www.aavso.org); the diamonds represent the photometric data from Munari et al. (Reference Munari, Valisa, Dallaporta and Itagaki2010, Reference Munari, Traven, Dallaporta, Lorenzetti, Giannini and Antoniucci2017); the pluses denote the data from Covey et al. (Reference Covey2011); the empty squares mark the data from Kóspál et al. (Reference Kóspál2011, Reference Kóspál2013); the empty circles represent the data from Hillenbrand et al. (Reference Hillenbrand2013); the empty diamonds signify the data from Froebrich et al. (Reference Froebrich, Campbell-White, Zegmott, Billington, Makin and Donohoe2017); and the squares represent the data from Giannini et al. (Reference Giannini, Munari, Antoniucci, Lorenzetti, Arkharov, Dallaporta, Rossi and Traven2018).
It can be seen from Figure 2 that during the period 2010−2017, the object shows strong optical variability: in its light curves, multiple increases and fades are visible, which are with different amplitudes and duration. Several clearly expressed large amplitude increases and deep minima in the star’s photometric behaviour can be distinguished. Between these events, the star also shows short increases and drops in the brightness with smaller amplitudes. It should be borne in mind, however, that in a very low light the star’s brightness is under the photometric limit of the used telescopes. After 2015 February, a deep minimum in the star’s optical light curves is not observed.
Since the beginning of 2015, the brightness of V2492 Cyg began to rise, continuing to the beginning of 2017 when we registered a significant increase in its optical brightness, which seriously exceeds the maximal magnitudes registered after 2010 (reported in Ibryamov & Semkov Reference Ibryamov and Semkov2017). The measured maximal values of the star’s brightness were B = 15.11 mag, V = 13.52 mag, R = 12.51 mag, and I = 11.37 mag. After our report, Munari et al. (Reference Munari, Traven, Dallaporta, Lorenzetti, Giannini and Antoniucci2017) obtained BVRI photometry of V2492 Cyg and reported B = 15.68 mag, V = 13.93 mag, R = 12.88, and I = 11.84 mag, i.e. the object passed the recent maximum. Giannini et al. (Reference Giannini, Munari, Antoniucci, Lorenzetti, Arkharov, Dallaporta, Rossi and Traven2018) presented optical and NIR photometric and spectroscopic observations of the star, which were obtained during the peak luminosity in 2016–2017. Their combined analysis suggests that the V2492 Cyg variability is a combination of changing extinction and accretion.
An important result of our study is the change in the colour of V2492 Cyg. Using data from our BVRI photometry and the ones available in the literature, three colour–magnitude diagrams (B − V/V, V − R/V, and V − I/V) of the object are constructed and displayed in Figure 3. It can be seen that the star becomes redder when fainter in a manner consistent with the extinction. In accordance with the model of dust clumps obscuration, the observed colour of the star is produced by the scattered light from the small dust grains. Normally, the star becomes redder when its light is covered by dust clumps or filaments in the line of sight. Despite the fact that according to Kóspál et al. (Reference Kóspál2013), the geometry of the system is closer to edge-on than to pole-on, and the observed fades events with large amplitudes, the blueing effect is not seen in the figure. Most probably, the obscuration does not rise sufficiently for the scattered light to become considerable enough for us to observe the star to become bluer. In this case, the variability of V2492 Cyg is likely dominated by variable accretion, but that does not rule out the obscuration by dust clumps or filaments in the environment of the object, proof of which is the dependence colour/magnitude shown in Figure 3.
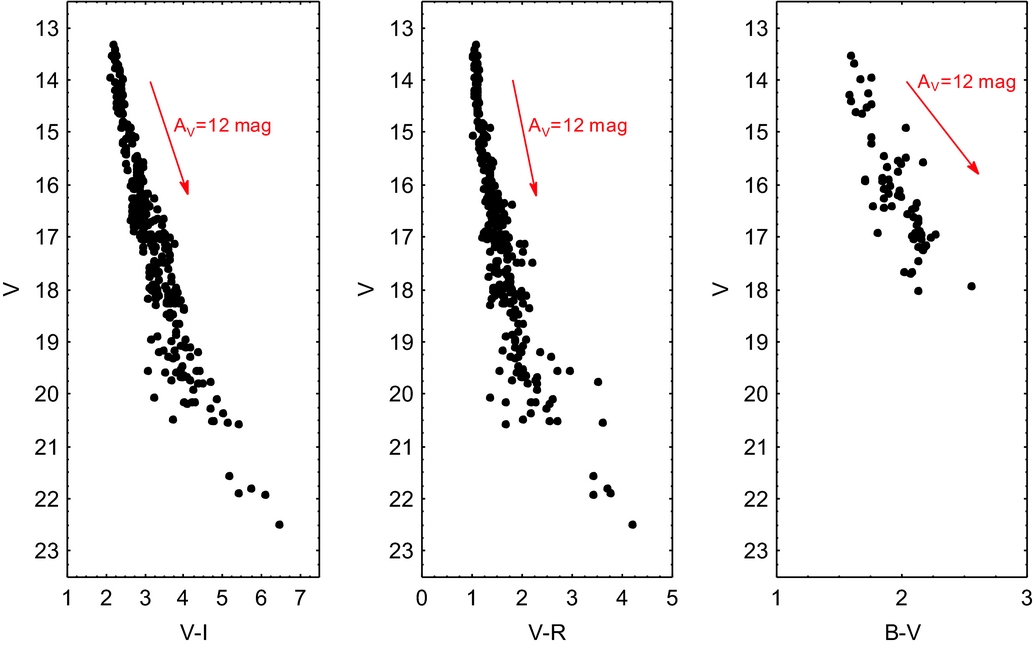
Figure 3. Colour indices V − I, V − R, and B − V versus the stellar V magnitude of V2492 Cyg. The red line shows the reddening path for A V = 12 mag according to interstellar extinction law from Schlafly & Finkbeiner (Reference Schlafly and Finkbeiner2011).
The large amplitude outburst peak of V2492 Cyg in 2010, reported by Itagaki & Yamaoka (Reference Itagaki and Yamaoka2010), can only be explained as an episode of enhanced accretion. The registered historical rise in the brightness of the object in the beginning of 2017 may be due to an increase in the accretion rate. Another possible cause is the significant decrease of the extinction from clumps of dust orbiting the star.
We used the software packages period04 (Lenz & Breger Reference Lenz and Breger2005) and persea version 2.6 (written by G. Maciejewski on the ANOVA technique; Schwarzenberg-Czerny Reference Schwarzenberg-Czerny1996) to search for periodicity in the light curves of V2492 Cyg. Initially, we used all data points to search for periodicity in the light curves of the object but we did not find any periodicity. After that, we used data points from different periods of observations for the time-series analysis. Only using the photometric data, received during the period from 2012 July to 2013 November, our time-series analysis indicates a 99-d period and led to the ephemeris:
 $$\begin{equation}
\text{JD} (\text{Max}) = 2456374.998 + 99.099 * E.
\end{equation}$$
$$\begin{equation}
\text{JD} (\text{Max}) = 2456374.998 + 99.099 * E.
\end{equation}$$
I-band folded light curve of V2492 Cyg according to the ephemeris (1) is plotted on Figure 4. False Alarm Probability (FAP) estimation was done by randomly deleting about 15% of the data about 50 times and then redetermining the period. The period and starting age determinations remained stable even when a sub-sample of about 20% of the data were removed. The obtained value for FAP is 0.02. The result of our search for periodicity confirms the period of ~100 d found by Aspin (Reference Aspin2011). The reason for not being able to find periodicity using all photometric data is probably hidden in the irrelevant mechanisms (accretion and obscuration) causing changes in the star’s brightness in the different time periods, it is also possible the periodicity of the object changes over time.
Figure 4. I-band folded light curve of V2492 Cyg.
After analysis of the collected data, our conclusion is that the photometric properties of V2492 Cyg can be explained by superposition of both: (a) variable accretion from the circumstellar disk onto the stellar surface and (b) obscuration from circumstellar clumps of dust. Both types of variability can act independently during different time periods and the result is the complicated light curve of V2492 Cyg. A similar superposition of the both types of variability (accretion and obscuration) is seen on the long-term light curve of other PMS stars—V582 Aurigae (Semkov et al. Reference Semkov, Peneva, Munari, Dennefeld, Mito, Dimitrov, Ibryamov and Stoyanov2013), V1647 Orionis (Aspin et al. Reference Aspin2009), GM Cephei (Semkov et al. Reference Semkov2015a), and V1184 Tauri (Barsunova et al. Reference Barsunova, Grinin and Sergeev2006, Semkov et al. Reference Semkov, Peneva and Ibryamov2015b).
4 CONCLUSION
We built and investigated the long-term BVRI photometric light curves of the young stellar object V2492 Cyg during the period from 2010 August to 2017 December. The photometric behaviour of the object, including extreme large amplitudes and rapid variability, can be likely explained by a superposition of both accretion and obscuration events, although their mutual proportion has not been clarified yet. We confirmed the ~100-d periodicity in the light curves of the object, but it is available only using the photometric data received during the period from 2012 July to 2013 November.
For determining the exact nature of V2492 Cyg further multicolour photometric and spectral observations are of great importance. We plan to continue our photometric monitoring of the object during the next years.
ACKNOWLEDGEMENTS
This research has made use of the NASA’s Astrophysics Data System. The authors thank the Director of Skinakas Observatory Prof I. Papamastorakis and Prof I. Papadakis for the award of telescope time. We acknowledge with thanks the variable star observations from the aavso International Database contributed by observers worldwide used in this research. This work was partly supported by the Bulgarian Scientific Research Fund of the Ministry of Education and Science under the grants DM 08-2/2016, DN 08-1/2016, DN 08-20/2016, and DN 18-13/2017, as well as by the Scientific Research Fund of the University of Shumen. We thank the anonymous referee for carefully reading the text and for the useful suggestions and comments that helped to improve the paper.
A BVRI-BANDS CCD PHOTOMETRY OF V2492 CYGNI
Table A1. BVRI-bands CCD photometry of V2492 Cyg.