


Introduction
The history of gold catalysis has several milestones. Regarded as catalytically inactive for a very long time, the first catalytic activity of gold (Au) was reported using nanoparticles (NPs) (Haruta et al., Reference Haruta, Kobayashi, Sano and Yamada1987). Significant progress was achieved at the beginning of this century by the discovery of catalytic activity of nanoporous gold (Zielasek et al., Reference Zielasek, Jürgens, Schulz, Biener, Biener, Hamza and Bäumer2006; Xu et al., Reference Xu, Su, Xu, Liu, Zhao, Tian and Ding2007), which was prepared by dealloying of Au-based master alloys such as silver-gold (AgAu) or copper-gold (CuAu). The dealloying process results in an open porous structure built-up of ligaments and pores, which is penetrable for gases and liquids, making it a designated catalyst material. In many works, nanoporous gold was investigated in terms of its structure (Pickering & Swann, Reference Pickering and Swann1963; Forty, Reference Forty1979; Rösner et al., Reference Rösner, Parida, Kramer, Volkert and Weissmüller2007; Fujita et al., Reference Fujita, Qian, Inoke, Erlebacher and Chen2008, Reference Fujita, Guan, McKenna, Lang, Hirata, Zhang, Tokunaga, Arai, Yamamoto, Tanaka, Ishikawa, Asao, Yamamoto, Erlebacher and Chen2012), chemical composition (i.e. spatial distribution of the residual less noble metal) (El-Zoka et al., Reference El-Zoka, Langelier, Botton and Newman2017; Krekeler et al., Reference Krekeler, Straßer, Graf, Wang, Hartig, Ritter and Weissmüller2017; Mahr et al., Reference Mahr, Kundu, Lackmann, Zanaga, Thiel, Schowalter, Schwan, Bals, Wittstock and Rosenauer2017), and numerous applications as catalyst, actuator, or sensor (Zhang et al., Reference Zhang, Liu, Ma and Ding2007; Biener et al., Reference Biener, Wittstock, Zepeda-Ruiz, Biener, Zielasek, Kramer, Viswanath, Weissmüller, Bäumer and Hamza2009; Jin & Weissmüller, Reference Jin and Weissmüller2010; Wittstock et al., Reference Wittstock, Zielasek, Biener, Friend and Bäumer2010, Reference Wittstock, Biener, Erlebacher and Bäumer2012; Stenner et al., Reference Stenner, Shao, Mameka and Weissmüller2016).
The combination of the advantages of nanoporous gold, such as stability and a tunable structure, with the advantages of NPs, having a larger specific surface area and thus a more effective availability of exposed noble metal surface atoms, has a huge potential to allow further tailoring and engineering of the catalytic properties of gold. This combination can be realized by dealloying of alloy NPs. Although corrosion of bulk alloys is well characterized, corrosion of NPs shows some important differences (McCue et al., Reference McCue, Snyder, Li, Chen, Sieradzki and Erlebacher2012; Li et al., Reference Li, Chen, McCue, Snyder, Crozier, Erlebacher and Sieradzki2014). It was found that a certain particle size of 12–24 nm is required for the formation of pores (Li et al., Reference Li, Chen, McCue, Snyder, Crozier, Erlebacher and Sieradzki2014). A critical particle size for the pore evolution has also been reported for nickel–platinum (NiPt), platinum–copper (PtCu), or platinum–cobalt (PtCo) NPs (Oezaslan et al., Reference Oezaslan, Heggen and Strasser2012c; Snyder et al., Reference Snyder, McCue, Livi and Erlebacher2012). Below this threshold core–shell structures form with a core enriched in the less noble metal and a shell rich in the noble metal. A further result of AgAu NP corrosion is that although a significant amount of Ag is removed, particles become only slightly smaller (Rurainsky et al., Reference Rurainsky, Manjón, Hiege, Chen, Scheu and Tschulik2020).
Apart from the catalytic properties, porous Au-rich NPs have recently been seen to show unique surface plasmon resonance properties in surface-enhanced Raman spectroscopy with high efficiency (Huang et al., Reference Huang, Hao, Nyagilo, Dave, Xu and Sun2010; Zhang et al., Reference Zhang, Large, Nordlander and Wang2014; Hu et al., Reference Hu, Jiang, Zhang, Guo, Wang and Wang2018), which had hindered the wide application of this surface-sensitive technique so far.
Whereas the three-dimensional structure of bulk nanoporous gold was investigated (Rösner et al., Reference Rösner, Parida, Kramer, Volkert and Weissmüller2007; Fujita et al., Reference Fujita, Guan, McKenna, Lang, Hirata, Zhang, Tokunaga, Arai, Yamamoto, Tanaka, Ishikawa, Asao, Yamamoto, Erlebacher and Chen2012),less structural information about porous NPs can be found in literature. This investigation is important as, for example, the structure of the pore space affects mass transport properties and hence the catalytic performance of porous NPs. Furthermore, reconstructions allow for an extraction of key morphological parameters, such as porosity, specific surface area, and tortuosity. These can then be used as input for simulations of diffusion or flow, mass, and charge transport within the sample (Tallarek et al., Reference Tallarek, Hlushkou, Rybka and Höltzel2019).
Several methods can be used for three-dimensional reconstructions. Whereas scanning electron microscopy-based methods are used for reconstructions of large porous sample volumes (see, e.g., Müllner et al., Reference Müllner, Zankel, Svec and Tallarek2014, Reference Müllner, Zankel, Lv, Svec, Höltzel and Tallarek2015), the highest spatial resolution is provided by scanning transmission electron microscopy (STEM) tomography (Midgley & Weyland, Reference Midgley and Weyland2003). As STEM tomography provides a field of view which is sufficiently large to investigate particles with diameters smaller than 300 nm, it is also a suitable tool to obtain three-dimensional high-resolution reconstructions of porous NPs.
In this report, the structure of porous NPs is investigated by STEM tomography. Results include an analysis of chord length distributions (CLDs) (Lu & Torquato, Reference Lu and Torquato1993; Torquato, Reference Torquato2005; Courtois et al., Reference Courtois, Szumski, Georgsson and Irgum2007), porosity, specific surface area, and tortuosity. A comparison with values obtained for bulk nanoporous gold is provided in the section “Discussion”, and key results are summed up in the section “Conclusion”.
Materials and Methods
Nanoparticle Synthesis and Dealloying
Wet impregnation route was used for the synthesis of carbon black-supported Ag $_{77}$Au $_{23}$ NPs with diameters of $( 77\pm 26)$ nm according to a slightly modified protocol of Oezaslan et al. (Reference Oezaslan, Hasché and Strasser2012a, Reference Oezaslan, Hasché and Strasser2012). About 27 mg of AgNO $_3$ ( $\geq$99.9%, p.a., Ultra Quality; Roth, Germany) were dissolved in 2 mL of purified water and added to 205 mg of carbon-supported Au NPs (5 wt%; STREM Chemicals, Inc., USA). The dispersion was horn-sonicated for 5 min and then frozen in liquid nitrogen for 15 min to freeze-dry in vacuum for 3 days. Afterwards, the black powder was thermally annealed in 5 vol% H $_2$/95 vol% Ar atmosphere (5.0, Air Liquid, Germany) with a flow rate of 140 NmL/min. The temperature program consisted of two holding temperatures, 2 h at $250^{\circ } {\rm C}$ and then 8 h at $800^{\circ } {\rm C}$, with a temperature ramp of $10^{\circ }$C/min in between. Afterwards, the oven was opened to quench the annealing process.
Electrochemical dealloying was carried out in a thin-film rotating disk electrode set-up equipped with a rotator (PINE Research Instruments, USA), a self-made electrochemical three-compartment glass cell, and a SP-300 potentiostat (BioLogic, France). The thin catalyst film was prepared by dispersion of 4 mg of carbon-supported Ag $_{77}$Au $_{23}$ NPs in 600 $\mu$L of a 1:1 mixture of purified water and 2-propanol (HPLC grade; VWR, Germany). About 10 $\mu$L of the catalyst ink were drop-coated onto a previously polished and cleaned glassy carbon (GC) electrode (outer diameter of 5 mm, PINE Research Instruments, USA) and dried for 20 min at $40^{\circ } {\rm C}$ in air, resulting in a theoretical metal loading of 41 $\mu {\rm g/cm}^{2}_{{\rm geo.}}$ (theoretical gold loading of $16\, \mu {\rm g/cm}^{2}_{{\rm geo.}}$). The catalyst-coated GC electrode served as a working electrode in the three-electrode configuration including a Pt mesh as a counter electrode and a mercury–mercury sulfate as a reference electrode.
Ag $_{77}$Au $_{23}$ NPs were electrochemically dealloyed using cyclic voltammetry (CV) in Ar-saturated 0.1 M HClO $_4$ at room temperature. The electrolyte solution was prepared by dilution of 70% HClO $_4$ (99.999% trace metal basis, Sigma Aldrich, Germany). The dealloying protocol consisted of 16 potential cycles between 0.2 and 1.3 V versus RHE (reversible hydrogen electrode) followed by four additional cycles without rotation to record electrochemical features of polycrystalline pure Au surfaces in the range of 0.2–1.6 V versus RHE. All cycles were performed with a scan rate of 20 mV/s.
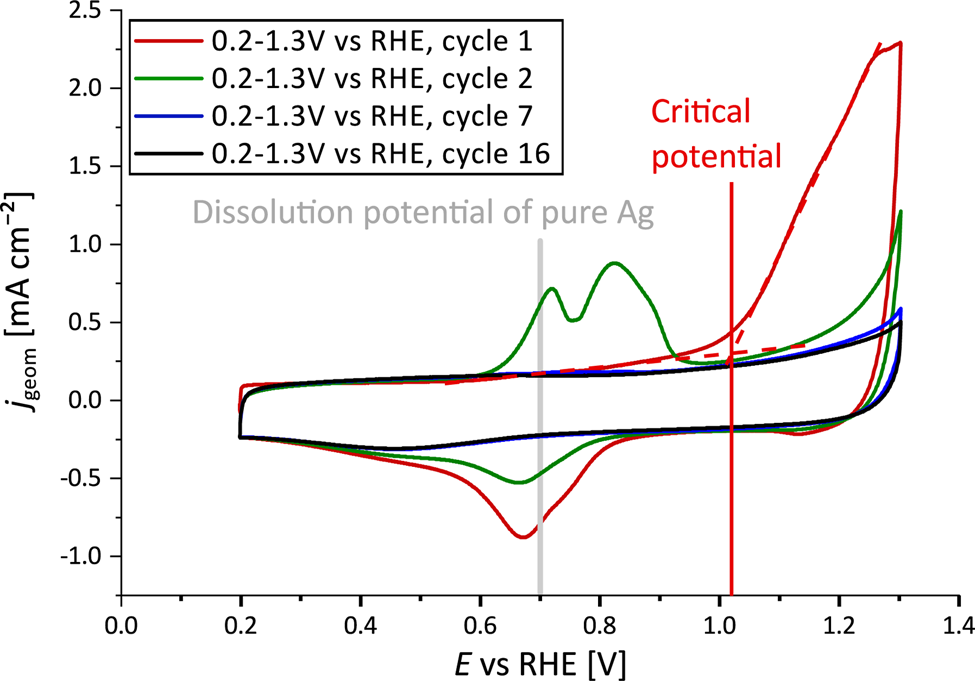
The dealloying process is illustrated in Figure 1. In the first cycle (red line), the dissolution current peak of Ag from the alloy NP surface is observed at a critical potential of  $\sim$1.02 V versus RHE. The backward scan shows a very broad current peak with maximum at a potential of 0.67 V versus RHE, indicating the re-deposition of dissolved Ag species from the electrolyte. Therefore, in the second CV profile (green line), two anodic current peaks appear at 0.72 and 0.82 V versus RHE, signifying the additional dissolution process of Ag from different compositional surface environments. Both the dissolution as well as the re-deposition peaks vanish with longer potential cycling during the dealloying process. After at least seven potential cycles (blue line), a steady-state CV profile was reached.

Fig. 1. CV profiles of initial Ag $_{77}$Au $_{23}$ NPs during the dealloying process in a potential range between $E = 0.2$ V and $E = 1.3$ V against RHE in Ar-saturated 0.1 M HClO $_{4}$ showing the first cycles in red and green. The electrochemical dealloying is mainly completed after at least seven cycles (blue line), where a steady-state CV profile was achieved.
The dealloyed thin film was re-dispersed in 50  $\mu$L of 2-propanol and transferred onto a Lacey Carbon TEM grid (LC400-Cu; Electron Microscopy Sciences, USA) using a micropipette.
Tomography
STEM tomography measurements were performed on an FEI Titan 80/300 TEM/STEM microscope operated in a STEM mode at an acceleration voltage of 300 kV. STEM images with frame times of 30 s were acquired using a Fischione Model 3000 high-angle annular dark field (HAADF) detector. Optimal imaging conditions for a microscope without probe correction were used according to a semi-convergence angle of 9 mrad, detector collection angle range between 36 mrad and approximately 230 mrad, and a camera length of 196 mm. Energy-dispersive X-ray spectrometry (EDXS) was measured with an EDAX spectrometer (TOPS 30 OST 1365), which is attached to the microscope. For the tomography tilt series, 99 projections in a range from  $-70^{\circ }$ to $+ 70{{}^{\circ }}$ were acquired using a Saxton scheme (Saxton et al., Reference Saxton, Baumeister and Hahn1984). Projections were coarsely aligned using cross-correlations. For reconstruction, the ASTRA toolbox (Palenstijn et al., Reference Palenstijn, Batenburg and Sijbers2011; van Aarle et al., Reference van Aarle, Palenstijn, Beenhouwer, Altantzis, Bals, Batenburg and Sijbers2015, Reference van Aarle, Palenstijn, Cant, Janssens, Bleichrodt, Dabravolski, Beenhouwer, Batenburg and Sijbers2016) was used, applying the simultaneous iterative reconstruction technique (SIRT) (Gilbert, Reference Gilbert1972). After 1,000 initial SIRT iterations, projection images and tilt angles were re-aligned following the protocol of Goris et al. (Reference Goris, De Beenhouwer, De Backer, Zanaga, Batenburg, Sánchez-Iglesias, Liz-Marzán, Van Aert, Bals, Sijbers and Van Tendeloo2015) minimizing differences between measured projections and calculated projections. This re-alignment procedure was repeated 12 times with 1,000 SIRT iterations in between. Final reconstructions were obtained after 12,000 further SIRT iterations. After application of a soft Gaussian filter to remove artifacts, reconstructions were segmented manually using threshold values to distinguish between material and vacuum. We varied the threshold value and the width of the Gaussian filter manually to find a reconstruction that avoids both, additional artificial noise particles (too low threshold, too narrow filter) and artificially removed parts of the true particle (too high threshold, too broad filter). Reconstructions with slightly lower/higher threshold and filter values than the optimal values were used to estimate margins of error of quantitative evaluations. The three evaluated reconstructions have voxel sizes of $224^{3}$ pm $^{3}$, $211^{3}$ pm $^{3}$ and $652^{3}$ pm $^{3}$ for representative particles I, II and III, respectively. All evaluations outside of the ASTRA toolbox were performed using MATLAB.
Results
In this section, the three-dimensional structure of electrochemically dealloyed Au-rich NPs is characterized in detail.
Structure of Dealloyed Au-rich NPs
Structures of dealloyed Au-rich NPs are shown in Figure 2 by six representative STEM micrographs. After dealloying, particles have a porous structure, which is similar to that of bulk nanoporous gold samples (Erlebacher et al., Reference Erlebacher, Aziz, Karma, Dimitrov and Sieradzki2001; Fujita et al., Reference Fujita, Qian, Inoke, Erlebacher and Chen2008). It is an interconnected structure of material, the so-called ligaments, and open pores. In contrast to bulk nanoporous gold, porous NPs show different kinds of structures. Whereas structures of NPs in Figures 2a–2c resemble the structure of bulk nanoporous gold samples, structures of particles in Figure 2e and the lower part of Figure 2f seem to be more dense or compact. In Figure 2d connected particles with different structure types can be seen in close proximity. This observation can be explained by particle migration on the carbon support material during electrochemical experiments. As STEM images provide only two-dimensional projections, it cannot be excluded that the observation of different types is only a projection artifact. However, three-dimensional measurements as provided in the following sections confirm that structures are different indeed. Possible reasons for the different structures are discussed in Section “Discussion”.
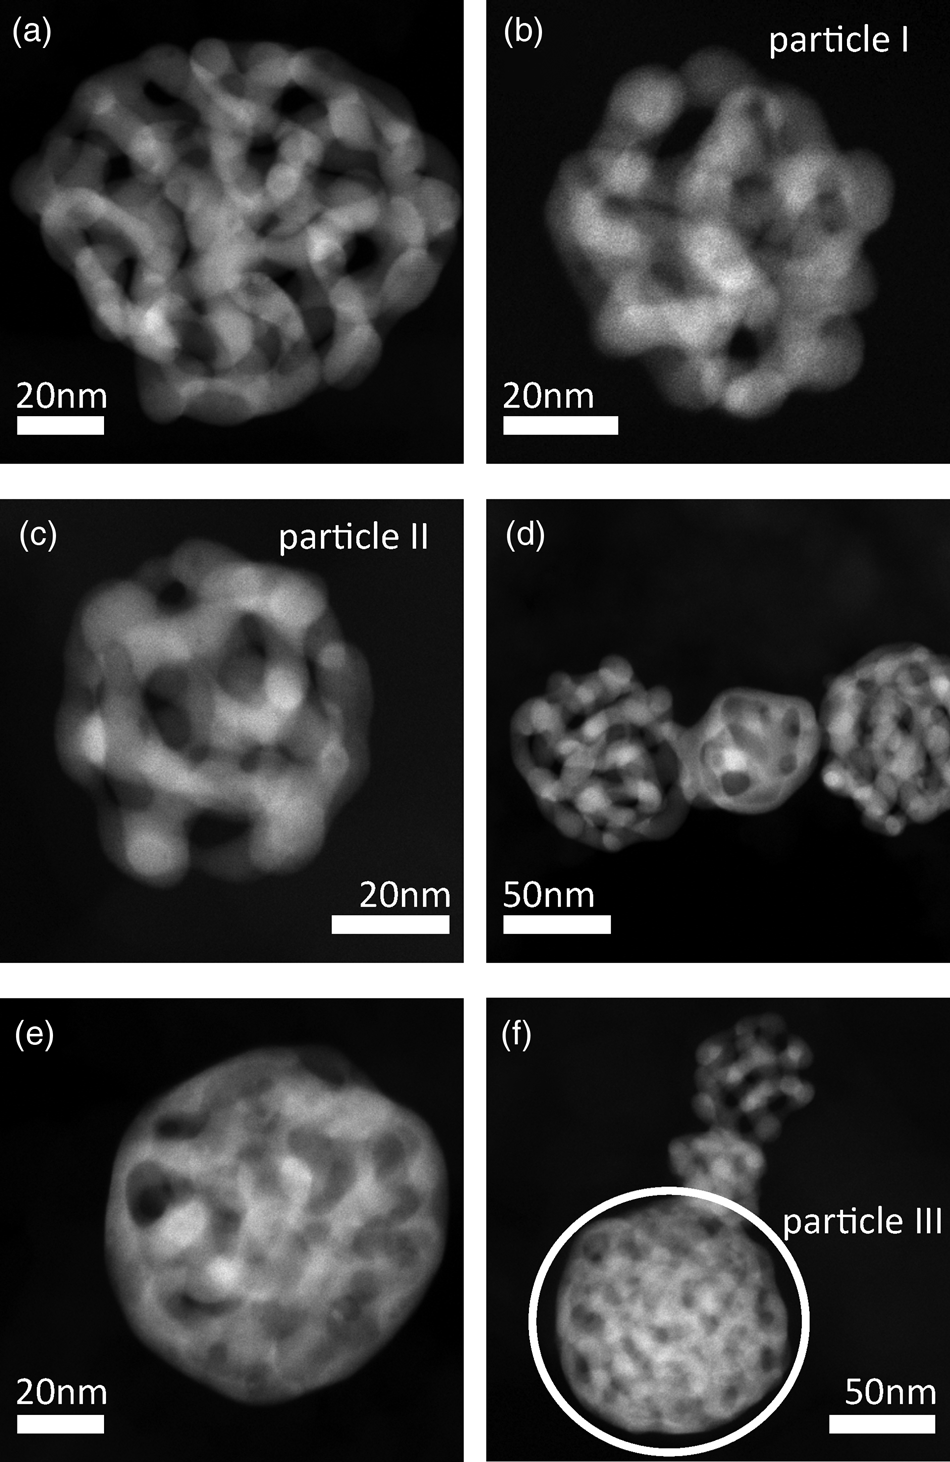
Fig. 2. Representative STEM images of porous Au-rich NPs prepared by dealloying of Ag $_{77}$Au $_{23}$ NPs with initial diameters of $( 77\pm 26)$ nm. Particles have various structures. Structures of particles I, II and III in (b), (c) and (f), respectively were reconstructed in 3D, for particle III only the region indicated by a white circle was evaluated quantitatively.
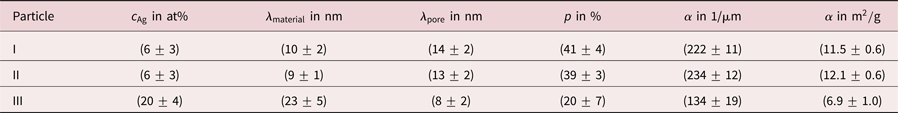
Apart from optical differences, the average residual Ag concentration of  $c_{{\rm Ag}} = ( 6\pm 3)$ at% within NPs similar to those in Figures 2a–2c is significantly lower compared to the Ag content of $c_{{\rm Ag}} = ( 20\pm 4)$ at% within NPs similar to the particle in Figure 2e. The composition was determined by EDXS, errors represent the largest deviations of measured average Ag contents by investigating several NPs with a similar structure type. Diameters of NPs were measured as $( 60\pm 30)$ nm, the error represents the standard deviation evaluating more than 120 particles.
Three particles shown in Figures 2b, 2c, and 2f were selected for a three-dimensional reconstruction. STEM tomography reconstructions of particle I and particle II are shown in Figure 3, a reconstruction particle III is shown in Figure 6a. The structure of interconnected ligaments and open pores can clearly be seen. Animated views of these reconstructions are provided in the supplemental information.
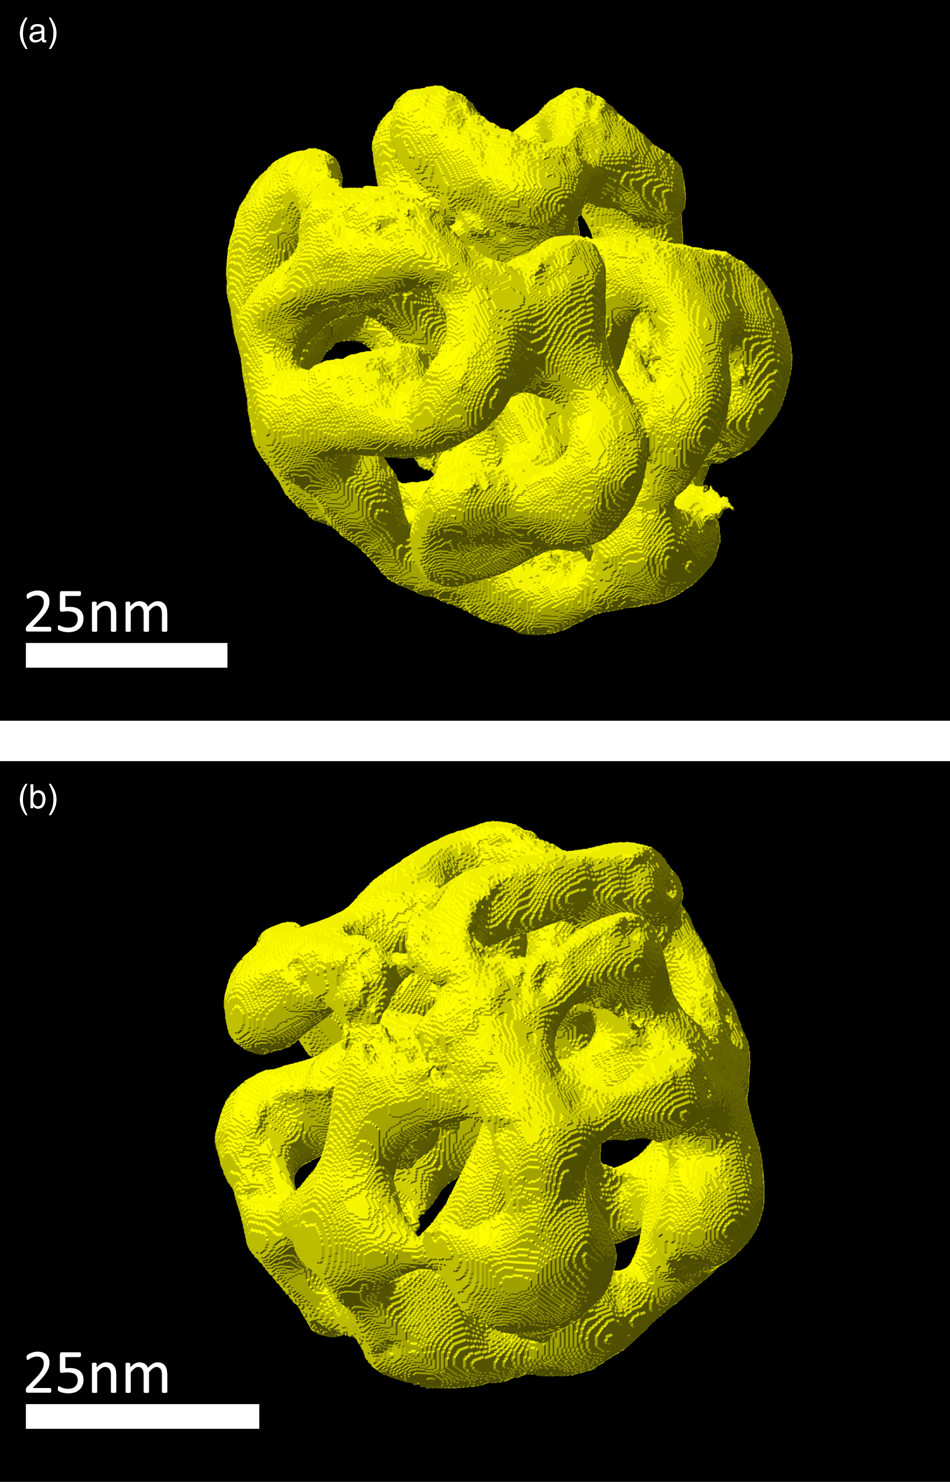
Fig. 3. Three-dimensional STEM tomography reconstruction of porous NPs prepared by dealloying. (a) Particle I, (b) particle II.
CLDs of Ligaments and Pores
In this report, CLDs (Lu & Torquato, Reference Lu and Torquato1993; Torquato, Reference Torquato2005; Courtois et al., Reference Courtois, Szumski, Georgsson and Irgum2007) were used to determine sizes of ligaments and pores. For this well-established statistical analysis method no assumptions of pore or material geometry are needed and a manual measurement of ligament or pore sizes can be avoided. A large number (10 million for the analysis provided here) of straight lines were positioned arbitrarily within the reconstructed volume as illustrated in Figure 4a exemplary for particle I. Parts of these lines that intersect material are marked in yellow, parts outside of the material are drawn in blue. In this manner, lines are subdivided in so-called chords within the material and chords within the hollow pores. Figure 4b shows a slice of the reconstruction volume, in which it can be seen more clearly that some chords are material chords (yellow) and some chords are pore chords (blue). All blue chords that reach the edge of the reconstruction box are excluded from the further evaluation as they do not describe the pore structure of the NP.
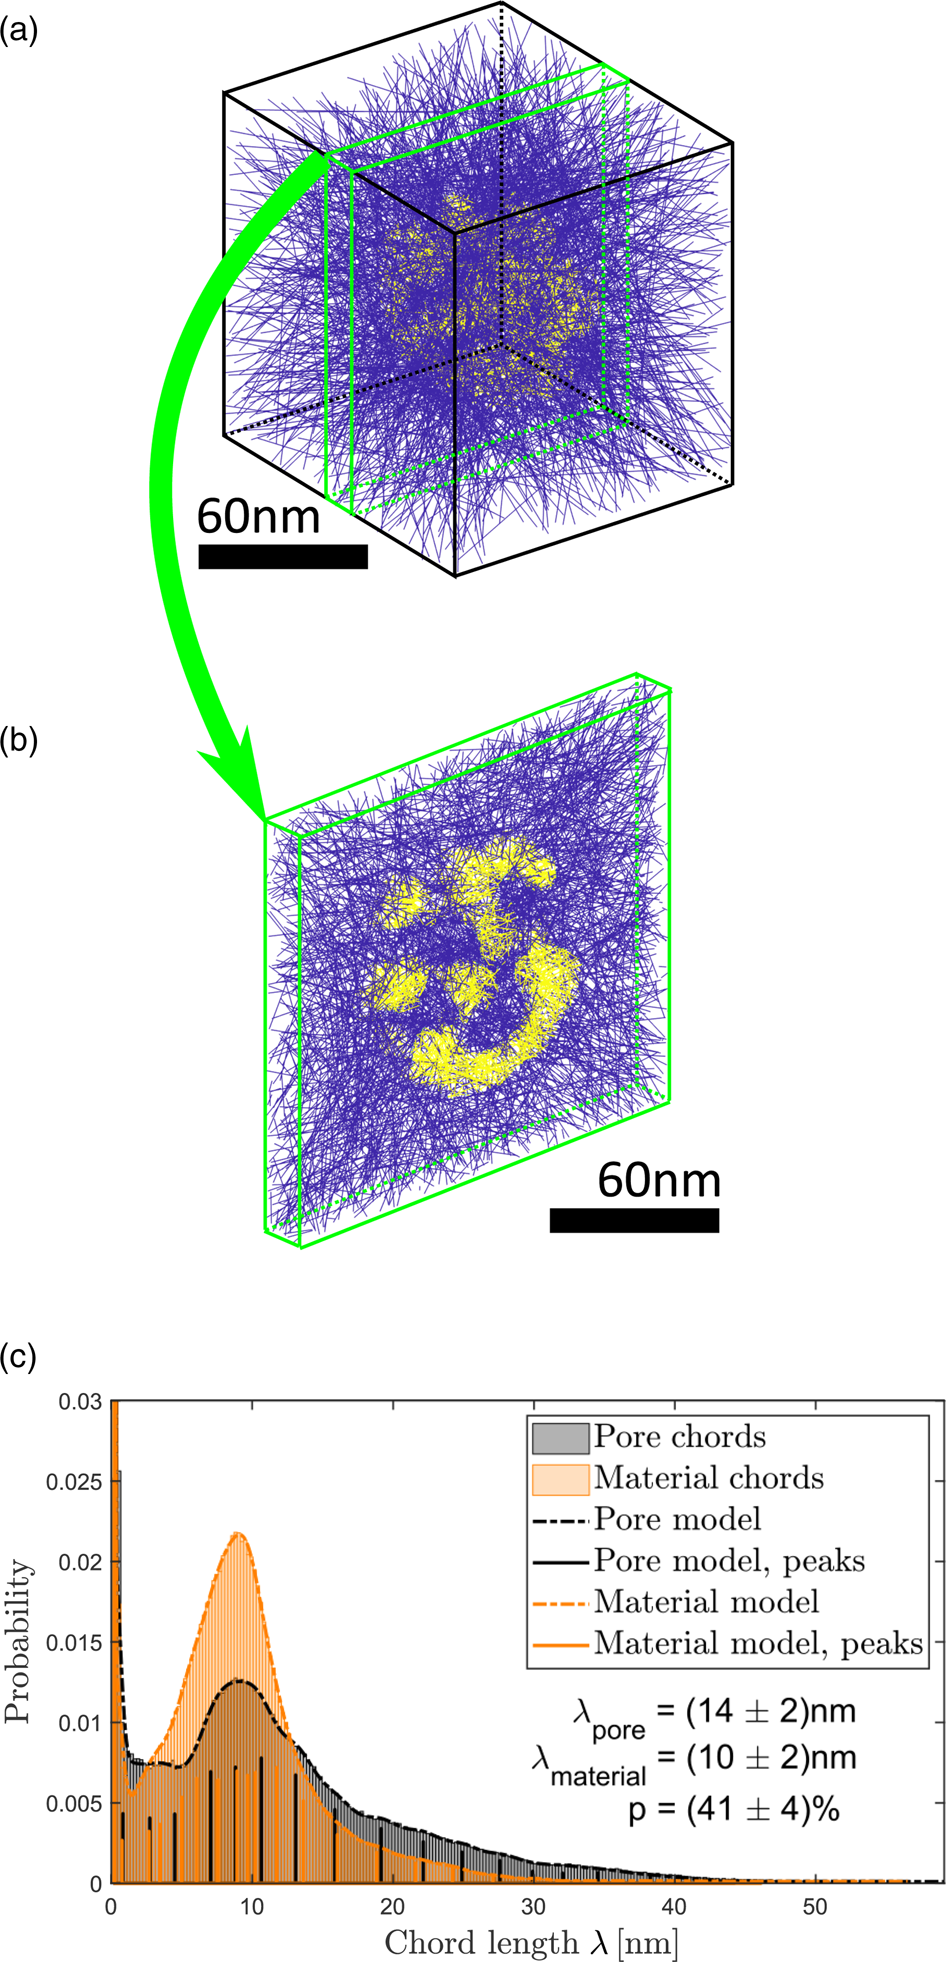
Fig. 4. Determination of ligament and pore sizes in particle I. (a) Arbitrarily positioned lines within the reconstructed volume. Parts of lines (chords) within the particle are marked in yellow, chords within vacuum are marked in blue. (b) Slice of the volume shown in (a). (c) CLDs of material (orange) and pore chords (black). Both distributions are fitted (dashed curves) by sums of Gaussian functions. The positions and heights of Gaussian functions are marked by solid vertical lines.
The quantitative evaluation is presented in Figure 4c. The CLD for the material is colored orange, the CLD for the pores is colored black. Fitting of established models (Torquato, Reference Torquato2005) to the distributions for a further quantitative evaluation failed, because the present CLDs of small particle volumes have a detailed fine structure. Instead of that, it was decided to model distributions with sums of Gaussian functions. The idea behind this is that each Gaussian could be interpreted as the contribution of one ligament (or pore) to the probability distribution. The fitted models are shown in Figure 4c as dashed lines. Positions, heights and widths of Gaussian functions were determined using statistical parameter estimation and the numbers of statistically relevant Gaussian functions were determined using order selection criteria (McLachlan & Peel, Reference McLachlan and Peel2000; Backer et al., Reference Backer, Martinez, Rosenauer and Aert2013). The result obtained is independent of the choice of bins in the histogram. Positions and heights of Gaussian functions are represented by vertical solid lines in Figure 4c.
Pronounced peaks appear at the left border of the CLDs. These peaks stem from lines that are almost parallel to interfaces between material and pore. As the reconstruction consists of discrete voxels, a line almost parallel to the interface intersects voxel per voxel alternating material and pore. This results in many chords with lengths of one or two voxels and hence in a sharp peak in the CLD. Its height and width depend on the smoothness of the surface and hence on the reconstruction and not on the particle itself. For this reason, only positions of all Gaussians, that do not contribute to the artifactpeaks, were averaged weighted with their corresponding peak height to calculate average material and pore chord lengths  $\lambda$.
For particle I, the average chord lengths of pore and material were determined to  $\lambda _{{\rm pore}} = ( 14\pm 2)$ nm and $\lambda _{{\rm material}} = ( 10\pm 2)$ nm, respectively. Errors represent largest deviations of $\lambda$ obtained using different reasonable segmentation threshold values (see Section “Tomography”), they do not represent standard deviations of measured chord lengths. Deviations caused by the missing wedge are smaller than the influence of the threshold value and are hence included in the margins of error. A comparison with values obtained for bulk nanoporous gold is provided in Section “Discussion”.
CLDs for particle II and III are shown in Figure 5, results are concluded in Table 1. For particle III, only that part of the reconstruction was evaluated quantitatively that is indicated in Figure 2f by a white circle. The comparison reveals that particles I and II have ligaments that are smaller by a factor of more than two compared to particle III, whereas pore sizes are smaller for particle III. This is a quantitative confirmation that dealloyed Au-rich NPs have various kinds of structures. Furthermore, it can be seen that shapes of material and pore CLDs are different, indicating different morphologies of material and pore space.
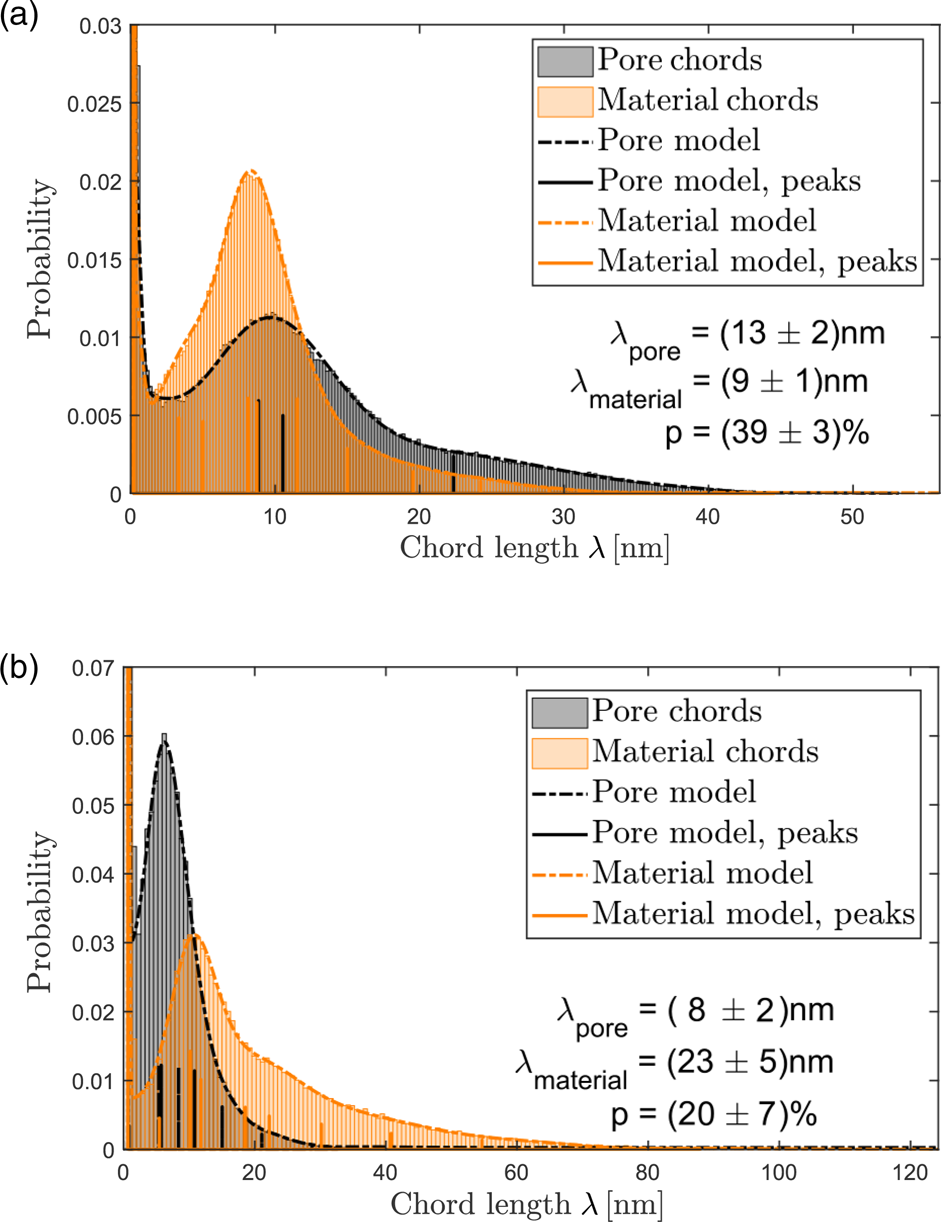
Fig. 5. Determination of ligament and pore sizes in particle II (a) and particle III (b). Probability distributions of material (orange) and pore chords (black). Both distributions are fitted (dashed lines) by sums of Gaussian functions, positions and heights of Gaussian functions are marked by solid vertical lines.
Table 1. Summary of residual Ag concentrations  $c_{{\rm Ag}}$, chord lengths $\lambda$, porosities $p$ and specific surface areas $\alpha$ for three investigated porous Au-rich nanoparticles.

Porosity and Specific Surface Area
Evaluating chord lengths, also porosities  $p$ of porous NPs can be determined. More precisely, the porosity is obtained as sum of all pore chord lengths divided by the sum of all material and pore chord lengths (excluding pore chords outside of the particle). Values of $p = ( 41\pm 4) \percnt$ and $p = ( 39\pm 3) \percnt$ were determined for particle I and particle II. For particle III a porosity of $p = ( 20\pm 7) \percnt$ was measured, a value that is lower by a factor of two.
This is also reflected by evaluation of the specific surface area  $\alpha$, which is defined as surface per volume. The volume includes solid material and hollow pore space of the porous particle here in agreement with other works (Rösner et al., Reference Rösner, Parida, Kramer, Volkert and Weissmüller2007). For particles I and II specific surface areas of $\alpha = ( 222\pm 11) 1/\mu {\rm m}$ and $\alpha = ( 234\pm 12) 1/\mu {\rm m}$ were measured, whereas for particle III a lower value of $\alpha = ( 134\pm 19) 1/\mu {\rm m}$ was found. Values are converted to units of m $^{2}$/g in Table 1 assuming pure Au particles. Hence, dealloyed NPs with a lower Ag content show a higher porosity and a larger specific surface area than dealloyed NPs with a higher Ag content. These results are concluded in Table 1.
Tortuosity
Tortuosity describes an effective elongation of a path between two points through a porous medium compared to the direct connection between these points. In this report, two approximations are used (Reich et al., Reference Reich, Svidrytski, Hlushkou, Stoeckel, Kübel, Höltzel and Tallarek2018). The first approximation is the branch tortuosity  $\tau _{{\rm branch}}$. For this measurement reconstructions were skeletonized (Lee et al., Reference Lee, Kashyap and Chu1994; Kerschnitzki et al., Reference Kerschnitzki, Kollmannsberger, Burghammer, Duda, Weinkamer, Wagermaier and Fratzl2013) as illustrated in Figure 6. Evaluating the reconstruction (a) of particle III, the skeleton of the material (b) and the skeleton of the pores (c) were obtained. The $z$-positions of the skeleton points are color-coded to better visualize the 3D structure. Branch and end points are marked by red and green circles, respectively. The branch tortuosity is defined as
 $$\tau_{{\rm branch}} = {1\over n}\sum_{i = 1}^{n} {d_{{\rm branch}, i}\over d_{{\rm euclid}, i}} ,\; $$
where  $d_{{\rm branch}, i}$ is the distance between two branch points along the skeleton, $d_{{\rm euclid}, i}$ is the direct distance between these points and $n$ is the total number of different distances between all branch points. The second approximation is the geometric tortuosity $\tau _{{\rm geom}}$:
 $$\tau_{{\rm geom}} = \lim_{d_{{\rm geod}} \rightarrow \infty} {d_{{\rm geod}}\over d_{{\rm euclid}}} ,\; $$
where  $d_{{\rm geod}}$ is the shortest distance between two points without crossing interfaces between material and pore and $d_{{\rm euclid}}$ is the direct distance between these two points.

Fig. 6. 3D structure analysis of a dealloyed porous nanoparticle (particle III). (a) STEM tomography reconstruction. (b) Skeleton representation of the material. (c) Skeleton representation of the pores. Red and green points in (b) and (c) represent branch and end points of the skeleton, respectively, the  $z$-position of skeleton points is colour-coded.
The problem with equation (2) is the limit towards infinity. As the reconstructed particles have diameters smaller than 300 nm (two of them are even smaller than 100 nm), this is certainly not enough to consider large distances. For this reason, geometric tortuosities as determined in this report can be understood only as an approximation. To estimate  $\tau _{{\rm geom}}$ for the material (pores) a random point within material (pore) space was selected. Subsequently, distances $d_{{\rm geod}}$ and $d_{{\rm euclid}}$ towards all other points within the material (pore) space were calculated. For the material space of particle I these are more than five million distances. For all these distances the ratio $d_{{\rm geod}}/d_{{\rm euclid}}$ was calculated and plotted versus $d_{{\rm geod}}$. This is illustrated in Figure 7a. More than five million data points are shown in this plot. The procedure was repeated for a second and a third random point within the material (pore) space. For material space this is illustrated in Figure 7b in orange and yellow color. Finally, hundred points were chosen randomly for each evaluation shown in this report and only the largest distances $d_{{\rm geod}}$ were considered. The result is depicted in Figure 7c. As expected a limit value for large $d_{{\rm geod}}$ can only be estimated. In this report, this was done manually as illustrated by two black dotted lines and a green double-arrow, revealing a geometric tortuosity of $\tau _{{\rm geom}}\approx 1.3\pm 0.3$ for the material space of particle I. $\tau _{{\rm geom}}$ for the pore space was estimated in an analogous manner choosing random points within pore space and ignoring vacuum outside of the particle.
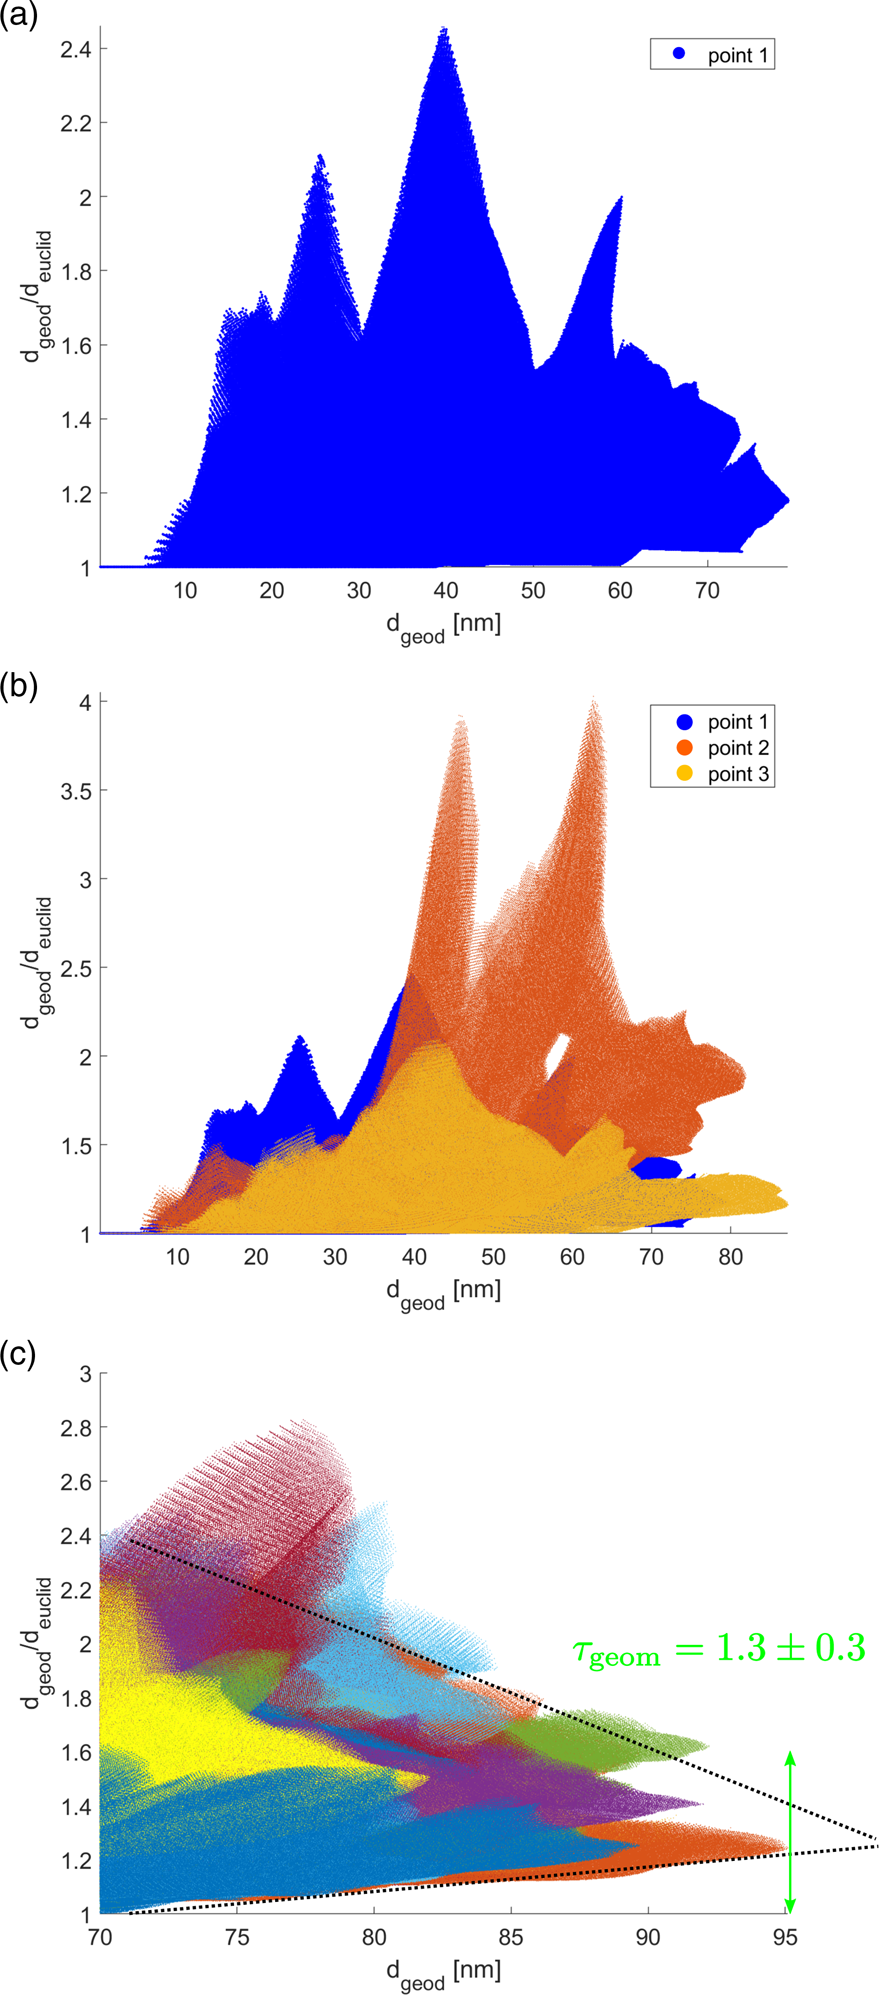
Fig. 7. Estimation of geometric tortuosity. (a) For one random point within the material space, distances to all five million other points within the material space are calculated without crossing material-pore interfaces ( $d_{{\rm geod}}$) and considering a straight line ( $d_{{\rm euclid}}$). The ratio $d_{{\rm geod}}/d_{{\rm euclid}}$ is plotted for all five million distances. (b) This procedure is repeated for a second (orange color) and a third (yellow) random point within the material space. (c) Evaluation of 100 random points considering large values of $d_{{\rm geod}}$ from which the geometric tortuosity $\tau _{{\rm geom}}$ is estimated manually.
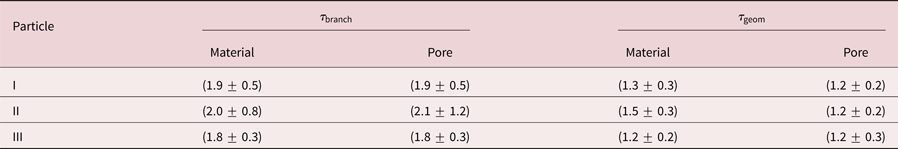
Results are concluded in Table 2. Firstly,  $\tau _{{\rm geom}}$ is smaller than $\tau _{{\rm branch}}$ for all particles, which follows directly from their definition. Secondly, material tortuosities and pore tortuosities are equal for the individual particles. This result is valid for the branch as well as for the geometric tortuosity. And thirdly, the tortuosity is within error bars independent of the particle, which is surprising as the porosity and the Ag content are significantly different for the three investigated particles. The branch tortuosity is $\tau _{{\rm branch}}\approx 1.9$, while the geometric tortuosity is $\tau _{{\rm geom}} \approx 1.3$. This result implies, that a path through the particle is effectively longer by a factor of 1.3–1.9 compared to the direct path, which has a huge impact on mass transport processes within the interconnected pore network of a dealloyed particle.
Table 2. Comparison of branch tortuostities  $\tau _{{\rm branch}}$ and geometric tortuosities $\tau _{{\rm geom}}$ for three investigated porous Au-rich NPs.
Discussion
NPs of different structure types were investigated in this report. An overview of numerous NPs is provided by a low-magnification STEM image in Figure 8. Although there are NPs with intermediate structures (marked in yellow), the majority can be assigned either to the structure with a higher density (marked in green) or with a lower density (marked in red). Uncorroded particles (marked in blue) are very rare to find. In literature, samples were reported where porous particles were found in the direct vicinity of solid and dense particles (Rurainsky et al., Reference Rurainsky, Manjón, Hiege, Chen, Scheu and Tschulik2020). The authors claim statistic fluctuations in both, initial Ag distributions in the alloyed particles and surface diffusion of Au atoms during dealloying as the major reasons. This could also be an explanation for the formation of different structure types found in the present study. In this manner, the structure of the NPs depends on the stage of dealloying which depends on statistical fluctuations. Inhomogeneous electrical contact within the sample during electrochemical dealloying as a possible reason seems less likely as dealloyed particles of both structure types were found in close proximity (see Fig. 2d).
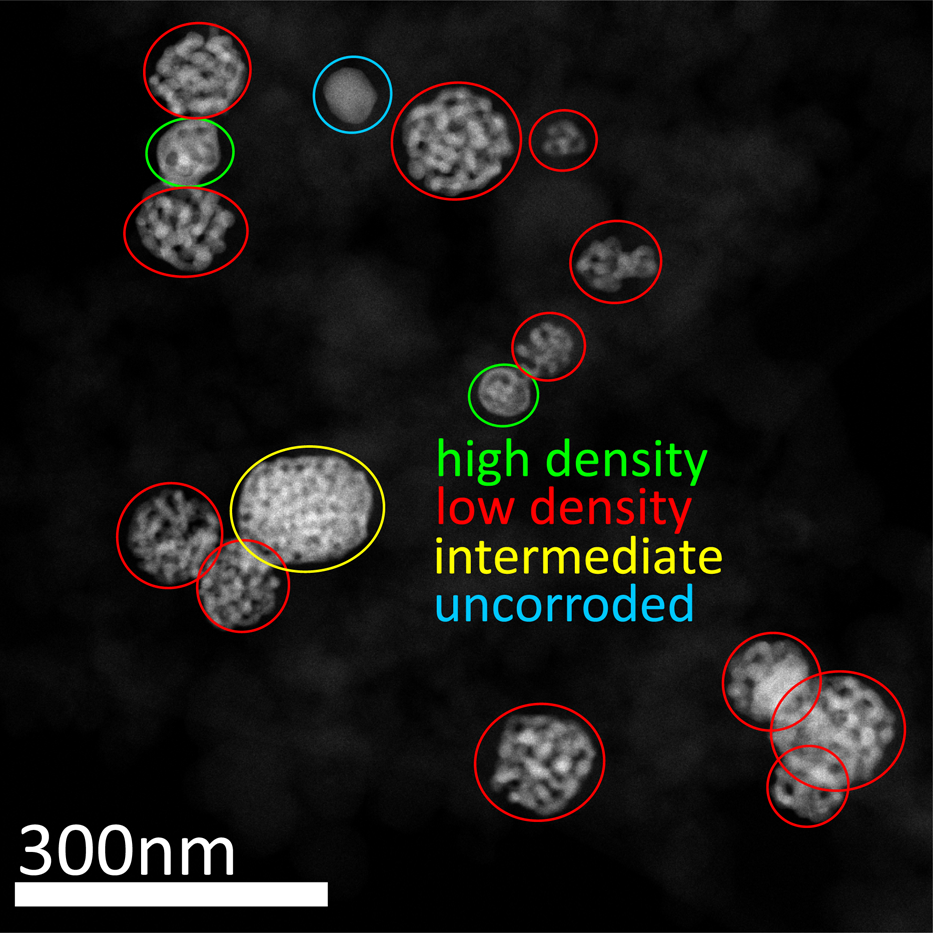
Fig. 8. Overview of NPs. Most of the porous particles have a structure with a lower density (red), some of the particles have a higher density (green), only very few particles are intermediates (yellow) or uncorroded (blue) after electrochemical dealloying.
The present work shows that porous NPs with a lower Ag content have smaller ligaments than porous NPs with a higher Ag content. This result is in contrast to what was reported for bulk nanoporous gold, where increasing ligament sizes were found with decreasing Ag content (Krekeler et al., Reference Krekeler, Straßer, Graf, Wang, Hartig, Ritter and Weissmüller2017; Mahr et al., Reference Mahr, Kundu, Lackmann, Zanaga, Thiel, Schowalter, Schwan, Bals, Wittstock and Rosenauer2017). For bulk nanoporous gold this effect was explained by coarsening of ligaments in later stages of the dealloying process. For the dealloyed NPs as investigated in this report this coarsening process seems to be different, which will be subject to further investigations.
For electrochemically dealloyed bulk nanoporous gold a porosity of  $p = 76\percnt$ and chord lengths of $\lambda _{{\rm pore}} = 55$ nm and $\lambda _{{\rm material}} = 17$ nm were reported for pores and material, respectively (Rösner et al., Reference Rösner, Parida, Kramer, Volkert and Weissmüller2007). Especially pore chords are significantly larger than that of electrochemically dealloyed NPs in the present report (compare Table 1). This explains also the higher porosity in bulk nanoporous gold compared to porous NPs. Contradictory the specific surface area is smaller in bulk nanoporous gold ( $\alpha = ( 56\pm 1) 1/\mu {\rm m}$), which illustrates once more a significant difference between the structure of bulk nanoporous gold and the structure of dealloyed porous NPs.
A three-dimensional study of bulk nanoporous gold revealed that gold ligaments and pore channels can be topologically and morphologically equivalent (Fujita et al., Reference Fujita, Qian, Inoke, Erlebacher and Chen2008) or different (Rösner et al., Reference Rösner, Parida, Kramer, Volkert and Weissmüller2007) depending on the master alloy. Both conclusions were drawn from shape and position of material and pore CLDs. In the present report, significantly different CLDs were found for material and pore space of dealloyed NPs, indicating different morphologies. On the other hand, tortuosities of material and pore space are equal within margins of error. This result shows, that it is not sufficient to consider only ligament and pore sizes or the porosity in order to compare and analyze possible differences in catalytic applications as the tortuosity is a further independent parameter.
A comparison of the tortuosity measured in the present report with values in literature is challenging, because values obtained with different methods cannot be compared directly. Whereas Xue et al. determined a tortuosity of  $\tau = ( 3.2\pm 0.2)$ for bulk nanoporous gold evaluating imbibition measurements and geometric models (Xue et al., Reference Xue, Markmann, Duan, Weissmüller and Huber2014), Hänsch found values of $\tau = 1.25-1.38$ (Hänsch, Reference Hänsch2018) evaluating the porosity with the Bruggeman relation (Chung et al., Reference Chung, Ebner, Ely, Wood and García2013). Zhao et al. used the same method as in the present report for the determination of geometric tortuosities of different dealloyed FeCrNi alloys and they obtained values between $\tau _{{\rm geom.}} = 1.0$ and $\tau _{{\rm geom.}} = 2.1$ (Zhao et al., Reference Zhao, Wada, De Andrade, Williams, Gelb, Li, Thieme, Kato and Chen-Wiegart2017). But as these are all different methods or materials values cannot be compared directly. However, all these values are similar to those determined in the present report.
The influence of the finite size of the reconstruction volume on quantitative measures was intensively discussed in literature. It was found that the reconstruction volume should be 20–25 times larger than the size of characteristic structure features to avoid finite size effects (Müllner et al., Reference Müllner, Zankel, Lv, Svec, Höltzel and Tallarek2015). This is not possible for small NPs as investigated in the present report. But as reconstructions of porous NPs contain their complete structure, i.e. the reconstruction is not cut at one or more sides, all quantitative information is free of such a cutting effect, which is why finite size effects are inherent in the structure here.
Regarding all differences between bulk nanoporous gold and porous NPs as well as all challenges concerning a three-dimensional reconstruction, it has always to be kept in mind, that every quantitative information depends on many parameters such as for example the initial composition and homogeneity of the master alloy as well as dealloying conditions.
Conclusion
The three-dimensional structure of porous Au-rich NPs prepared by electrochemical dealloying of initial Ag $_{77}$Au $_{23}$ alloy NPs was characterized in detail. It was found that dealloyed NPs with a lower content of residual Ag have a higher porosity and a larger specific surface area than dealloyed particles with a higher content of residual Ag. Differences in porosity and specific surface area originate mainly from larger material parts (interconnected ligaments). Although significantly different in terms of Ag content and morphology all investigated particles share a common tortuosity within margins of error. Furthermore, also tortuosities of material and pore space are equal. The results will help to tune and engineer mass transport processes within interconnected ligament and pore network structures of NPs for catalytic applications in the future.
Supplementary material
To view supplementary material for this article, please visit https://doi.org/10.1017/S1431927621000519
Acknowledgments
This work was supported by the Deutsche Forschungsgemeinschaft (DFG) under contract numbers RO2057/12-2 and OE610/1-1 within the research unit FOR2213 (www.nagocat.de).


 Open access