The Twenty-Five Up Study (25Up: Can we predict who will develop mental disorders? A long-term study of adolescent twins) ran from 2016 to 2018 and assessed a wide range of mental health and behavioral disorders in a young Australian cohort consisting of twins and their non-twin siblings. This study is an extension of its predecessor, the 19Up study, and the Brisbane Longitudinal Twin Study (BLTS; Couvy-Duchesne et al., Reference Couvy-Duchesne, O’Callaghan, Parker, Mills, Kirk, Scott and Davenport2018; Gillespie et al., Reference Gillespie, Henders, Davenport, Hermens, Wright, Martin and Hickie2013), which examined mental health and alcohol and substance use (Gillespie et al., Reference Gillespie, Neale and Kendler2009) in a large sample of young twin adults (mean age = 26.1, range = 19.7–38.6). 25Up aimed to assess individuals who were slightly older than those in 19Up, with the similar overall aim of collecting data that will help shed light on the risk factors and pathways involved in the development of affective disorders. These studies represent a large collection of a wide array of phenotypic data, including psychological and environmental variables of relevance for mental health and disorders. Some of these include personality dimensions and psychological symptoms, mental disorders that meet the Diagnostic and Statistical Manual of Mental Disorders (5th ed., DSM-5; American Psychiatric Association, 2013) and five diagnostic criteria: alcohol and substance use and misuse, migraine, sleep behaviour, as well as neurobiological correlates (neuroimaging) and genome-wide genotyping (Figure 1). Notably, the mean age increase between the individuals participating in the 19Up and 25Up studies was 3.6 years (Supplementary Figure 1).
Fig. 1. Summary of the BLTS data collection. Longitudinal: vitamin D; infections (antibodies); neuroticism junior Eysenck personality questionnaire (JEPQ) Neuroticism–Extraversion–Openness inventory (NEO); psychiatric signs (SPHERE). Cross-sectional: hair cortisol; cognition (verbal, performance IQ, working memory, and information processing); binocular rivalry (rivalry rate); brain imaging (multimodal magnetic resonance imaging); substance use (alcohol, tobacco, and recreational drugs); sleep patterns (actigraphy); psychiatric diagnoses (Composite International Diagnostic Interview); life events/social support/relationships (e.g. early home environment, family relationships, traumatic events, socioeconomic factors). Note: Sample size is only indicative as some of the waves are still recruiting new participants. Figure adapted from Couvy-Duchesne et al. (Reference Couvy-Duchesne, O’Callaghan, Parker, Mills, Kirk, Scott and Davenport2018) and Gillespie et al. (Reference Gillespie, Henders, Davenport, Hermens, Wright, Martin and Hickie2013).
The 25Up study was structured so as to collect further psychological, behavioral and subclinical assessments, with the aim of using these to understand the factors involved in the development and progression of mental health disorders from late teenage years to early adulthood. This new wave of the BLTS will allow us to gain insight into the genetic basis of behavioral phenotypes, mental health and comorbidities. Finally, as with the 19Up study, data collection was also designed to contribute to twin and genetic consortia in psychiatry, personality and behavior genetics. The aim of the present article is to describe the key characteristics of the cohort and give examples of important themes (e.g. comorbidity and primacy of onset in dual diagnoses) that can be examined in future in more detailed analyses of the cohort data, and also to highlight the opportunities for new collaborations that could make use of the rich 25Up data set.
Methods
Study Contact
Between February 2016 and October 2018, 3785 individuals were approached via email to participate in the 25Up study, which entailed a detailed, three-part, self-report online survey (TFU1, TFU2, and TFU3). There was a 67.1% response rate (2540 individuals) for completing the first part of the survey (TFU1) and a 62% response rate (2343 individuals) for completing all three parts of the survey (TFU1, TFU2, and TU3). Follow-up was conducted by a phone call 1–2 weeks after the initial contact email. Supplementary Figure 2 depicts the variation in participant response.
Part 1 of the survey (TFU1, N = 2540) assessed general health, medical and treatment history as well as lifetime diagnoses. TFU2 (N = 2484) expanded on TFU1, assessing other physical characteristics such as baldness, skin tone and acne, as well as a multitude of conditions and behavioral characteristics. TFU3 (N = 2343) was the final part of the survey, containing questions addressing sexual identity, quality of romantic relationships, sexual and romantic preferences. For further information regarding the specific items addressed in each section, the instruments used to assess these items and number of participants answering each section, refer to Table 1.
Table 1. Variables examined in the different surveys of the 25Up study
Note: TFU1, TFU2 and TFU3 refer to the three parts of the online questionnaire. Approximate N represents the average of not null respondents for representative (not follow-up) questions of each section.
Statistical Analyses
In this study, we focus on describing the prevalence, risk factors (i.e. age and sex), comorbidity and primacy of onset of self-reported mental health variables. A study assessing specific diagnoses using the relevant questionnaires is outside the scope of this cohort description. Age and sex effects were assessed by means of logistic regression modeling in Python using the statsmodels module. The variables of interest were included as covariates and their significance was assessed using Wald tests.
Disorder Clustering and Comorbidity Analysis
All pairwise tetrachoric correlations (ρ) were calculated using R (3.1.1) and the psych package (v1.4.3). Briefly, the presence or absence of a disorder was coded as a binary vector, and all disorders were compared by computing their tetrachoric correlation coefficient. Next, a hierarchical clustering was performed using Ward’s minimum intracluster variance objective function (Ward, Reference Ward1963) with a distance metric calculated as 1 − ρ. Mixed-effects logistic regressions were used to calculate the increase in risk on a second disorder given the occurrence of a given disorder. The function glmer from the R library lme was used, including age and sex as fixed effects, and the family ID as grouping factor for the random effects variance–covariance structure. For each pair of disorders, one was modeled as an outcome variable, while the other one was used as a predictor. The p-values of the association of one disorder with another were subjected to a Bonferroni multiple testing correction.
Power Analysis
Phenotype simulations (of continuous traits) and power analyses were performed using the powerFun, MASS and OpenMx R libraries. Multivariate data were simulated using the mvrnorm function specifying a variance–covariance structure determined by a linear combination of varying values for the additive genetic (A) and common environmental (C) components. The sample sizes of these simulated distributions were identical to the number of twin-pairs available in the 25Up cohort. OpenMx was used to fit an ACE model to the simulated data. The significance of the A and C variance components was assessed using a log likelihood ratio test (the mxCompare function of OpenMx) comparing the full model to a model only including the other two components (e.g. ACE vs. CE). This procedure was repeated 100 times, and power was estimated by counting the number of iterations in which the studied component was rejected. A similar procedure was used to simulate and assess the power to detect a genetic correlation. Two phenotypes were simulated with a specified underlying genetic correlation, and a bivariate ACE model was used to assess the significance of the genetic correlation. The results are available in the Supplementary Figure 3.
Results
Cohort Description
Of the 3785 individuals invited to participate in the study, 62% of the twins and non-twin siblings provided complete data. Overall, females were slightly over-represented among the 25Up respondents, comprising 52% of the invited population but 59.5% of actual ascertained participants (Table 2). Survey completion rates were high and, of the participants who had completed TFU1, 2484 (97.8%) completed the second section of the survey (TFU2), and 2343 (92.2%) completed the third part (TFU3). Females tended to complete all sections of the survey more often than males, with 95.3% of females completing all three parts compared to 87.7% of males. The greatest dropout for men was between completing Part 2 (96.3%) and Part 3 (87.7%) of the survey. The mean age of all participants was 29.7 (SD = 4.2, range = 22–44; Supplementary Figure 2), consisting of 341 complete monozygotic pairs, 415 dizygotic pairs, 125 MZ singletons, 269 DZ singletons and 634 siblings. Twins and non-twin siblings did not differ in maximum educational attainment level (p = .57), but nontwin individuals were older (30.5 vs. 29.4, p = .001), more likely to be married (62% vs. 55%, p = .001) and less likely to have children compared with co-twins (49.6% vs. 57.5%, p = .001). Ethnically, the cohort reflects the population structure of families with twins in Queensland at the time of recruitment, with a majority of participants having European ancestry and minorities of predominantly Asian ancestry (Gillespie et al., Reference Gillespie, Henders, Davenport, Hermens, Wright, Martin and Hickie2013).
Table 2. Demographics of the 25Up cohort
All participants had been invited to complete previous BLTS (Gillespie et al., Reference Gillespie, Henders, Davenport, Hermens, Wright, Martin and Hickie2013; Wright & Martin, Reference Wright and Martin2004) studies (Figure 1). Therefore, variables such as height, weight, personality, psychiatric signs, sleep patterns, migraine and blood samples (hematological and immunological measures: e.g. antibodies markers of infections, vitamin D) were collected longitudinally in the BLTS, with up to five time points for some phenotypes (Figure 1). A noteworthy example is the assessment of personality traits using the Neuroticism–Extraversion–Openness (NEO) Personality Inventory-related scales (Costa & McRae, Reference Costa and McCrae1992). Although some cohorts present different versions of the NEO (due to updates and study design changes), the overall constructs measured should remain highly isomorphic, as we would expect with biometrical phenotypes (such as height) and other behavioral instruments such as the Somatic and Psychological HEalth REport (SPHERE; Hickie et al., Reference Hickie, Davenport, Hadzi-Paviovic, Koschera, Naismith, Scott and Wilhelm2001) (also used to assess mental health on most of the BLTS). In addition, genome-wide single nucleotide polymorphism genotypes are currently available for 86% (N = 2205) of participants.
Findings to Date
The 25Up study has collected information on 20 different psychiatric or affective disorders (see Table 3) and a range of lifestyle, health and behavioural traits (Table 1). Overall, ∼20% of the participants self-reported a lifetime major mental health problem affecting their everyday life. This estimate is consistent with estimates for the Australian population (Department of Health, 2009). Among the disorders examined, general anxiety (16%, N = 402) and depression (17.3%, N = 436) were the most prevalent diagnoses. Following these, panic, substance use, sleep, and post traumatic stress disorders (PTSD) had the highest prevalence in the 25Up cohort (3.3%, 2.9%, 2.5% and 2.4%, respectively; Table 3).
Table 3. Lifetime prevalence of self-reported mental health disorders in the 25Up study
Nominally significant P values are highlighted in bold. Analyses were performed by using a logistic regression accounting simultaneously for the effects of sex (females as a reference) and age. OR - odds ratio, C.I.-95% confidence intervals. MHP- mental health problem. ADD/ADHD- Attention deficit disorder/Attention deficit and hypercativity disorder. OCD- obsessive compulsive disorder. PMS - premenstrual syndrome. PTSD - post traumatic stress disorder. SUD- Alcohol and substance misuse., MHP- mental health problem. *Prevalences calculated based only on not null values (participants that responded to the section (N=2516)
Sex Differences
The differences in response rates and fallout rates between males and females motivated the assessment of whether self-reported lifetime prevalence of mental health problems was associated with sex in this cohort. Both depression and general anxiety were far more prevalent in females than males (11.6% vs. 5%, p < .001 and 15.3% vs. 3.4%, p < .001, respectively). PTSD, obsessive-compulsive disorder (OCD), panic disorder, general eating disorders and bulimia and anorexia showed significant sex effects, all having a higher prevalence in females (Table 3). In addition, PTSD was the only disorder to show a nominally significant increased prevalence with age (p = .006), although this did not survive correcting for multiple testing, but would be consistent with a higher probability for the occurrence of a traumatic event as time passes. No other differences reached statistical significance in this cohort (Table 3).
Age of Onset
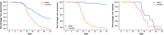
The age of onset of the examined self-reported phenotypes (disorders) was not significantly different between males and females. In the case of depression, females had a slightly earlier age of onset (18.8 years vs. 20.5 years, p ≤ .001; Figure 2 and Supplementary Figure 4). The youngest mean age of onset was for autistic spectrum disorders, including Asperger syndrome (mean = 5.5 years, SD = 6.5), while the oldest mean age of onset recorded in this cohort was for psychosis (mean = 24.4 years, SD = 5.9). Age of onset estimates was not available for alcohol dependence and misuse as only the age at alcohol drinking initiation (mean = 16.0 years) was collected. Notably, the mean age of onset of anorexia, bulimia and eating disorders were all during adolescence (∼16 years), while the mean age of onset for other disorders was mostly around young adulthood (Table 4 and Supplementary Figure 4).
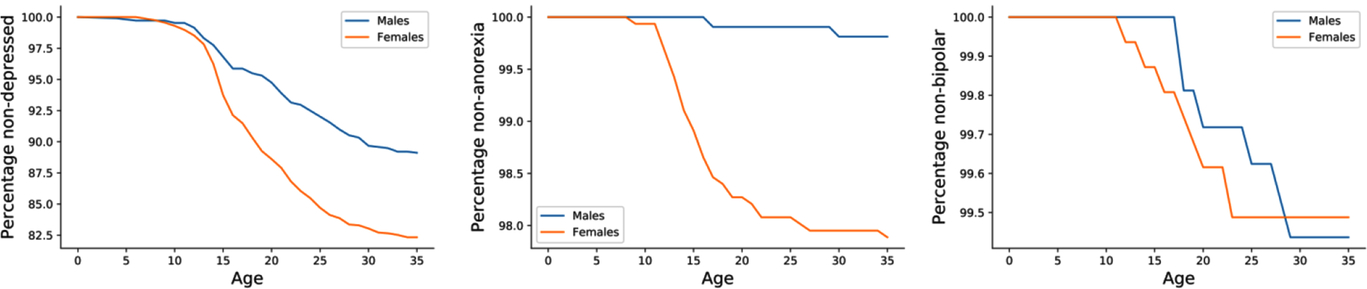
Fig. 2. Kaplan–Meier curves stratified by sex. Kaplan–Meier curves depict the self-reported age of onset for three disorders (depression, anorexia and bipolar disorder, respectively) in the 25Up cohort.
Table 4. Disorder age of onset in the 25Up study
Note: ADD/ADHD = attention deficit disorder/attention-deficit hyper-activity disorder; OCD = obsessive-compulsive disorder; PMS = premenstrual syndrome; PTSD = post traumatic stress disorder.
Disorder Comorbidity
There is a known overlap between affective, anxiety and substance use disorders (Kessler et al., Reference Kessler, Nelson, McGonagle, Edlund, Frank and Leaf1996; Merikangas et al., Reference Merikangas, Angst, Eaton, Canino, Rubio-Stipec, Wacker and Whitaker1996; Regier et al., Reference Regier, Farmer, Rae, Locke, Keith, Judd and Goodwin1990). Within the 25Up study, evidence of the relationships between the 20 disorders was observed through hierarchical clustering. Self-reported history of psychosis and schizophrenia clustered together, as did anorexia, bulimia and eating disorders. Additional clusters were attention deficit and hypercativity disorder (ADHD) and autism, as well as depression, anxiety, PTSD and panic disorder (Figure 3). In order to quantify the increased risk of a condition, given the presence of a second condition (while correcting for the effects of age, sex and relatedness), we used a mixed-effects logistic regression approach (see Methods). All significant associations between the disorders studied were positive while none of the negative associations (i.e. decreased risk) reached statistical significance. Individuals who were rated as positive for an alcohol and other substance misuse were more likely to score positive for memory disorder and depression (p < .05 after multiple testing correction). Furthermore, a significant risk increase was also detected between psychosis and schizophrenia and between depression and a variety of other comorbid disorders, including PTSD, sleep disorder and premenstrual syndrome (PMS) among others (Figure 3). Interestingly, of those participants (both males and females) reporting substance misuse ~50% reported also having another mental health disorder, the majority reported that the substance abuse disorder followed the mental condition (Figure 4).
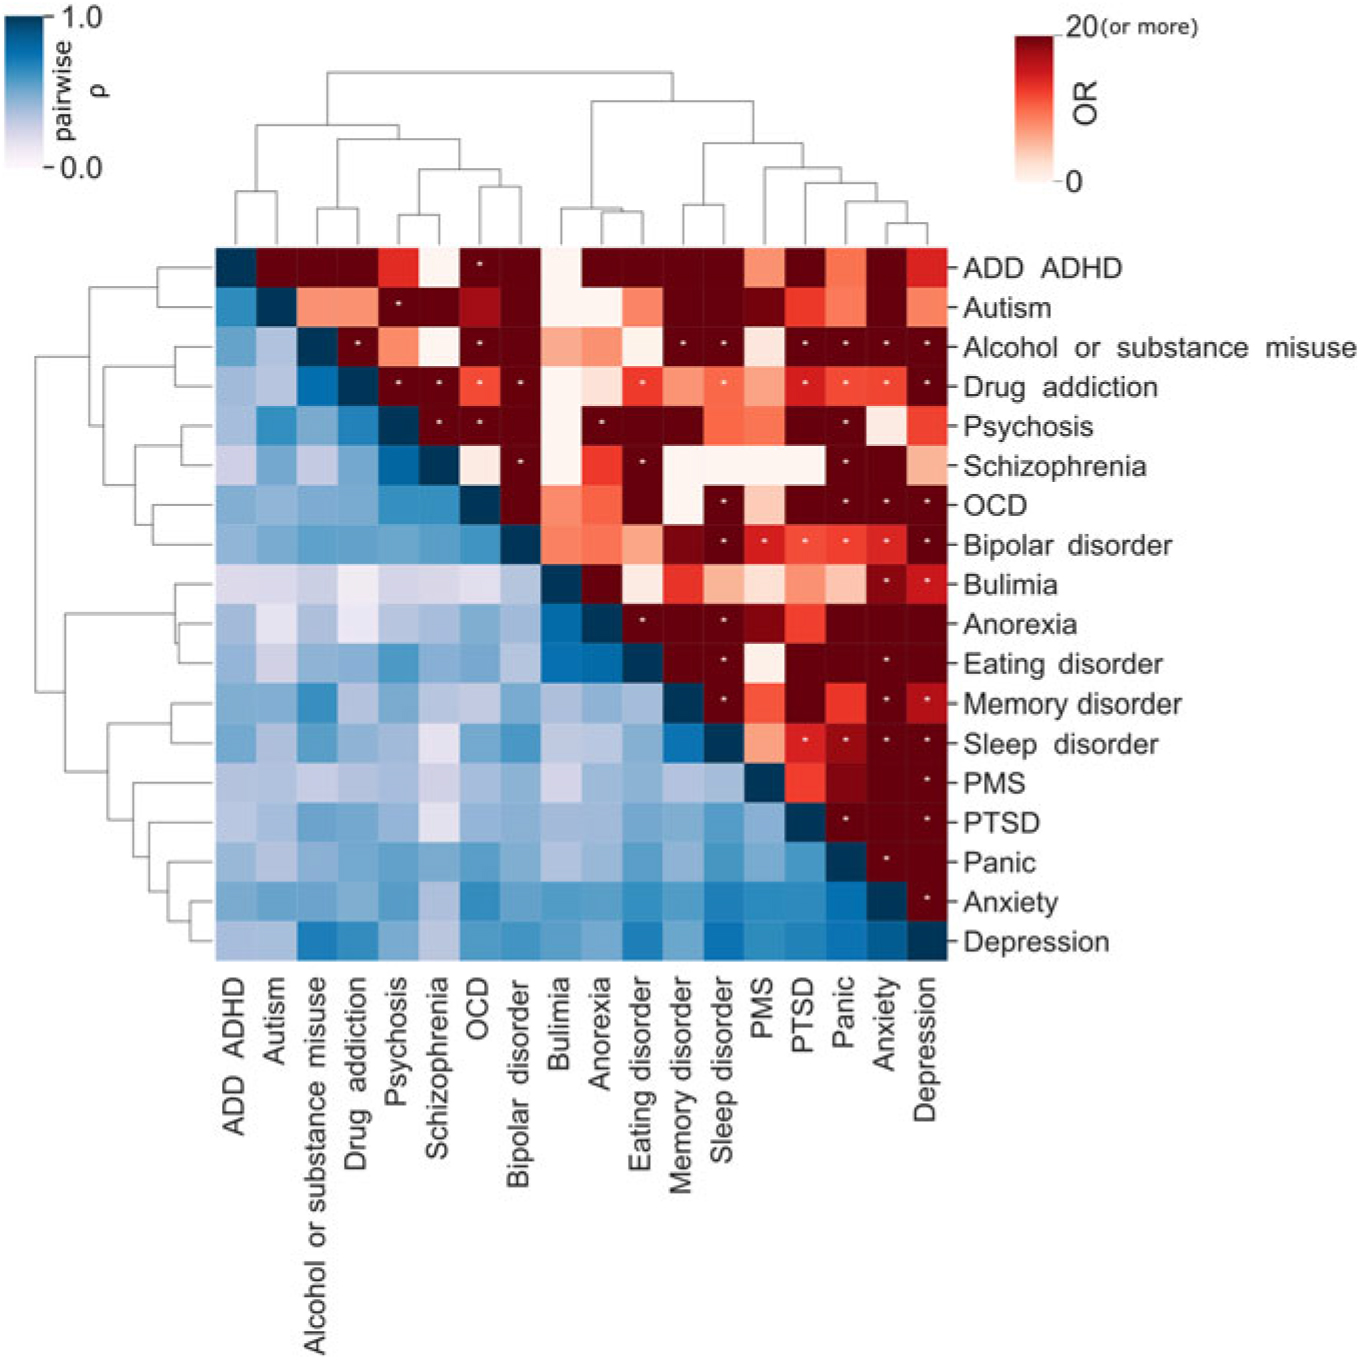
Fig. 3. Disorder comorbidity within the 25Up study. Lower triangle depicts a hierarchical clustering (Ward’s method) of the disorders based on their self-reported lifetime co-occurrence (tetrachoric correlations). Upper triangle portrays lifetime comorbidity odds ratio (ordered based on the clustering of the lower triangle). Note: * p < .05 after multiple testing correction (α < .000146).
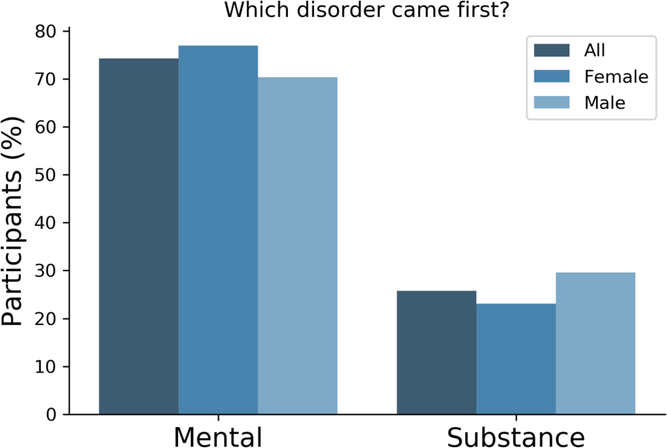
Fig. 4. Most participants reported a mental disorder prior to substance abuse. Bar plots depicting the number of participants reporting precedence of either a mental or a substance abuse disorder. Only participants that reported both type of conditions responded to this question (n = 66).
The 25Up Cohort Will Enable Longitudinal Analyses
The unique strength of the 25Up study is that it is the latest wave in a longitudinal study spanning more than 20 years. This allows for unparalleled analysis of the dynamic nature of mental health variables as individuals progress through adolescence and into young adulthood. For example, when comparing the lifetime prevalence of self-reported psychotic symptoms (CIDI Psychosis Screener; Scott et al., Reference Scott, Chant, Andrews and McGrath2006) in the previous 19Up cohort to those in 25Up, we found that, as expected, the prevalence for most symptoms has increased in the 25Up. However, there were instances where the lifetime prevalence decreased in the 25Up cohort, pointing to possible recall bias. Nonetheless, with those that increased, the increase was heterogeneous, that is, the prevalence of some symptoms did not change significantly, whereas others doubled (Figure 5). The extent to which this heterogeneity is caused by recall bias or other factors might be studied in the future. Notably, the BLTS includes several potential isomorphic instruments (such as depression and personality) that will enable genetic and environmental longitudinal analyses.
Fig. 5. Comparison of lifetime prevalence of any psychotic symptoms in the 19Up and 25Up cohort studies. Bar plots depict the prevalence and 95% confidence intervals (1000 bootstrap pseudo replications) of psychotic symptoms in the 19Up and 25Up cohorts stratified by sex. Results are depicted only for participants with available data for both data sets (n = 2319; M = males, F = females).
Discussion
Here we described the demographics and self-reported history of mental disorders in the 25Up cohort. Our findings are consistent with previous mental illness prevalence estimates in Australia (Lawrence et al., Reference Lawrence, Hafekost, Johnson, Saw, Buckingham, Sawyer and Zubrick2016; Liddell et al., Reference Liddell, Nickerson, Sartor, Ivancic and Bryant2016), and observations of women having a higher prevalence of PTSD (Galea et al., Reference Galea, Nandi and Vlahov2005; Gavranidou & Rosner, Reference Gavranidou and Rosner2003), panic disorder (Crowe et al., Reference Crowe, Noyes, Pauls and Slymen1983; Weissman et al., Reference Weissman, Bland, Canino, Faravelli, Greenwald, Hwu and Lellouch1997) eating disorders (Mitchison & Hay, Reference Mitchison and Hay2014), depression (Weissman & Klerman, Reference Weissman and Klerman1977) and anxiety disorders (Bandelow & Michaelis, Reference Bandelow and Michaelis2015). We detected a significant association between sex and OCD prevalence, an observation not previously made in adults (Karno et al., Reference Karno, Golding, Sorenson and Burnam1988; López-Solà et al., Reference López-Solà, Fontenelle, Alonso, Cuadras, Foley, Pantelis and Soriano-Mas2014), but only in individuals with an age of onset before or during adolescence (Grant, Reference Grant2014). We also identified a nominal association of PTSD with age, although a plausible explanation of this effect could be related to a higher probability of a stressful event with age, but this association did not survive multiple testing corrections.
There is consistent evidence for a broad distinction between externalizing and internalizing disorders (Cosgrove et al., Reference Cosgrove, Rhee, Gelhorn, Boeldt, Corley, Ehringer and Hewitt2011; Krueger et al., Reference Krueger, Caspi, Moffitt and Silva1998). Nonetheless, our findings suggest high levels of lifetime comorbidity between affective and substance use disorders. This is consistent with recent studies detecting a genetic overlap between psychological distress, somatic distress, affective disorders and substance use (Chang et al., Reference Chang, Couvy-Duchesne, Medland, Gillespie, Hickie, Parker and Martin2018) and with the self-medication hypothesis suggesting substance misuse as a coping mechanism (Marshall, Reference Marshall1994; Myrick & Brady, Reference Myrick and Brady2003). Notably, we identified a high comorbidity between externalizing and internalizing disorders such as depression and substance misuse or OCD and attention deficit disorder (ADD)/ADHD. Furthermore, we detected expected comorbidity of co-occurring diseases and symptoms such as eating disorders and anorexia (Thornton et al., Reference Thornton, Mazzeo and Bulik2010), drug addiction and alcohol misuse, psychosis and schizophrenia (National Collaborating Centre for Mental Health 2014) and depression and anxiety (Gorman, Reference Gorman1996). Depression was the disorder with the highest comorbidity, having a significant association with around half of the conditions. Altogether, these observations are consistent with the high genetic correlation between psychiatric disorders and the overlap in diagnostic criteria (Anttila et al., Reference Anttila, Bulik-Sullivan, Finucane, Walters, Bras, Duncan and Malik2018; Bulik-Sullivan et al., Reference Bulik-Sullivan, Finucane, Anttila, Gusev, Day, Loh and Robinson2015). Furthermore, these findings suggest the self-reported lifetime of mental health conditions on the 25Up to be valid and reliable.
We also analyzed whether there were sex differences in the age of onset of psychiatric and substance abuse disorders. Our findings indicated a nominally significant difference in the age of onset of depression, which is consistent with previous observations on adolescents (Avenevoli et al., Reference Avenevoli, Swendsen, He, Burstein and Merikangas2015). Notably, the mean age of onset of eating disorders was during adolescence, as previously reported (Hudson et al., Reference Hudson, Hiripi, Pope and Kessler2007; Volpe et al., Reference Volpe, Tortorella, Manchia, Monteleone, Albert and Monteleone2016).
Strengths and Limitations
The 25Up study represents a large effort to characterize and understand the genetic, environmental and behavioral factors associated with mental health in young adults transitioning from adolescence. More than 50 different mental health and lifestyle variables, such as technology use, sociosexuality and substance use, were assessed in (on average) ~2100 twins, making this a rich and valuable data set. The preceding work on the BLTS cohort has started to shed light onto the genetic and neurobiological etiology of substance abuse (Chang et al., Reference Chang, Couvy-Duchesne, Medland, Gillespie, Hickie, Parker and Martin2018; Gillespie et al., Reference Gillespie, Neale, Bates, Eyler, Fennema-Notestine, Vassileva and Thompson2018; Schmaal et al., Reference Schmaal, Veltman, van Erp, Sämann, Frodl, Jahanshad and Niessen2016). We expect that this follow-up of the cohort will drive further cross-sectional and longitudinal genetic epidemiology studies of human behaviour and mental health.
The sample size of the 25Up study (341 complete monozygotic twin-pairs and 415 dizygotic pairs) should allow the detection of heritability estimates ≥30% and common environmental influences >30% with at least 80% power (Martin et al., Reference Martin, Eaves, Kearsey and Davies1978; Visscher et al., Reference Visscher, Andrew and Nyholt2008). Furthermore, the 25Up cohort provides at least 80% power to detect genetic correlations as low as r g = .3 (considering a heritability for each trait >20%) in line with cohorts with similar sizes and power simulations. The existence of longitudinal biometric and mental health data could enable novel family and epidemiological studies to be performed. The longitudinal nature of the BLTS has enabled the discovery that lifetime progression of self-reported psychotic symptoms is heterogeneous. Future studies assessing the genetic and environmental factors accounting for this heterogeneity across development could result in new intervention and prevention strategies.
Some limitations of the 25Up study must be noted. Although clinical, lifestyle and demographic variables were assessed through established instruments, they were obtained through online surveys and therefore all responses are subject to the possible biases and accuracy of self-report questionnaires. Notably, recall bias (e.g. not remembering a depressive episode) and subjectivity (e.g. when rating their physical and mental health) should be considered and corrected for, before conducting analyses and especially before comparing with other population-based studies. It is also important to note that all analyses presented in this article were based on self-reported lifetime medical history data and therefore are not necessarily in accordance with observations made when using other criteria, such as the DSM-5. Additionally, caution must be taken when trying to ascertain specific disorders from the instruments used in this study. For example, with schizophrenia, self-reported and CIDI-based ascertainment might not match the DSM-5 diagnostic criteria.
Furthermore, genetic and epidemiological analyses using the twins from the 25Up cohort will inevitably assume the cohort to be representative of the overall (age-matched) population. It is well documented that the liability to twinning has a genetic component (Mbarek et al., Reference Mbarek, Steinberg, Nyholt, Gordon, Miller, McRae and De Geus2016; Painter et al., Reference Painter, Willemsen, Nyholt, Hoekstra, Duffy, Henders and Skolnick2010) and could therefore be genetically correlated with other traits (Laisk et al., Reference Laisk, Kukushkina, Palmer, Laber, Chen, Ferreira and Smoller2018). Moreover, environmental differences between twins and nontwins (such as twins being treated more similar than siblings) are also a possible source of bias. Nonetheless, both of these limitations can be circumvented by including the large number of siblings who are part of the 25Up cohort in the analyses.
Conclusion
The 25Up cohort represents a rich data set that will enable analyses of the epidemiology, heritability and genetic correlations of wellbeing and mental health variables. The overall prevalence of mental disorders and the prevalence rates for lifetime comorbidities were in line with previous studies. As an update of the BLTS, it represents a unique opportunity for longitudinal studies aiming at further understanding the etiology and heterogeneity underlying the progression of affective, mood and substance use disorders from young- to mid-adulthood. Here, we exemplified this by comparing item-level prevalence of psychotic items across the 19Up and 25Up cohorts, identifying a heterogeneous increase that might be explained by dynamic (age-dependent) genetic effects. Moreover, the inclusion of surveys focused on the usage of technological devices (e.g. internet and mobile phone usage) will enable unprecedented analysis of their relationship with mental health. We anticipate the 25Up cohort to be an attractive resource to boost collaboration, ultimately propelling scientific discovery.
Supplementary Material
To view supplementary material for this article, please visit https://doi.org/10.1017/thg.2019.27.
Acknowledgments
This project was funded by NHMRC Project Grant APP1069141 to IBH and NGM. We also thank David Smyth and Scott Gordon for IT support. In particular, we thank the twins and their families for their participation in our research. AIC is supported by a research training scholarship (RTP) granted by The University of Queensland (UQ).