


Introduction
After decades of low pertussis activity in the USA following the introduction of whole-cell pertussis vaccines in the late 1940s, major outbreaks took place during 2004–2005, 2010, 2012 and 2014 [1]. Several factors behind the increase in reported pertussis incidence were proposed [Reference Clark2, Reference Domenech de Cellès3], such as the introduction of acellular pertussis vaccines and the reduction in protection compared to the receipt of whole-cell vaccines [Reference Witt4, Reference Sheridan5], waning effectiveness of acellular vaccines [Reference Liko, Robison and Cieslak6–Reference Acosta10], improved testing and reporting [Reference Jackson and Rohani11], and the possible impact of genetic changes to B. pertussis [Reference Jackson and Rohani11, Reference Mooi12]. A related question in pertussis epidemiology is the relative importance of individuals in different population groups in propagating pertussis outbreaks, and the potential impact of vaccination on the spread of pertussis in the community, including the disease burden in infants [Reference McIntyre and Wood13]. An important aspect of this issue is the fact that, as the time from the introduction of acellular vaccines in different places increases, children of increasingly older ages are covered entirely by the acellular pertussis vaccination series. In light of the evidence of decreased protection associated with receipt of acellular pertussis vaccines alone compared with receipt of some whole-cell pertussis vaccination [Reference Witt4, Reference Sheridan5], the role of older children during pertussis outbreaks is generally expected to increase with time. Furthermore, the efficacy of the Tdap vaccine, usually administered around the age of 11 years [14] wanes with time since vaccine administration [Reference Koepke8, Reference Acosta10]. Additionally, pertussis vaccine effectiveness against infection and transmission to others can be lower than the effectiveness against symptomatic disease episodes, as suggested by a study of pertussis vaccination in baboons [Reference Warfel, Zimmerman and Merkel15]. Moreover, the difference in vaccine effectiveness against infection (which is relevant for disease spread in the whole community and the herd effects of vaccination) vs. effectiveness against detected symptomatic disease (which reflects individual protection for vaccine recipients) is potentially more pronounced for Tdap compared with DTaP [Reference Worby16]. More evidence exists in the literature about the herd effects of DTaP than the herd effects of Tdap, with a survey of the herd immunity effects of DTaP given in [Reference Domenech de Cellès17]. All of these suggest that older adolescents may potentially play a prominent role in propagating the more recent, as well as future pertussis epidemics. While the observed upward shift in the age distribution of reported pertussis cases during the more recent major epidemics, e.g. [Reference Winter18] vs. [Reference Winter19], provides some indication to that effect, a better understanding of the role of different age groups, including older adolescents during pertussis outbreaks is needed.
Previously, we introduced a method for assessing the roles of different population groups during infectious disease outbreaks [Reference Worby20–Reference Goldstein22] and applied it to the data from the 2012 pertussis epidemics in Minnesota and Wisconsin [Reference Worby16, Reference Goldstein, Worby and Lipstich23]. That inference method compares age groups in terms of their proportion among reported cases before vs. after the outbreak's peak using the relative risk (or risk ratio) statistic RR. Groups that play a more prominent role in perpetuating outbreaks due to either increased contact rates, or increased susceptibility to infection, or both, are over-represented among cases of infection occurring during the ascent of the outbreak. Such groups experience a disproportionate depletion of the pool of susceptible individuals during the outbreak's early stages and represent a relatively smaller proportion of all cases of infection in the population, as well as of reported cases during the outbreak's later stages, and, correspondingly, have a higher value for the RR statistic [Reference Worby20–Reference Goldstein22]. Importantly, this comparison of the relative roles of different age groups does not depend on the differences in case reporting rates (proportion of cases of infection that are reported) in different age groups, as long as age-group-specific case reporting rates do not change during the course of the outbreak [Reference Worby20]; potential changes in case-detection rates during the course of an epidemic are likely to bias the RR estimates towards the null (see Discussion). When applied to data from pertussis epidemics, that inference method suggested the prominent role of adolescents aged 11–14 years during the 2012 pertussis outbreaks in Minnesota and Wisconsin [Reference Worby16, Reference Goldstein, Worby and Lipstich23].
In this paper, we apply the methodology in [Reference Worby16, Reference Worby20–Reference Goldstein22] based on the RR statistic to assess the relative roles of different age groups during the 2010 and 2014 pertussis epidemics in California. Quantification of the relative role for an age group according to the methodology in [Reference Worby16, Reference Worby20–Reference Goldstein22] is related to the impact of vaccinating an individual in that age group at the start of an outbreak on reducing the epidemic's initial growth rate/reproductive number (Supporting Information in each of [Reference Worby16, Reference Worby20, Reference Goldstein22]); thus, a greater relative role of a given age group on propagating an epidemic corresponds to a greater impact of vaccinating an individual in that age group on the epidemic's initial growth rate. The results of [Reference Worby16, Reference Worby20, Reference Goldstein22] suggest that for the great majority of simulated epidemics, the age group for which receipt of a fixed quantity of a vaccine results in the largest reduction in the epidemic's initial reproductive number (and growth rate) is also the age group with the highest value of the RR statistic; moreover, the latter relation further strengthens for the larger epidemics. In addition to evaluating the relative role of different age groups during both the 2010 and the 2014 pertussis epidemics in California, we also examine the differences in those roles during the 2014 vs. the 2010 epidemics. This comparison is partly motivated by the possible rise in the importance of older adolescents during the more recent pertussis outbreaks, and the potential need for a booster dose that is effective against infection and transmission for older adolescents [Reference Liko, Robison and Cieslak6, Reference Acosta10, Reference Warfel, Zimmerman and Merkel15, Reference Worby16] with the aim of mitigating future pertussis epidemics in the community.
Methods
Data
We considered pertussis case reporting data between 2010 and 2015 collected by the California Department of Public Health. The analyses were restricted to the time period covering the duration of each outbreak. For the 2010–2011 epidemic, the analyses were restricted to the time period between week 1, 2010 and week 12, 2011. For the 2014 epidemic, the analyses were restricted to the period between week 1, 2014 and week 52, 2014. Data used in this study are available from the California Department of Public Health. Previously-collected de-identified data on reported pertussis cases in California were obtained from the California Department of Public Health and no informed consent from individuals representing those pertussis cases was sought
This project was approved both by the Committee for the Protection of Human Subjects for the State of California (Federal Assurance # 00000681) and the IRB at the Harvard TH Chan School of Public Health (Protocol # IRB18-0321).
We considered six regions in California that comprise the following counties:
Region 1: San Diego, Imperial, San Bernardino, Riverside
Region 2: Los Angeles, Orange, Ventura
Region 3: Kern, Tulare, Fresno, Madera, Merced, Mariposa, Tuolumne, Stanislaus, San Joaquin, Amador, Calaveras
Region 4: San Benito, Santa Clara, Santa Cruz, San Mateo, Alameda, Contra Costa, San Francisco, Marin, Solano, Napa, Sonoma
Region 5: Yolo, Sacramento, El Dorado, Yuba, Placer, Sutter, Butte, Nevada, Colusa, Glenn, Tehama, Shasta
Region 6: Santa Barbara, San Luis Obispo, Monterey
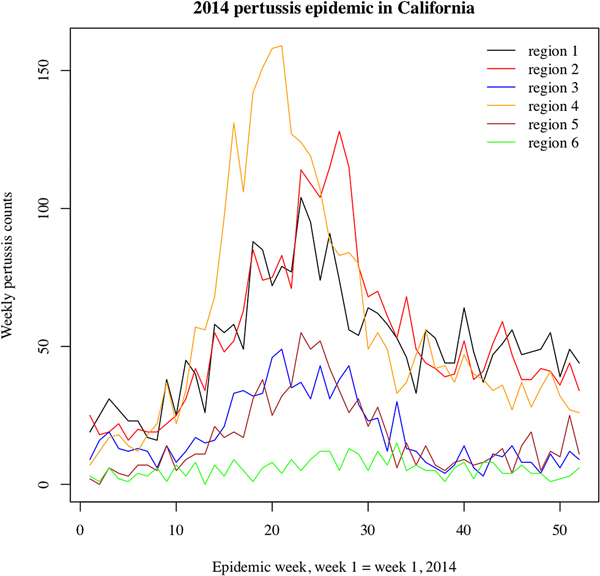
We note that the outbreak in each region may comprise multiple local outbreaks with peaks potentially occurring at different times than the regional peak. To mitigate the potential effect of this phenomenon on our inference method, the statistical analysis only included those regions where the incidence curves of reported pertussis cases had pronounced major peaks (Figs 1 and 2). The starting and ending weeks for each region were determined by the ascent and descent of the epidemic wave in that region. Section S1 of the Supporting Information gives further details on the selected regions, the starting and ending weeks for the major waves of the 2010–2011 and the 2014 pertussis epidemics in those regions, and the number of reported pertussis cases during those epidemic waves in the selected regions.
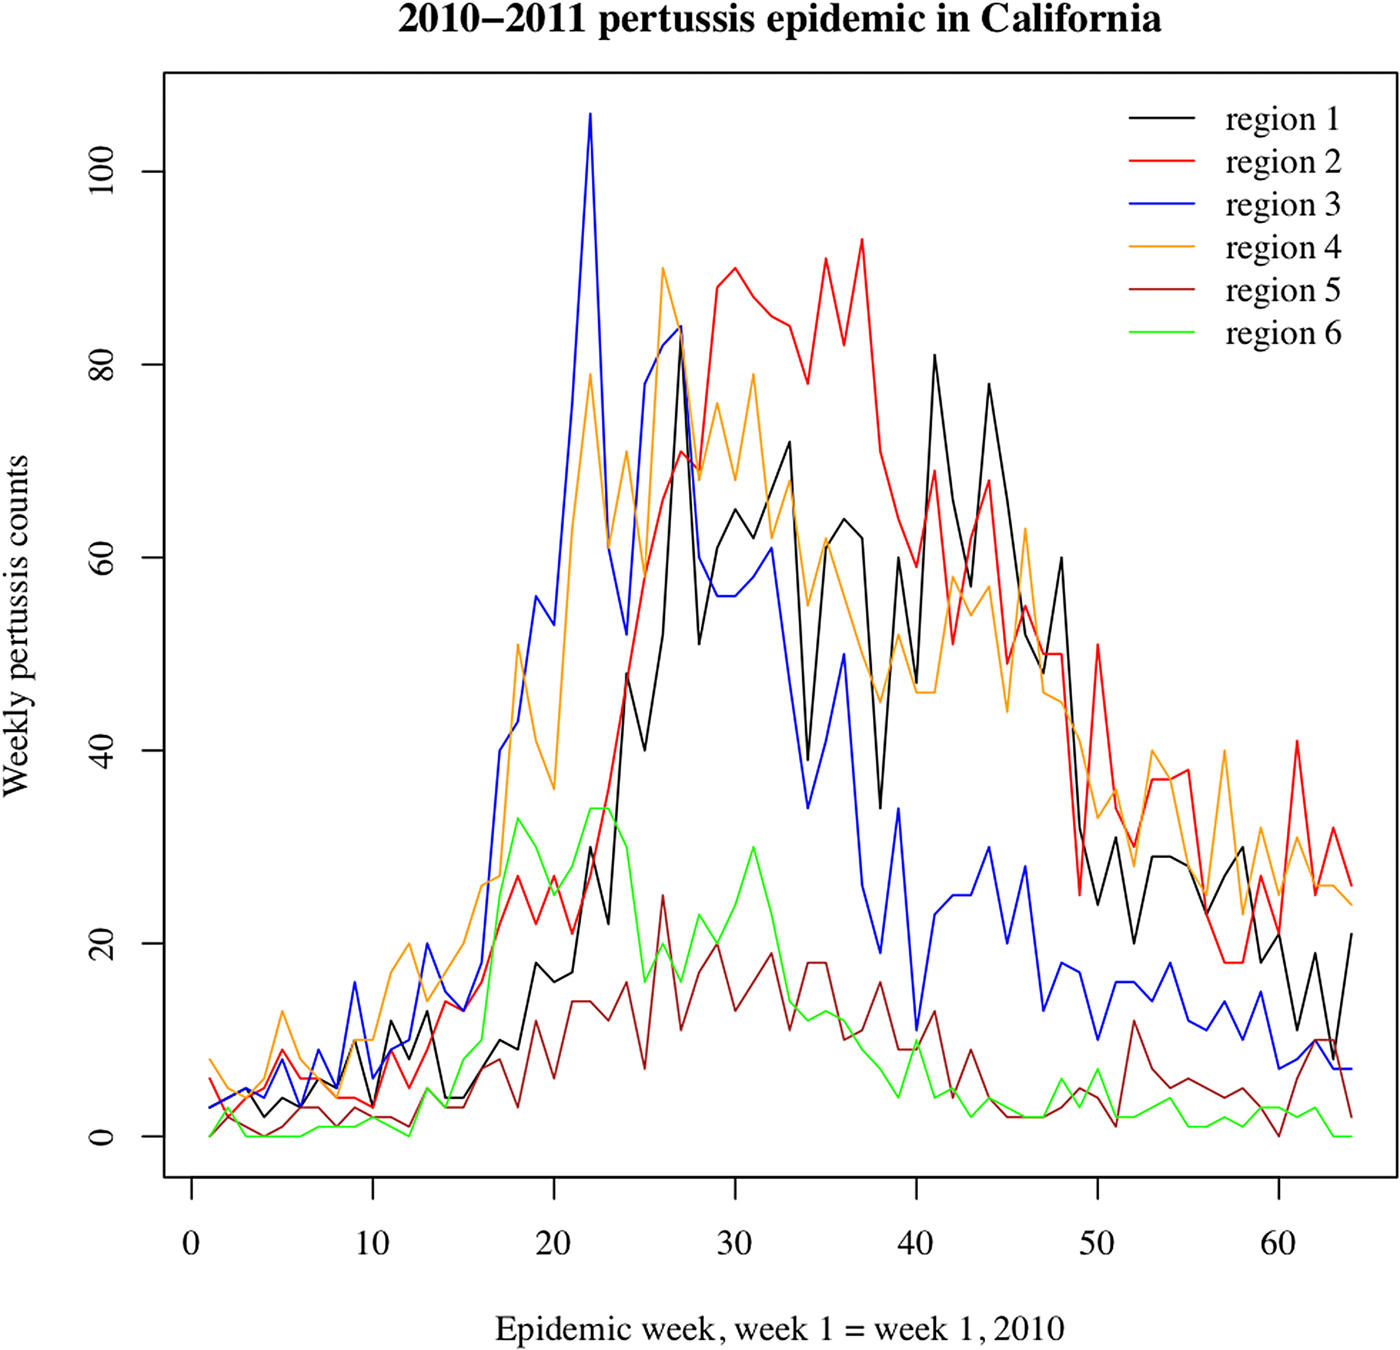
Fig. 1. Weekly pertussis incidence (cumulative counts for all ages) for the reported pertussis cases in different California regions (defined in Methods, as well as Table S1 in the Supporting Information) during the 2010–2011 epidemic.
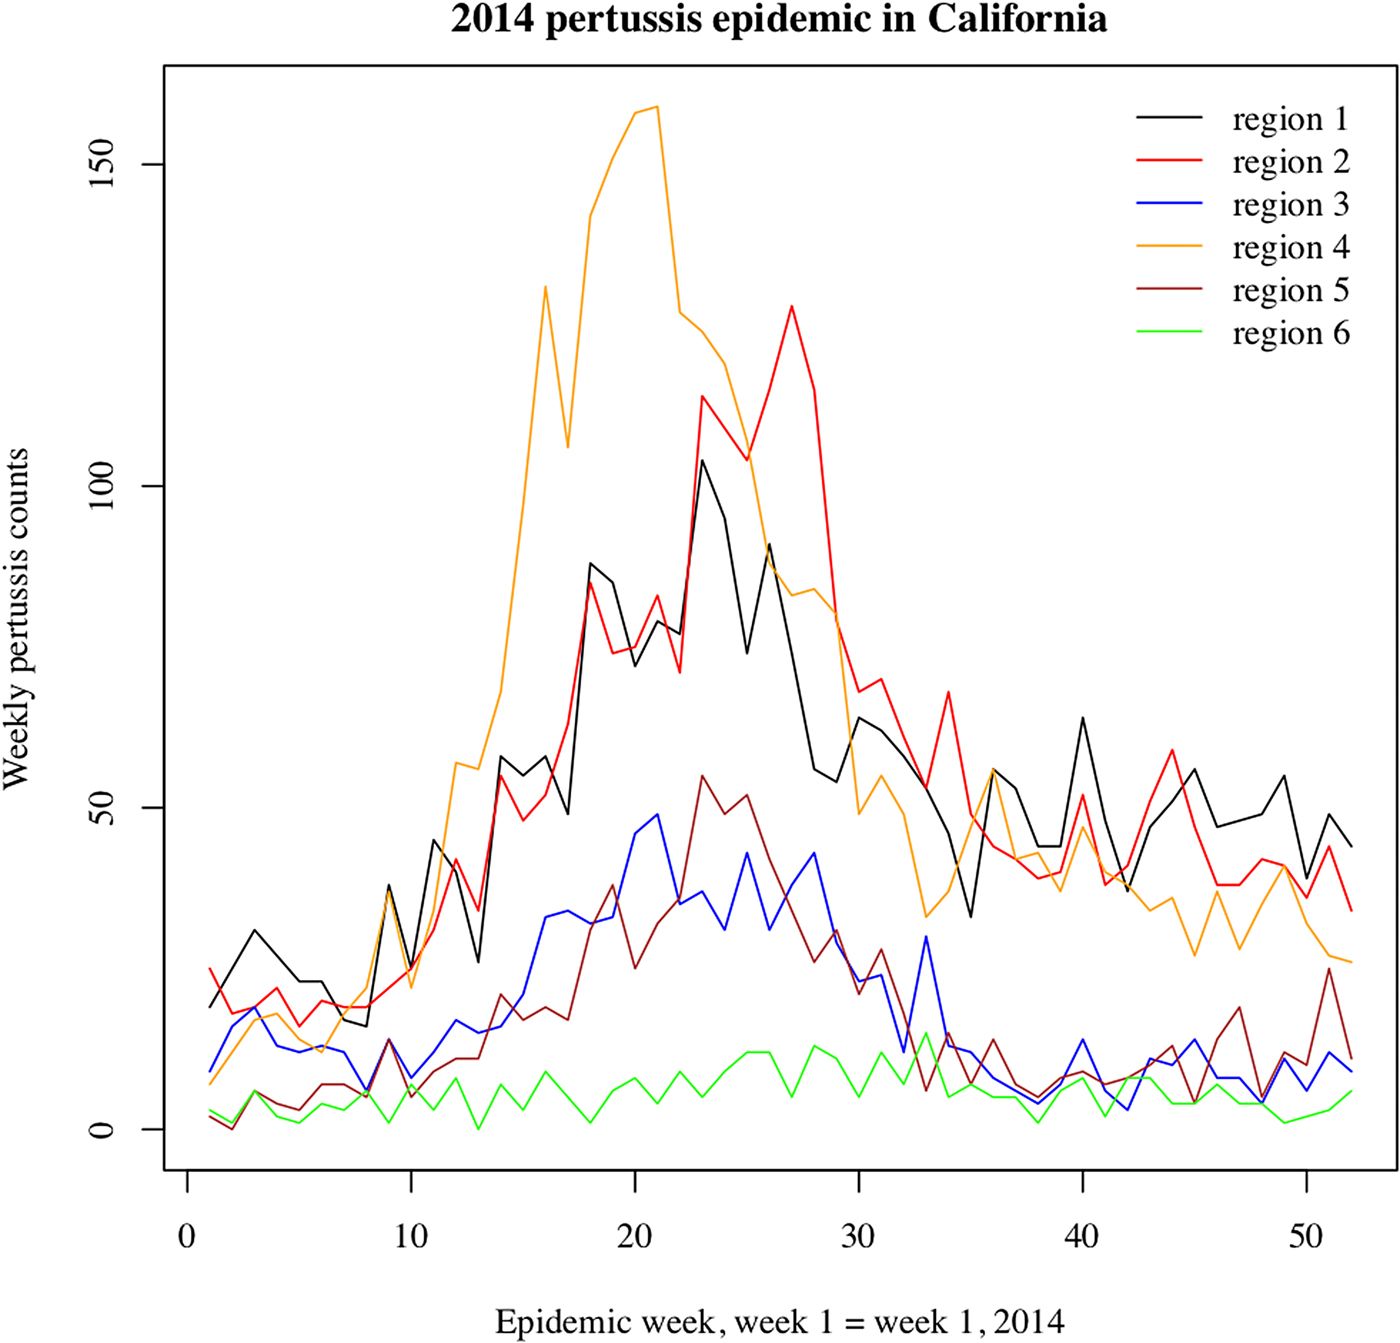
Fig. 2. Weekly pertussis incidence (cumulative counts for all ages) for the reported pertussis cases in different California regions (defined in Methods, as well as Table S1 in the Supporting Information) during the 2014 epidemic.
Statistical analysis
Previous work [Reference Winter, Zipprich and Harriman24] examined the rates of detected pertussis cases in different age groups for both the 2010 and the 2014 pertussis epidemics in California, comparing those rates for the two epidemics. Here, we used the previously defined methodology [Reference Worby16, Reference Worby20–Reference Goldstein22] to gain additional insight into the role of different age groups in propagating those epidemics. We categorised the cases into 10 age groups (at onset of illness), in years: (<1, 1–2, 3–4, 5–6, 7–8, 9–10, 11–13, 13–15, 14–15, 16–19, 20+). We used the region-specific outbreak peak times (namely weeks when the overall incidence of detected cases in a given region is highest) to determine whether reported cases occurred before or after the peak. The region-specific peak week t for reported cases (in all age groups) may not correspond to the peak week for the true incidence of pertussis infection in the community in that region because only a fraction of cases of pertussis infection is diagnosed and reported to the California Department of Public Health. To diminish the possibility of misclassification of cases as those occurring before or after the epidemic peak, we defined the regional before-the-peak period to be the period up to week t − 2 (inclusive), and the after-the-peak period to be the period starting week t + 2. Cases occurring during weeks t − 1 through t + 1 were excluded.
For the joint analysis for the included regions during each epidemic, for each age group g, cases occurring before the outbreak peak in each region were combined, with their total number denoted by B (g), and the same applies to cases occurring after the peak, with their number denoted by A (g). The estimated RR for each age group g is the ratio of the proportions of cases in the group g among all reported pertussis cases in the population before the peak and after the peak as in eq. 1 (here h in the sum runs over all age groups):
 $${\rm R}{\rm R}_E(g) = \displaystyle{{B\,(g)/\mathop \sum \nolimits_h B\,(h)} \over {A\,(g)/\mathop \sum \nolimits_h A\,(h)}}$$
The observed numbers of reported cases B (g) and A (g) in the age group g before and after the peak are binomially distributed. Moreover, we assume that the numbers of reported cases are sufficiently high so that the logarithm ln(RR(g)) of the RR in the age group g is approximately normally distributed ([Reference Altman25]). Under this approximation, the 95% confidence interval for RR (g) is exp(ln(RRE(g)) ± 1.96 · SE), where ln(RRE(g)) is estimated via eq. 1, and the standard error is
 $${\rm SE} = \sqrt {\displaystyle{1 \over {B\lpar g \rpar }} + \displaystyle{1 \over {A\lpar g \rpar }}-\left( {\displaystyle{1 \over {\mathop \sum \nolimits_h B\lpar h \rpar }} + \displaystyle{1 \over {\mathop \sum \nolimits_h A\lpar h \rpar }}} \right)} \; $$
Estimation of the RRs can also be performed in a Bayesian framework under the assumption that the proportion of cases of pertussis infection in each age group reported to the California Department of Public Health is small, which was found to be the case in other settings [Reference Rendi-Wagner26]. Details are given in section S3 of the Supporting Information.
Results
Figures 1 and 2 plot the weekly numbers of reported pertussis cases in the six California regions described in the Methods section for the 2010–2011 and the 2014 epidemics. We note that the regional incidence curves for the 2014 epidemic had more pronounced peaks compared with the regional incidence curves for the 2010–2011 epidemic. Figure 3 plots the incidence rates (per 100 000) for reported pertussis cased during the 2010–2011 and the 2014 epidemics in California for each of the age groups used in our analysis (Methods). Figure 3 suggests an upward shift in the age distribution for reported pertussis cases during the 2014 epidemic compared with the 2010–2011 epidemic, which agrees with the findings in [Reference Winter, Zipprich and Harriman24].

Fig. 3. Age-specific pertussis incidence rates (per 100 000) for reported pertussis cases during the (a) 2010–2011 epidemic (week 1, 2010 through week 12, 2011), and (b) 2014 epidemic (weeks 1–52, 2014).
Table 1 shows the estimates of the RR (eqns. 1 and 2) in the different age groups considered in our analyses for the 2010–2011 and the 2014 pertussis epidemics in California. For the 2010–11 epidemic, delineation of the groups with higher RR estimates showed modest evidence of a leading role for adolescents in transmission. The leading RR estimates were 1.26 (1.08–1.46) (adolescents aged 11–13 years); 1.19 (1.01–1.4) (children aged 9–10 years); 1.17 (0.86–1.59) (adolescents aged 14–15 years); 1.12 (0.86–1.46) (adolescents aged 16–19 years); and 1.1 (0.89, 1.36) (children aged 7–8 years). For the 2014 epidemic, a leading role for adolescents was clearer. The highest RR estimate belonged to adolescents aged 14–15 years (RR = 1.83, 95% CI 1.61–2.07), followed by adolescents aged 16–19 years (RR = 1.41, 1.24–1.61) and 11–13 years (RR = 1.26, 1.12–1.41), with lower RR estimates in other age groups.
Table 1. RR estimates for different age groups during the 2010–11 and the 2014 pertussis epidemics in California (eq. 1)

The age groups with the highest RR during each epidemic are highlighted.
Pairwise comparison of the role of individuals in different pairs of age groups during each epidemic is presented in section S2 of the Supporting Information. Additionally, estimates of the RR statistic in a Bayesian framework are given in section S3 of the Supporting Information, with the results being very similar to the results in Table 1.
Discussion
A good deal of uncertainty exists about the roles of individuals in different age groups in propagating the recent pertussis outbreaks. Moreover, the observed upward shift in the age distribution of reported pertussis cases for the more recent outbreaks (e.g. [Reference Winter18] vs. [Reference Winter19]) suggests the temporal changes in the role of different age groups during pertussis epidemics. In this paper, we use the previously developed methodology based on the RR statistic [Reference Worby20–Reference Goldstein22] to examine the roles of different age groups during the 2010 and the 2014 pertussis outbreaks in California, and compare those roles for the two epidemics. Our results suggest the prominence of adolescents aged 14–15 years during the 2014 pertussis epidemic, followed by adolescents aged 16–19 and 11–13 years. We also note that the highest rates of detected cases during the 2014 epidemic in California outside the infant age group belonged to adolescents aged 14–15 years (Fig. 3), and that the increase in the rates of detected pertussis cases for adolescents aged 12–17 years for the 2014 epidemic in California compared with the 2010 epidemic is documented in [Reference Winter, Zipprich and Harriman24]. For the 2010 pertussis epidemic in California, there was no strong differentiation in the role of different age groups based on the RR statistic, with the leading estimates of the RR statistic belonging to adolescents aged 11–13 years, followed closely by children aged 9–10 years, adolescents aged 14–15 and 16–19 years and children aged 7–8 years. Our earlier findings for the 2012 pertussis epidemics in Minnesota and Wisconsin [Reference Worby16, Reference Goldstein, Worby and Lipstich23] were consistent with the leading roles of adolescents aged 11–14 years during those outbreaks. The combination of the findings in this paper and the findings in [Reference Worby16, Reference Goldstein, Worby and Lipstich23] suggests that as time progressed, the prominence of older adolescents during pertussis outbreaks increased. This conclusion may be partly explained by the fact that adolescents of increasingly older age are covered entirely by the acellular pertussis vaccination series as the time from the introduction of acellular pertussis vaccines in different places grows [Reference Winter, Zipprich and Harriman24], while the receipt of acellular vaccines alone is less protective against pertussis compared with receipt of some whole-cell pertussis vaccination [Reference Witt4, Reference Sheridan5]. Correspondingly, older adolescents are expected to play the leading role during major future pertussis epidemics as well.
The findings of the prominence of older adolescents during the more recent pertussis outbreaks lead to questions about the protective effect of pertussis vaccination on individuals in those age groups, as well as the impact of vaccination on mitigating the spread of pertussis epidemics in the whole community, including severe cases of pertussis in infants. We note that another mechanism for protecting infants during pertussis outbreaks is maternal vaccination [Reference Winter, Zipprich and Harriman24, Reference Amirthalingam27]. Under the current pertussis vaccination schedule [14], Tdap vaccine is usually administered around the age of 11 years, and its effectiveness against reportable pertussis disease wanes with time since vaccine administration [Reference Koepke8, Reference Acosta10, Reference Breakwell28]. Moreover, the effectiveness of pertussis vaccines against infection and transmission to others may be lower compared with effectiveness against reportable pertussis disease, as suggested by a study of pertussis vaccination in baboons [Reference Warfel, Zimmerman and Merkel15]. While evidence about the herd immunity effects of DTaP is documented in the literature [Reference Domenech de Cellès17], the extent of the herd immunity effects of Tdap is less certain [Reference Worby16]. Further work is needed to better understand the effectiveness of acellular pertussis vaccines against infection and transmission to others. Such work should inform the potential impact and cost-effectiveness of modifications to the current pertussis vaccine schedule, such as vaccination of older adolescents, possibly with more efficacious vaccines against pertussis transmission than Tdap.
Our paper has some limitations. The relation between the RR statistic and the role played by individuals in a given age group during the outbreak is not entirely clear. The role of individuals in different age groups can be compared by comparing the effect of the distribution of a fixed quantity of a highly efficacious pertussis vaccine to members of one age group at a time at the beginning of an epidemic on the growth rate/reproductive number of the outbreak in the whole community. Our earlier work (see Supporting Information for each of the following papers [Reference Worby16, Reference Worby20, Reference Goldstein22]) had attempted to address this issue through simulations of transmission dynamics, finding a positive association between the RR statistic for a group and the per capita impact of vaccination in this group on the epidemic's initial growth rate/reproductive number. However, this conclusion required certain assumptions such as the distribution of susceptibility to infection in different age groups [Reference Goldstein22]. Additionally, the relative grading of different age groups according to the RR statistic does not depend on the differences in case reporting rates in different age groups, as long as case reporting rates do not change during the course of the outbreak. However, such changes are possible as awareness about the epidemic and the prominence of certain age groups may result in changes in testing and reporting practices during the course of the epidemic. For example, during the 2014 pertussis epidemic in California, the highest rates of detected cases outside the infant group were in adolescents aged 14–15 years (Fig. 3). If there was an increase in awareness about pertussis incidence in those adolescents during the epidemic, case-detection rates in that age group are expected to rise as the epidemic progressed, and there would be more detected cases in adolescents aged 14–15 years after the peak, biasing the RR estimate in that age group downward, while the RR estimate for adolescents aged 14–15 years was higher than in other age groups (Table 1). More generally, changes in case-detection rates due to awareness about the unusually high burden of pertussis disease in certain age groups are expected to bias the RR estimates towards the null, as suggested by the 2011 pertussis epidemic in England [Reference Bento29]. This novelty/change in awareness factor may be more true for the 2010 epidemic compared with the 2014 epidemic, where we were able to detect a strong signal despite potential biases towards the null.
In summary, our results suggest the shift in the role of different age groups during the 2014 pertussis epidemic in California compared with the 2010 epidemic, including the prominence of adolescents aged 14–15 years during the 2014 epidemic. Additionally, older adolescents played a more prominent role during the 2014 pertussis epidemic in California compared with the 2012 pertussis outbreaks in Minnesota and Wisconsin [Reference Worby16, Reference Goldstein, Worby and Lipstich23]. Those findings are in agreement with the notion that as the time from the introduction of acellular pertussis vaccines in different places grows, older adolescents will be covered entirely by the acellular pertussis vaccination series, which is less protective against pertussis compared with receipt of some whole-cell pertussis vaccination, particularly the priming dose [Reference Witt4, Reference Sheridan5]. Moreover, under the current pertussis vaccination schedule, the Tdap vaccine is usually administered around the age of 11 years, and its effectiveness wanes with time [Reference Koepke8, Reference Acosta10, Reference Breakwell28]. All of these suggest that older adolescents are expected to play a leading role in major future pertussis outbreaks as well. Pertussis activity in the USA has decreased in the last few years, presumably at least partly due to the immunity imparted during high levels of B. pertussis circulation between 2010 and 2014 [1]. Pertussis activity is expected to increase with time as the population immunity wanes, and there is a need to examine various questions related to pertussis vaccination policies to better manage future outbreaks. One of those questions is the potential utility of vaccinating older adolescents with the aim of mitigating the spread of pertussis in the whole community, including the disease burden in infants. Such vaccination strategies require pertussis vaccines with high effectiveness in preventing pertussis infection and transmission to others, rather than just pertussis disease [Reference Warfel, Zimmerman and Merkel15]. There is uncertainty about the effectiveness of Tdap in preventing pertussis infection and transmission to others (which may be different from effectiveness against detectable symptomatic pertussis disease in vaccine recipients), as well as the temporal waning of such effectiveness. Further work is needed in this direction, such as the study of the potential effect of the deployment of more efficacious vaccines against pertussis infection in adolescents, including as the impact of booster vaccination for older adolescents on the spread of pertussis in the whole community, including disease rates in infants.
Supplementary material
The supplementary material for this article can be found at https://doi.org/10.1017/S0950268819000761
Author ORCIDs
Ayesha Mahmud, 0000-0002-2282-8613.
Acknowledgement
We thank Sarah New, Kathleen Winter and Kathleen Harriman of the California Department of Public Health, Immunization Branch for providing the data used in the analyses, and for helpful suggestions on the manuscript.
Author contributions
Designed the study (AM, EG); performed the inference (AM, EG); wrote the manuscript (AM, EG, ML)
Financial support
This work was supported by the National Institute of General Medical Sciences (Award Number U54GM088558). The content is solely the responsibility of the authors and does not necessarily represent the official views of the National Institute Of General Medical Sciences.
Conflict of interest
Dr Lipsitch reports grants from NIH/NIGMS, during the conduct of the study; personal fees from Affinivax, personal fees from Merck, grants and personal fees from Pfizer, grants from PATH Vaccine Solutions, outside the submitted work. The other authors report no conflicts of interests.


 Open access