


Introduction
Atom probe tomography (APT) provides 3D elemental mapping, typically with sub-nanometer resolution (De Geuser & Gault, Reference De Geuser and Gault2020; Gault et al., Reference Gault, Chiaramonti, Cojocaru-Mirédin, Stender, Dubosq, Freysoldt, Makineni, Li, Moody and Cairney2021), and an elemental sensitivity down to the range of tens of parts per million (Haley et al., Reference Haley, London and Moody2020). Deploying these capabilities of APT to study wet chemical systems has been hindered by the lack of available specimen preparation strategies for frozen liquids. Early efforts in this direction were reported (Stintz & Panitz, Reference Stintz and Panitz1991, Reference Stintz and Panitz1992; Pinkerton et al., Reference Pinkerton, Scovell, Johnson, Xia, Medvedev and Stuve1999); however, no workflows have established the use of the APT technique for routine analyses of frozen liquids. This contrasts with transmission electron microscopy (TEM), which over the past decades has seen tremendous developments in standardized workflows allowing preparation and handling of specimens at cryogenic temperature (Livesey et al., Reference Livesey, del Campo, McDowall and Stasny1991; Marko et al., Reference Marko, Hsieh, Schalek, Frank and Mannella2007; Parmenter & Nizamudeen, Reference Parmenter and Nizamudeen2021), as well as the analysis of liquids via graphene encapsulation (Park et al., Reference Park, Elmlund, Ercius, Yuk, Limmer, Chen, Kim, Han, Weitz, Zettl and Alivisatos2015), recently achieving atomic resolution (Nakane et al., Reference Nakane, Kotecha, Sente, McMullan, Masiulis, Brown, Grigoras, Malinauskaite, Malinauskas, Miehling, Uchański, Yu, Karia, Pechnikova, de Jong, Keizer, Bischoff, McCormack, Tiemeijer, Hardwick, Chirgadze, Murshudov, Aricescu and Scheres2020).
For routine APT analysis, all data is acquired at a cryogenic base temperature (typically 20–80 K), but the preparation of specimens by electrochemical polishing (Miller, Reference Miller2000) or focused-ion beam (FIB) (Prosa & Larson, Reference Prosa and Larson2017) is typically performed at room temperature. There have been efforts to perform electrochemical polishing at temperatures in the range of −30°C (Lefebvre et al., Reference Lefebvre, Loiseau and Menand2002; Dumitraschkewitz et al., Reference Dumitraschkewitz, Uggowitzer, Gerstl, Löffler and Pogatscher2019). Ongoing worldwide efforts aimed at pushing the development of “cryo-APT” for specimen preparation and specimen transfer (Perea et al., Reference Perea, Gerstl, Chin, Hirschi and Evans2017; Stephenson et al., Reference Stephenson, Szczepaniak, Mouton, Rusitzka, Breen, Tezins, Sturm, Vogel, Chang, Kontis, Rosenthal, Shepard, Maier, Kelly, Raabe and Gault2018; McCarroll et al., Reference McCarroll, Bagot, Devaraj, Perea and Cairney2020) might help taking a step forward in the feasibility of APT analysis of layers of liquids or liquids embedded into a hard structure—see for instance the recent reports of APT analysis of n hydrated glass by Schreiber et al. (Reference Schreiber, Perea, Ryan, Evans and Vienna2018) and Perea et al. (Reference Perea, Schreiber, Ryan, Wirth, Deng, Lu, Du and Vienna2020)—and the associated solid–liquid interface. Efforts involving graphene encapsulation akin to a liquid cell for TEM have been reported by the group at Monash–Deakin (Qiu et al., Reference Qiu, Garg, Zhang, Chen, Li, Taylor, Marceau and Fu2020a, Reference Qiu, Zheng, Garg, Chen, Gervinskas, Li, Dunstone, Marceau and Fu2020b). The liquid is sandwiched between a single graphene sheet and a sharpened metallic needle. The liquid volume was very small and the freezing was uncontrolled, leaving many questions unanswered as to whether the distribution of elements within the liquid was affected by the freezing process.
To enable precise analyses on larger volumes, which are more relevant to nanoparticles or biological systems, advanced strategies for specimen preparation and systematic studies are necessary to assess the performance limits of cryo-APT. The development of these methods could, in part, borrow from the biological sciences—for instance, cryo-scanning electron microscopy (SEM) and cryo-FIB are more common in biology, but are now emerging in APT (Schreiber et al., Reference Schreiber, Perea, Ryan, Evans and Vienna2018; Chang et al., Reference Chang, Lu, Guénolé, Stephenson, Szczpaniak, Kontis, Ackerman, Dear, Mouton, Zhong, Raabe, Gault, Zhang, Dye, Liebscher, Ponge, Korte-Kerze, Raabe and Gault2019; Lilensten & Gault, Reference Lilensten and Gault2020; Rivas et al., Reference Rivas, Babayigit, Conings, Schwarz, Sturm, Manjón, Cojocaru-Mirédin, Gault, Renner, Garzón Manjón, Cojocaru-Mirédin, Gault, Renner, Manjón, Cojocaru-Mirédin, Gault and Renner2020). Such protocols could unlock the potential for APT of carbon-based materials, and even go beyond the studies scattered across the literature (Panitz, Reference Panitz1982; Gault et al., Reference Gault, Yang, Ratinac, Zheng, Braet and Ringer2009; Prosa et al., Reference Prosa, Kostrna Keeney and Kelly2010; Narayan et al., Reference Narayan, Prosa, Fu, Kelly and Subramaniam2012; Nickerson et al., Reference Nickerson, Karahka and Kreuzer2015; Perea et al., Reference Perea, Liu, Bartrand, Dicken, Thevuthasan, Browning and Evans2016; Eder et al., Reference Eder, Felfer, Gault, Ceguerra, La Fontaine, Masters, Maschmeyer and Cairney2017; Rusitzka et al., Reference Rusitzka, Stephenson, Szczepaniak, Gremer, Raabe, Willbold and Gault2018). In addition, they could offer an opportunity to study active materials, e.g. catalysts, in their native or in operando environment. Typically, conventional FIB-based preparation methods remove samples and embed in them in a foreign medium, which may alter or damage them (Felfer et al., Reference Felfer, Li, Eder, Galinski, Magyar, Bell, Smith, Kruse, Ringer and Cairney2015; El-Zoka et al., Reference El-Zoka, Langelier, Botton and Newman2017; Kim et al., Reference Kim, Kang, Park, Seol, Ahn, Lee and Choi2018, Reference Kim, Lee, Ahn and Choi2019). Near-atomic scale analysis of “bulk” ice may also lead to insights into the behavior of solutes in solution for instance, including distribution of impurities or segregation in natural ice.
Here, we discuss the details of two recently developed specimen preparation strategies that have enabled the APT analysis of frozen water, frozen water-based solutions, and embedded nanostructures. The first approach utilizes liquid-nitrogen (LN2) plunge-freezing a flat nanoporous gold (NPG) film previously immersed in water. The ice film is subsequently turned into a needle using a moat-type approach (Halpin et al., Reference Halpin, Webster, Gardner, Moody, Bagot and MacLaren2019). The second approach utilizes a commercial plunge-freezing device leading to the likely formation of ice from a droplet deposited with a micro-pipette on top of a wire-shaped blank. The droplet is then reduced into a sharp needle by annular milling. Both protocols, i.e. on the flat substrate or the wire, then involve cryo-vacuum transfer into an atom probe for analysis. APT data from both approaches are shown and briefly compared. The challenges inherent to these two approaches are also discussed, as well as some of the key problems that will need a community effort to be tackled, to fully enable routine APT analysis of frozen liquids.
Porous-Flat-Substrate-Based Preparation
Overview
This first approach makes use of the infrastructure of the Laplace project detailed by Stephenson et al. ( Reference Stephenson, Szczepaniak, Mouton, Rusitzka, Breen, Tezins, Sturm, Vogel, Chang, Kontis, Rosenthal, Shepard, Maier, Kelly, Raabe and Gault2018). As summarized in Figure 1, the complete workflow from the freezing to the APT analysis without breaking ultra-high vacuum and cryogenic temperature during transferring involves four main steps, all described in the sections below.

Fig. 1. Workflow adopted for the analysis of frozen liquids on flat substrates. (a) Sample is frozen in an LN2-filled dewar. (b) Sample is transferred inside a UHVCT. (c) APT tips are fabricated inside the cryo-PFIB. (d) APT tips are analyzed in the CAMECA LEAP 5000XS.
Formation of the NPG
NPG is formed by the dealloying of Ag in acidic, oxidizing conditions from a solid solution of Ag–Au (Newman, Reference Newman, Cottis, Graham, Lindsay, Lyon, Richardson, Scantlebury and Stott2010; Erlebacher et al., Reference Erlebacher, Newman, Sieradzki, Wittstock, Biener, Erlebacher and Bäumer2012). The selective dissolution of Ag occurs concurrently with the surface diffusion of Au, leading to the formation of a three-dimensional, open-pore, bicontinuous structure. Pore/ligament sizes could be as fine as 3–20 nm (El-Zoka et al., Reference El-Zoka, Langelier, Korinek, Botton and Newman2018; Reference El-Zoka, Howe, Newman and Perovic2019). NPG exhibits a high surface-area-to-volume ratio and as such has found potential applications in electrochemical sensing and actuation (Xue et al., Reference Xue, Markmann, Duan, Weissmüller and Huber2014), as well as in catalysis (Zugic et al., Reference Zugic, Wang, Heine, Zakharov, Lechner, Stach, Biener, Salmeron, Madix and Friend2017). Note the considerable hydrophilicity of NPG compared to flat polycrystalline Au (Raspal et al., Reference Raspal, Awitor, Massard, Feschet-Chassot, Bokalawela and Johnson2012), and that solutions can penetrate well into the thickness of NPG (El-Zoka et al., Reference El-Zoka, Langelier, Botton and Newman2017). We sought to take advantage of NPG as a substrate for APT analysis of frozen water and salt-water solution. An Ag77Au23 foil with a nominal area of ~1 cm2 and a thickness of 150 μm was first mechanically polished and then annealed for 1 h at 900°C in an Ar atmosphere. The foil was immersed for 5 min in an aqueous solution of 65% nitric acid. The foil was then transferred into heavy water, i.e. D2O (Sigma-Aldrich, Germany, 99.9 at% D (Deuterium)) in order to stop the dealloying. The foil was then mounted on a commercial clip holder, typically used to hold Si-microtip coupons in the CAMECA atom probes. Once mounted, the sample is left immersed in D2O overnight at room temperature to avoid drying.
Manual Plunge-Freezing and Specimen Transfer
The immersed clip-holder was first removed from the water. A paper-fiber cleaning wipe (Kimwipe) was then used to gently blot the surface, leaving behind a thin water film on the surface, thereby avoiding excessively large volumes of ice forming on the foil's surface. The freezing of the water film was achieved by manually plunge freezing the water-bearing NPG foil on the clip-holder into dry liquid N2 for approximately 5 min, and under a constant flow of dry liquid N2. To avoid frosting, the entire process took place inside a glovebox, as shown in Figure 2, with the oxygen level and the dew point maintained below 1 ppm and below −99°C, respectively. The sample holder was then mounted directly into the ultra-high vacuum cryogenic transfer (UHVCT) unit attached onto the glovebox. The UHVCT is connected through a fast pump down docking station, partly built from commercial components from Ferrovac GmbH, equipped with a primary and turbo-molecular pumping system, as well as a cryo-pump, which can achieve UHV conditions within less than 5 min. The sample stage in the UHVCT was pre-cooled by the contact with a cryo-finger that connects to an LN2 dewar. This infrastructure is detailed in Stephenson et al. (Reference Stephenson, Szczepaniak, Mouton, Rusitzka, Breen, Tezins, Sturm, Vogel, Chang, Kontis, Rosenthal, Shepard, Maier, Kelly, Raabe and Gault2018).

Fig. 2. (a) Schematic view of the setup for the preparation on NPG; (b) photo of the clip-holder and the water-bearing NPG foil, showing the top view of (a); (c,d) schematic and photo of the plunge-freezing setup; (e) photo of the glovebox (Images in (b,c) are from El-Zoka et al. (Reference El-Zoka, Kim, Deville, Newman, Stephenson and Gault2020) reused under a CC-BY-NC license.)
Cryo-PFIB
The UHVCT is docked onto a dual-beam SEM/FIB FEI Helios PFIB (Xe plasma FIB). A custom-designed stage is cooled by a set of copper bands connected to a cold finger fitted onto a dewar filled with LN2, and isolated from the microscope's body by spacers made of polyether ether ketone (PEEK). The stage was designed to accommodate a commercial CAMECA APT sample holder, known and referred to as a puck. Following transfer, we imaged the ice layer by SEM and performed cross-sectional imaging to visualize the details of the ice layer.
To obtain a specimen suitable for APT analysis, we adapted the protocol of Halpin et al. (Reference Halpin, Webster, Gardner, Moody, Bagot and MacLaren2019) to prepare a pillar that is accessible to the laser illumination within the atom probe itself. The pillar is shaped into a needle by a series of annular patterns. The Xe ion currents were progressively adjusted from 1.3 μA down to 0.5 μA, and finally 15 nA. The acceleration voltage was maintained at 30 kV to form the central pillar on which the final specimen was later prepared. These steps are detailed in Figure 3a, and an image of the final pillar is shown in Figure 3b. No obvious voids or gaps between the ice and the NPG could be seen following FIB-milling. The final sharpening of the specimen was achieved by reducing both the inner and outer diameters of the annular milling pattern and reducing the current progressively from 4 and then to 1 nA (smallest current used in this method). We ensured that the length of the ice layer inside the specimen was consistently below 5 mm. The finalized specimen is shown in Figure 3c.

Fig. 3. (a) SEM image of the edge of the water droplet on the NPG and indicative position of the specimen with the outer diameter of the annular pattern and current used to mill the pillar. (b) Au pillar with the ice layer. (c) Sharpened APT specimen of ice on the NPG. (Images in (b,c) are from El-Zoka et al. (Reference El-Zoka, Kim, Deville, Newman, Stephenson and Gault2020) reused under a CC-BY-NC license.)
Following the shaping of the specimen, the puck is transferred back into the LN2-cooled UHVCT via a UHV side chamber kept at approximately −160°C. The transfer time is below 15 s. We detached the UHVCT from the PFIB and mounted it for a direct transfer into the buffer chamber of a CAMECA LEAP 5000XS, onto a pre-cooled piggyback puck placed into a slot on the carousel insulated from the rest of the microscope made by PEEK. The puck is hence passively cooled until being transferred into the atom probe analysis chamber.
Atom Probe Tomography
The APT analyses were performed using a CAMECA local electrode atom probe (LEAP) 5000 XS (CAMECA Instruments, USA). The data was acquired in laser-pulsing mode with a pulse energy in the range of 20–100 pJ at a base temperature of 70 K. The Integrated Visualization and Analysis Software (IVAS) 3.8.4 was used for data reconstruction and analysis. Custom MATLAB routines were used for calculating and displaying correlation histograms. Figure 4 is a summary of the main results. The voltage versus the number of acquired ions in Figure 4a shows a rather smooth evolution of the voltage, indicating no major bursts of detection or specimen fracture. Figure 4b is the corresponding detector impact histogram, with some regions of high impact density (in green) and low impact density (in blue). Figures 4c and 4d, respectively, show a scanning electron micrograph of the finalized specimen and the corresponding reconstruction in which all D2O molecular ions are displayed as individual blue dots. The default reconstruction parameters were used, and the atomic volume of oxygen was used as a basis for the depth increment calculation (Gault et al., Reference Gault, Haley, de Geuser, Moody, Marquis, Larson and Geiser2011).

Fig. 4. (a,b) Voltage curve and detector hit map obtained from an ice specimen shown in (c). (d) Tomographic reconstruction obtained from this dataset (acquired using a CAMECA LEAP 5000XS). (Images in the figure are from El-Zoka et al. (Reference El-Zoka, Kim, Deville, Newman, Stephenson and Gault2020) reused under a CC-BY-NC license.)
Preparation on wires
Overview
The wire approach presented in this section borrows even more from the workflows for cryogenic imaging of biological samples. Gerstl & Wepf (Reference Gerstl and Wepf2015) had discussed before the use of plunge freezing and plasma FIB-fabricated vessels to facilitate the preparation of frozen liquid APT tips. A suite of commercial equipment from Leica was used: a vacuum-cryo-manipulation system (EM VCM), a high vacuum coater (EM ACE600), and a cryo-vacuum shuttle (EM VCT500). The used Ga-FIB Instrument (Scios FEI) was equipped with a dedicated cryo-stage to keep samples at a minimum temperature of 130 K. The stage is connected by copper stripes to an LN2 dewar mounted at a custom-made side flange, to keep the whole cooling process in minimal vibration. The stage was further modified to adapt a standard APT sample holder. The FIB is equipped with an EasyLift™ micromanipulator, which limits the preparation possibilities at cryogenic temperatures, since it operates at room temperature. Therefore, the standard lift-out procedure was not readily possible, conversely to the protocol demonstrated by Schreiber et al. (Reference Schreiber, Perea, Ryan, Evans and Vienna2018). Figure 5 summarizes the complete workflow from the freezing to the APT analysis. The main difference in this workflow compared to the previous one is the use of pre-sharpened wire blanks with a flat, rough surface.

Fig. 5. Workflow adopted for the analysis of frozen liquids on wire blanks. (a) Sample is frozen in the vacuum-cryo-manipulation system. (b) Sample is transferred inside the VCT500 to the high-vacuum coater for freeze etching. (c–e) Samples are transferred to the Scios FEI for APT tip fabrication. (f) Finally, tip is analyzed in the Inspico-AP.
Dipping Technique for Viscous Liquids on Pre-shaped Wires
Tungsten (W) was selected as a substrate material owing, in part, to its wide availability in most laboratories, as it is a well-established test material for APT. Following the common specimen preparation technique for sputter-deposited layers, where pre-shaped tungsten tips are used as template, we attempted making needle-shaped W specimen suitable for APT analysis. The needles were prepared by dipping a pure W-wire into a 2 M NaOH solution while applying an AC voltage of 3–7 V, which lead to the formation of a neck in the middle of the wire. The final shape was achieved by switching to a pulsed voltage of 2–3 V up to the point where the wire breaks into two parts. Needles with a typical end radius below 100 nm were subsequently dipped in honey and imaged in the SEM upon freezing to −150°C. The fluid, despite its high viscosity, did not stick to the needle's end but migrated along the shank. This might be attributed to the low radius of curvature of the tip apex, not compatible with the surface tension of the liquid and the low contact angle, as displayed in Figure 6.

Fig. 6. Representative dipping results for W wires with different sample geometries in honey. (a) Etched W-tip, (b) W-tip that is etched and cut, and (c) a pristine W-wire.
In the next step, the apex of the tip was removed by subsequent FIB cutting. As a result, a tungsten post with a diameter of approximately 2 μm was fabricated, turning it into a flat top blank. Yet, the result was the same and the drop of fluid did not adhere on top of the post but further down the shank, making this approach unfit for making APT specimens from frozen fluids.
Our goal was to produce droplets as small as possible, since any increase in a diameter of the droplet would result in a dramatic increase in later FIB annular milling processes to produce a suitable tip. Consequently, we increased the post diameter by using commercially available tungsten wires (from 20 to 100 μm). First positive results of droplets sticking to the flat surface of the post were achieved using 75 μm thick wires. Needless to mention, that the production of flat post with a 75 μm diameter using the FIB was a time-consuming procedure and not applicable for fast sample throughput. To get access to a fast-available substrate, we decided to omit any pre-preparation using the FIB instrument.
A tungsten wire, 75 μm in diameter, was first cooled to liquid nitrogen temperature (−196°C). At such low temperatures, for tungsten in a body-centered cubic crystal structure, brittle fracture with small plastic deformation and neck formation can be expected. The wire was fractured by applying a tensile force with two pincers which were also cooled down before. The fractured surface is, as illustrated in Figures 7a and 7b, about 50 μm in diameter due to some necking, very rough, with cracks and crevices oriented along the wire's main axis (Fig. 7b), and hence offering a much wider surface area and enhancing the likelihood that enough fluid would remain on the blank's top surface. After the creation of the rough surface, the respective tungsten post is dipped into the high viscosity liquid. The post with the formed droplet on its top is plunged frozen in an LN2 bath. Adjacent transfer of the cooled sample into the Leica VCT 500 Shuttle and suitable pumping sequences allow to follow the further preparation route.

Fig. 7. Scanning electron micrographs (a) of the fractured wired, and (b) close-up on the fractured surface itself; (c) honey drop located at the blank's tip, and (d) the metal–honey interface after the initial annular milling, and (e) pillar ready for final shaping into an APT specimen.
Freezing of Water Droplets
As shown in the previous subsection, the dipping technique using flat tungsten posts works well for high viscosity fluids such as honey. Using this method, it was possible to freeze droplets of reasonable size on top of the post. But for liquids with low viscosity (water, heavy water, and NaCl aqueous solutions), all attempts failed to create a similar droplet on the surface. Only a very thin layer of a few tens of nanometer was detectable, stemming most likely from moisture condensed on the cold wire during transfer.
So, for low viscosity liquids (Schwarz et al., Reference Schwarz, Weikum, Meng, Hadjixenophontos, Dietrich, Kästner, Stender and Schmitz2020), the protocol changed in that way, that the post is first mounted on a sample holder and placed into an LN2 bath (Leica EM VCM). The nitrogen atmosphere above the liquid protects the wire against the condensation of moisture from the surrounding atmosphere. A water droplet is dipped with a micropipette onto the precooled tungsten post, which is stored in the LN2 bath (Fig. 8). The droplet forming at the nozzle of the micropipette is dipped onto the pre-cooled tungsten post in a free-fall mode so that it does not touch the metal surface before it is constricted. Falling below the critical distance can cause the liquid to stick to the shaft of the post. If possible, only one dipping process should be done, because each additional dipping creates an interface between the two droplets, which is a typical point at which the upper material breaks off during the milling process.

Fig. 8. Summary of the approach for making frozen droplets and shaping them as needles for APT. (SEM images are from Schwarz et al. (Reference Schwarz, Weikum, Meng, Hadjixenophontos, Dietrich, Kästner, Stender and Schmitz2020) reused under a CC-BY-NC license.)
We used pure water, deionized, and filtered through a commercial Millipore Milli-Q system (purity characterized in terms of resistivity ρ > 18 MΩ⋅cm). The high purity should prevent additional peaks from appearing in the mass spectrum. The frozen droplet is 100–200 μm long and 150–250 μm in diameter, and can subsequently be turned into a needle-shaped specimen suitable for APT. This approach is summarized in Figure 8.
Hereupon, the sample holder is transferred into the cooled body of the modified transfer shuttle VCT500 from Leica (T = −164°C), which is initially pumped by an oil-free scroll pump to a pressure of 6⋅10−1 mbar. During the short pumping sequence, the sample may have come into contact with ambient air, and consequentially forming a frost layer on the droplet surface. To allow the transfer into the FIB, the vacuum has to be improved by a further intermediate step. The shuttle is attached to the high vacuum coater (Leica EM ACE600; Fig. 4), in which a freeze etching process can be carried out to remove ice crystals that are formed by the contact with air. By heating up the sample very precisely to a temperature of −90°C and a pressure of 9⋅10−7 mbar for 30 min, a sublimation process from solid ice to vaporous ice occurs, which allows the controlled removal of condensed ice from the environment. On the other hand, the Leica EM ACE600 high vacuum coater is necessary to improve the vacuum conditions inside the VCT500 shuttle into a range of 10−4 mbar, which is a necessary precondition for the transfer into the FIB. Pressure at an insufficient level in the shuttle should be avoided, as it will trigger an auto-shutdown of the FIB as a protection of the system.
FIB Milling
Following freeze etching, the VCT500 is used to transfer the frozen sample into an FEI Scios SEM/FIB via a dedicated load lock. The SEM/FIB is equipped with a custom-designed cryo-stage. The stage is cooled by copper bands connected to a dewar filled with LN2, allowing to reach a temperature down to approximately −150°C. A cryo-shield (Stephenson et al., Reference Stephenson, Szczepaniak, Mouton, Rusitzka, Breen, Tezins, Sturm, Vogel, Chang, Kontis, Rosenthal, Shepard, Maier, Kelly, Raabe and Gault2018) is also connected to the dewar, to act as a cold trap and help avoiding re-deposition on the sample during the preparation of the needle-shaped specimen. SEM imaging was typically performed using low acceleration voltage, i.e. 5 kV, and beam current of 25 pA and only by taking snapshots of high scanning speed to prevent sublimation of the sample by electron bombardment. Live imaging of the sample or intense focusing could result in fast melting of the adhered droplet.
Following previously reported preparation protocols, the sample is tilted to 52° for annular milling (Prosa & Larson, Reference Prosa and Larson2017). An annular pattern was used, which mills from the outer to the inner part. In the first step, all protruding parts of the droplet (Ø 150–250 μm) are cut away at 30 kV acceleration voltage and a very high ion beam current, ~50 nA, until the edges of the 50 μm diameter tungsten substrate are visible. The ion beam current is then progressively reduced to 0.1 pA along with the inner diameter of the annular milling pattern, down to 600 nm. The precise current and dimensions of the annular pattern are reported in Table 1. SEM imaging is performed intermittently to monitor the progress of the specimen's shaping, as shown in Figure 9. The finished specimen, with an end radius in the range of below 100 nm, is finally transferred into the APT via the VCT500. The reproducibility of the approach is highlighted by the six different specimens, as shown in Figures 10a–10f. The time required for fabricating an APT-ready tip is subject to the liquid, size of the droplet, and the thickness of the material on the post, but it can be said that the average preparation time is about 3–5 h per specimen.
Table 1. Currents and Size of the Annular Pattern Used Through the FIB-Preparation Process.


Fig. 9. (a–i) Scanning electron micrographs showing the various steps of the preparation process from the large drop to the needle-shaped specimen suitable for APT. (Images in (a,h,i) are from Schwarz et al. (Reference Schwarz, Weikum, Meng, Hadjixenophontos, Dietrich, Kästner, Stender and Schmitz2020) reused under a CC-BY-NC license.)

Fig. 10. (a–f) Six different needles presented in order to show the reproducibility of the length and the shape of the specimen.
Atom Probe Analysis
APT analysis was performed on a custom-made atom probe (Schlesiger et al., Reference Schlesiger, Oberdorfer, Wurz, Greiwe, Stender, Artmeier, Pelka, Spaleck and Schmitz2010), equipped with a ClarkMXR laser system with a fundamental wavelength of 1030 nm, similar to the instrument commercialized by Inspico. By usage of the second and third harmonics, the laser wavelength can be varied between 515 and 355 nm. The system has been modified to accommodate the VCT500 and to enable a fast exchange of the cryogenic samples. The data from the ice specimens was acquired in laser-pulsing mode, with 250 fs laser pulses at a wavelength of 355 nm, focused to a spot size of approximately 50 μm and a repetition rate of 100 kHz. The detector comprises microchannel plates with an open area of 50% and a delay-line detector with a diameter of 120 mm. The sample for APT analysis was cooled down to 63 K. Volume reconstruction was performed following the original point projection method by Bas et al. (Reference Bas, Bostel, Deconihout and Blavette1995) using the specimen radius derived from the method proposed by Jeske & Schmitz (Reference Jeske and Schmitz2001). The resulting datasets were analyzed using Inspico's Scito software package. SEM pictures were used to determine the initial specimen radius, but high-resolution imaging could not be performed due to the possible melting of the sample. Therefore, the respective value has a rather large error.
Discussion
Specimen Preparation Strategy
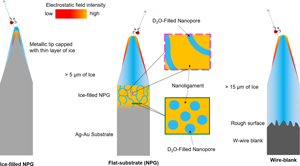
Both approaches described above have yielded results, yet they remain as preliminary efforts, and the protocols implemented will be refined over time. Here, the field evaporation takes place through a thick layer of ice formed on a flat substrate, which contrasts with previous reports: where a thin layer of ice was formed on a sharpened specimen (Tsong, Reference Tsong1985; Pinkerton et al., Reference Pinkerton, Scovell, Johnson, Xia, Medvedev and Stuve1999; Stuve, Reference Stuve2012), as summarized in Figure 11.

Fig. 11. Comparison of the two specimen preparation strategies (b,c) to previously reported strategy (a).
We have attempted a range of other possibilities before selecting NPG as a substrate, including a silicon wafer and a commercial microtip coupon, but the hydrophobicity of the substrate made the preparation of suitable specimens almost impossible. The attempts with the thin wire blank discussed above show that the task to find a suitable substrate is arduous. The hydrophilicity and low contact angle of the water droplet on the NPG facilitated the preparation of the specimens by the moat-type approach. The continuous network of pores (Erlebacher et al., Reference Erlebacher, Aziz, Karma, Dimitrov and Sieradzki2001; Erlebacher & Seshadri, Reference Erlebacher and Seshadri2009) provided strength to the ice–substrate interface, allowing for the analysis of the interface. This is, in principle, also the case for the rough fractured surface of the blank itself, yet no results were obtained since the ice layer, in this case, was thicker than 15 μm. The thickness of the ice layer in this latter case could make it easier to embed larger structures, such as an Escherichia coli bacterium is ~ 1 μm in diameter, a typical red blood cell is 2–5 μm, and a human cell is 10–20 μm. In addition, the evaporation field of water appears to be rather low, and the contrast with W might prevent establishing a specimen shape suitable for the field evaporation of the W substrate itself.
The flat substrate approach could in principle allow for depositing solutions containing a range of different solutes or objects. A key limitation of this approach however is the cooling process. In order to obtain a fully amorphous layer of ice, it is necessary to reach a cooling rate of 106 K/s or higher at ambient pressure (Moore & Molinero, Reference Moore and Molinero2011), to reach the glass transition temperature (136 K). Estimations of the cooling rate with the current setup indicate that it is 2 orders of magnitude slower than the targeted cooling rate. The large volume of water, and of the bulky metallic substrate underneath, likely makes this harder to control, and maybe difficult to reach the cooling rates necessary for vitrification.
The blank approach presented herein should facilitate the vitrification, as it makes use of commercial devices designed for the cryo-preparation of biological samples, adapted in this case for APT. The crystalline or amorphous nature of the ice analyzed here was not checked. It is likely that this can only be confirmed by TEM. An APT specimen made on a wire blank is a geometry perfectly suitable for TEM imaging, such an additional step would make these cryo-protocols even more complex and could very well lower the yield of successful experiments. In addition, there is a possibility to perform either electron backscattered diffraction (EBSD) on the ice layer (Prior et al., Reference Prior, Lilly, Seidemann, Vaughan, Becroft, Easingwood, Diebold, Obbard, Daghlian, Baker, Caswell, Golding, Goldsby, Durham, Piazolo and Wilson2015) or transmission Kikuchi diffraction to verify the crystallinity of samples. The former may be easier to apply with the flat substrate method, provided that the appropriate tilt is achievable using the cryo-stage in the SEM. While the wire blank approach is more versatile, it may not easily allow for site-specific preparation, whereas the flat substrate should allow for making the moat, pillar, and final needle-shaped specimen from various regions of the substrate, given that the area of choice is close to the substrate's edge.
There are many options that could be explored in the future—changing the pore size, the nature of the substrate, etc.—and even for crystalline ice, there lies ahead many opportunities for key studies of solute segregation and redistribution during solidification. Using a water-based solution as a carrier medium for embedding nanostructures is also now possible, and crystalline ice may help locate these nanoparticles close to the substrate's surface, making their preparation somehow simpler. The use of the flat substrate may also facilitate the performance of cryo-liftout to select specific regions in large samples to analyze (Parmenter & Nizamudeen, Reference Parmenter and Nizamudeen2021).
Data Comparison and Similarities
The two approaches enable the analysis of layers of ice of ~ 2–80 μm in thickness. Atom probe analysis from insulating materials has now become almost routine, and it was proposed that the electrostatic field and photon absorption by the specimen are enabled by the field-induced bending of the electronic bands combined with surface defect states (Kelly et al., Reference Kelly, Vella, Bunton, Houard, Silaeva, Bogdanowicz and Vandervorst2014; Silaeva et al., Reference Silaeva, Arnoldi, Karahka, Deconihout, Menand, Kreuzer and Vella2014). Whether similar processes take place in ice cannot be concluded at this stage, since the electric conduction in ice is not expected to involve electrons but protons. Nevertheless, APT data was acquired from micron-thick layers of frozen water and solutions.
Examples of mass spectra are shown in Figure 12 for two datasets obtained from the flat substrate on the LEAP 5000XS for two laser pulse energies and repetition rates in orange-red (Fig. 12a), and in blue is an example obtained on a wire blank on the Inspico atom probe (Fig. 12b). The mass spectra were normalized by the highest peak in the mass spectrum, giving an impression of the relative frequency of each peak. In both cases, a series of peaks correspond to various molecular ions containing a number of O atoms with a combination of D and H atoms. All molecular ions appear to be protonated, and mostly bearing a 1+ charge. This strongly supports the idea that protons are the only relevant charge carrier. The formation of metastable molecular ions from a combination of water molecules was discussed from a theoretical perspective by Karahka & Kreuzer (Reference Karahka and Kreuzer2011) and is consistent with previous experimental reports (Tsong, Reference Tsong1985). For data from the LEAP, Figure 12a, the drop in the level of background from 60 pJ at 25 kHz and 40 pJ at 200 kHz can be ascribed primarily to lower electrostatic field leading to less evaporation at the DC field in between the thermal pulses, as discussed in detail in El-Zoka et al. (Reference El-Zoka, Kim, Deville, Newman, Stephenson and Gault2020).

Fig. 12. (a) Mass spectra for the analysis of D2O ice obtained on the flat substrate (in orange, data acquired using a CAMECA LEAP 5000XS). (b) Mass spectra for both H2O and D2O ice obtained on a wire blank (in blue data acquired using an Inspico-AP). Green arrows in (a) and (b) point out what is meant by smaller clusters. (c) and (d) are the same mass spectra as in (a) and (b), respectively, simply displayed up to a higher mass-to-charge ratio.
The data obtained for and H2O and D2O under similar conditions and on different instruments, Figure 12b, highlight the complexity in the formation of the molecular pattern associated with the dissociation process, as studied in part by Schwarz et al. (Reference Schwarz, Weikum, Meng, Hadjixenophontos, Dietrich, Kästner, Stender and Schmitz2020). The increased atomic weight for deuterium-containing molecular ions will make them travel more slowly in the early stage of their flight, where post-ionization (Kingham, Reference Kingham1982) and possible field-induced dissociations (Zanuttini et al., Reference Zanuttini, Blum, Rigutti, Vurpillot, Douady, Jacquet, Anglade and Gervais2017a,) are more likely.
Interesting points arise from the comparison of the data from the two instruments and specimen preparation strategies. For now, it is simply not possible to completely disentangle the origins of these differences. This is due to initial attempts being reported using different acquisition parameters. The levels of background are comparable for the light orange and light blue mass spectra. The relative amplitude of the smaller clusters in the case of the lower laser pulse energy is coherent with the increase in the electrostatic field necessary to maintain the detection rate at 5 ions per 1,000 pulses on average. However, the set of peaks for lighter molecular ions appears to be more abundant in the data from the Inspico instrument, Figure 12b. A comparison between the patterns formed for D2O on the two instruments, Figures 12a and 12b, highlights that the data acquired from the flat substrate on the LEAP is at a lower overall field compared to the wire blank in the Inspico instrument, as no atomic H or D arising from dissociations is observed in the orange mass spectra. This is also consistent with observations on many other elements with a tendency to form molecular ions during APT analysis (Müller et al., Reference Müller, Saxey, Smith and Gault2011b; Mancini et al., Reference Mancini, Amirifar, Shinde, Blum, Gilbert, Vella, Vurpillot, Lefebvre, Lardé, Talbot, Pareige, Portier, Ziani, Davesnne, Durand, Eymery, Butté, Carlin, Grandjean and Rigutti2014; Santhanagopalan et al., Reference Santhanagopalan, Schreiber, Perea, Martens, Janssen, Khalifah and Meng2015).
In addition, the set of peaks around 44 Da appears in Figure 12b and was attributed to (HOOOH)(H3O)22+, i.e. a doubly charged ion (Schwarz et al., Reference Schwarz, Weikum, Meng, Hadjixenophontos, Dietrich, Kästner, Stender and Schmitz2020), using simulations based on the density functional theory. There is also a possibility that it could be Ga(H3O)2+, as Ga was used for the specimen preparation. Either way, the appearance of doubly charged ions suggests higher electrostatic field conditions. The laser fluence in the case of the data from the flat substrate analyzed in the LEAP 5000XS in the range of 5–8 J/m2, while it is approximately 45–50 J/m2 for the data acquired on the wire blank on the Inspico instrument, and there are three orders of magnitude differences in the peak intensity. These illumination conditions should in principle lead to the data acquired on the Inspico instrument to be under much lower electrostatic field conditions, which is opposite to what is actually observed. Finally, the shape of the mass peaks from the wire blank also suggests that there are significant heat tails, whereas the data from the flat substrate lead to peaks that are almost symmetrical with only little evidence of heat tails. In such a case, the thickness of the ice layer, i.e. 80 versus 5 μm, may be contributing since heat needs to be dissipated through the ice.
The mass spectra in Figure 12 clearly show that the fragmentation pattern, even for supposedly simple molecular liquids like water, is quite complex. Understanding the atomic composition of the peaks is crucial for the reconstruction of the 3D structure, this understanding can be aided by ab initio simulations, which determine the stability of possible fragments (Schwarz et al., Reference Schwarz, Weikum, Meng, Hadjixenophontos, Dietrich, Kästner, Stender and Schmitz2020), model the fragmentation process itself (Nickerson et al., Reference Nickerson, Karahka and Kreuzer2015; Gault et al., Reference Gault, Saxey, Ashton, Sinnott, Chiaramonti, Moody and Schreiber2016; Zanuttini et al., Reference Zanuttini, Blum, Rigutti, Vurpillot, Douady, Jacquet, Anglade and Gervais2017b, Reference Zanuttini, Vurpillot, Douady, Jacquet, Anglade and Gervais2018), and could also shed light on segregation and other structural changes of frozen water under high electric fields.
Degree of Control on Field Evaporation from Water
The possibility of reaching field evaporation conditions for a frozen liquid, comparable to that of solid materials (as opposed to ions detected from frozen liquids originating from uncontrolled migration/sublimation/ionization) remains questionable. This stems from the stability of liquids under UHV conditions being very sensitive to the temperature (Gerstl et al., Reference Gerstl, Tacke, Chen, Wagner and Wepf2017), and the localized heating associated with laser illumination could lead to localized melting and subsequent sublimation. Answering these questions is crucial for any further data reconstruction and processing, since algorithms used for reconstruction typically rely on undisturbed and controlled field evaporation process in order to calculate the third dimension. The uneven distribution of hits on the detector, as seen in Figures 4b and 13, suggests a diffusion of partially charged molecules at the specimen surface before field evaporation. These patterns are very similar to the high-temperature field desorption of ice reported in Stintz & Panitz (Reference Stintz and Panitz1992).
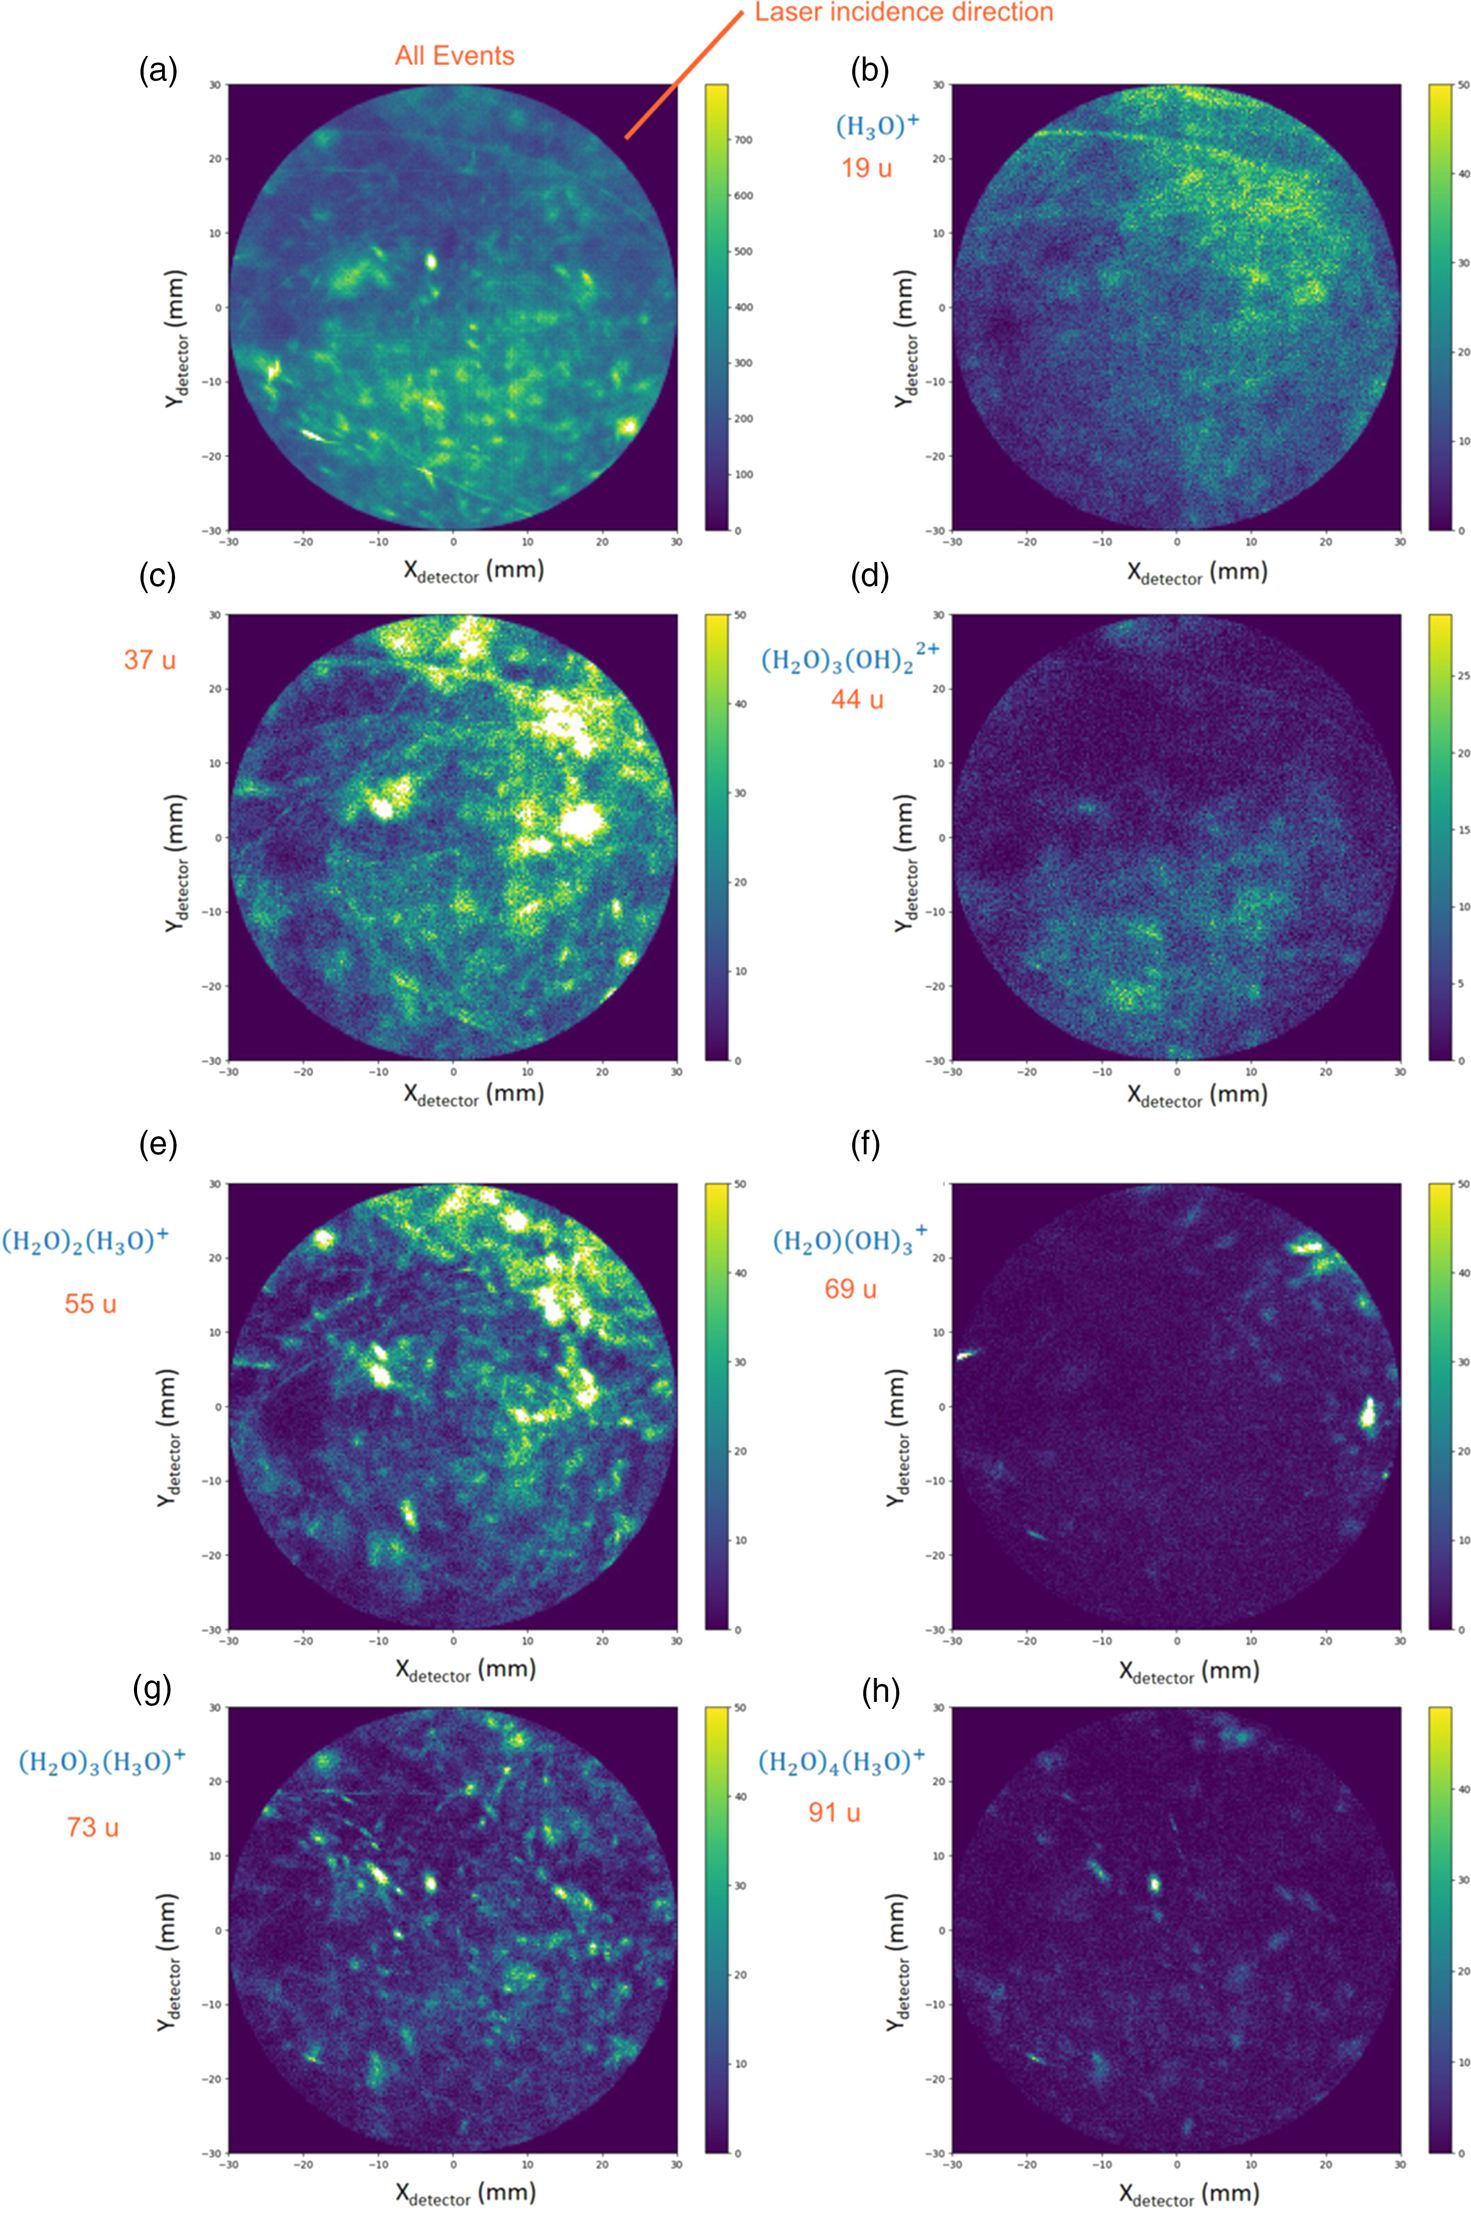
Fig. 13. (a–h) Detector density maps for the data from the Inspico instrument reported in Figure 10 for the different molecular ions detected (Schwarz et al., Reference Schwarz, Weikum, Meng, Hadjixenophontos, Dietrich, Kästner, Stender and Schmitz2020). (Images in the figure are from Schwarz et al. (Reference Schwarz, Weikum, Meng, Hadjixenophontos, Dietrich, Kästner, Stender and Schmitz2020) reused under a CC-BY-NC license.)
To cast light on this problem, we conducted experiments with as-deposited droplets. As shown in Figure 14, the water droplet as well as the tungsten post are decorated with numerous micron-scale ice crystals using moisture condensed during the transfer process. Skipping the sharpening process, the sample was transferred into the atom probe. The laser focus was adjusted to the apex of the droplet with an energy of 15 mW at a 100 kHz repetition rate on the Inspico instrument. By applying a high voltage of 15 kV, a mostly continuous DC evaporation signal was recorded. From the comparison of Figure 14a, before the measurement, and Figure 14b, following the measurement, it is visible that the most protruding ice crystals at the droplet's surface shrunk significantly, and so did those located on the tungsten wire shank. For very high laser intensities of around 40–50 mW, a faint signal above the noise level for large clusters is recognisable, as shown in Figure 14c, but most of the ion count detected is uncorrelated with respect to the laser pulses. In the detector view, small local clusters of evaporation are visible but no homogenous desorption map is obtained. Although the overall radius of curvature of the droplet is in the range of 100 μm, i.e. even at 15 kV the intensity of the electrostatic field will be low, the local sharp curvature of the ice crystals will enable continuous field evaporation.

Fig. 14. (a) Frozen pure Milli-Q water droplet without the freeze-etching process before and (b) after the atom probe measurement. (c) Mass spectrum using high-intensity laser illumination and, inset, detector impact maps at two different times during data acquisition on the Inspico-AP system.
This experiment was repeated with a crystal-free frozen droplet, as shown in Figure 15. The surface is much smoother and, as expected, no signal could be detected as reported before using the conventional AP protocol. The laser beam was then moved from the apex of the droplet several micrometers toward its centre, and with a very high intensity (50 mW at 100 kHz). As visible in Figure 15b, the surface was modified by the high input of energy, i.e. heat, from the laser. A network of cracks appeared, which, interestingly, coincided with the detection of mass peaks in the mass spectrum that can be attributed to protonated water clusters, Figure 15c. The thermal tails are, however, very intense, and the collected data shows no homogenous distribution on the detector map, Figure 15c, and only small datasets were collected. However, it shows that the large amount of heat introduced into the frozen water leads to the modification of the sample shape and overall structure. Such analysis conditions should hence be avoided.

Fig. 15. (a) Side view and (b) water droplet without protruding ice crystals before and (c,d) after measurement in the atom probe. (e) Mass spectrum using high-intensity laser illumination and, inset, detector impact map at two different times during data acquisition on the Inspico-AP system. Corresponding mass spectrum and ion impacts on the detector.
As a result, to limit DC evaporation and surface modification, we took care to only leave a single frozen water tip on the tungsten post. For the laser energy, the lowest repetition rate and the lowest pulse energies for this laser spot size are chosen. The absorption coefficient for ice in the UV and visible spectrum is generally very low (Brandt et al., Reference Brandt, Warren and Grenfell2006), and only a fraction of the net laser intensity is absorbed. Yet, the localised heating clearly affects the specimen's shape in a way that has rarely been reported for APT of e.g. metals or ceramics (which is not to say that it does not occur). This striking difference may be intimately coupled to the charge and heat transport mechanisms. Good electrical conductors are good thermal conductors, via electrons, when they exhibit a continuous density of states at the Fermi level, a thermal intra-band carrier creation/annihilation dynamics, and a quasi-ballistic short-range transport. Under these general conditions, “hot carriers” will be generated in areas of high temperatures and may thermalize in cooler regions after diffusion. This is certainly the case for metals (Houard et al., Reference Houard, Vella, Vurpillot and Deconihout2011), and most likely also applies to semiconductors and insulators in the band-bending scenario, in which the valence band dips below the Fermi level near the surface and becomes partially depleted. In ice, however, charge transport occurs via proton-hopping along existing hydrogen bond networks in a Grotthuss-like mechanism (Park et al., Reference Park, Lin and Paesani2014). As these protons neither stem from thermal processes nor conserve the energy along the hopping path, they cannot drag excess heat with them. The bonding of a proton to H2O is an exothermic reaction, so highly localised heating associated to this process could potentially play on role on the detachment of charged surface species.
Open Questions and Future Challenges
There are various aspects that deserve attention in designing future ice analyses.
Field Evaporation and Molecular Ions
Despite our experiments proving feasibility, much remains unknown regarding the field evaporation behavior of ice. Very thin ice layers (Pinkerton et al., Reference Pinkerton, Scovell, Johnson, Xia, Medvedev and Stuve1999; Stuve, Reference Stuve2012) and somewhat thicker layers (El-Zoka et al., Reference El-Zoka, Kim, Deville, Newman, Stephenson and Gault2020; Schwarz et al., Reference Schwarz, Weikum, Meng, Hadjixenophontos, Dietrich, Kästner, Stender and Schmitz2020) produce qualitatively different results. This could be fundamentally related to different field evaporation mechanisms. For example, atomistic simulations have provided insights into the field evaporation mechanism in metals (Ashton et al., Reference Ashton, Mishra, Neugebauer and Freysoldt2020), but changes caused by a dominant protonic conduction have rarely been discussed (Bilgram & Gränicher, Reference Bilgram and Gränicher1974). Further complexity arises when considering water clusters under strong electric fields. Their formation and stability have previously been considered both experimentally (Stintz & Panitz, Reference Stintz and Panitz1992; Stuve, Reference Stuve2012) and by ab initio methods (Karahka & Kreuzer, Reference Karahka and Kreuzer2011; Schwarz et al., Reference Schwarz, Weikum, Meng, Hadjixenophontos, Dietrich, Kästner, Stender and Schmitz2020). It can be hoped that further ab initio modeling, possibly coupled with proton conduction to the surface, will provide insights on cluster formation and its dependence on applied fields and laser heating.
Previous studies found that with a thin ice film, the highest electrostatic field occurred at the metal–ice interface. Our studies here found that even with the ice specimen surface being several micrometers away from the metal–ice interface, field evaporation phenomena were still manifest with conventionally applied potentials. We did not observe any significant mass-to-charge peak shifts that may have indicated a significant voltage drop. Difficulties in triggering any field evaporation from an ice specimen were previously attributed to a large voltage drop spanning the ice thickness (Stephenson et al., Reference Stephenson, Szczepaniak, Mouton, Rusitzka, Breen, Tezins, Sturm, Vogel, Chang, Kontis, Rosenthal, Shepard, Maier, Kelly, Raabe and Gault2018). Here, thinner ice layers seemed to allow for the generation of electrostatic fields that are sufficient to trigger field evaporation. This occurred even on the unsharpened specimens (approximately 100 μm in diameter) under high-intensity laser illumination. Systematic variations of the experimental parameters are necessary to begin understanding what is happening and of particular interest is the electrostatic field strength both on the specimen's surface and within the specimen bulk, as this will likely influence molecular field evaporated phenomena.
Analytical Performance
Even for conventional materials, APT's analytical limits (spatial resolution, sensitivity) are not typically available or quantified (Lefebvre-Ulrikson et al., Reference Lefebvre-Ulrikson, Vurpillot and Sauvage2016). For example, carbon quantification has been treated multiple times and it is dependent upon instrument performance and upon the field evaporation complexities and dissociative behavior of emitted molecular ions (Sha et al., Reference Sha, Chang, Smith, Mittemeijer, Liu and Mittemeijer1992; Thuvander et al., Reference Thuvander, Weidow, Angseryd, Falk, Liu, Sonestedt, Stiller and Andrén2011; Peng et al., Reference Peng, Vurpillot, Choi, Li, Raabe and Gault2018, Reference Peng, Zanuttini, Gervais, Jacquet, Blum, Choi, Raabe, Vurpillot and Gault2019). Further work examining the dissociative behavior of water-based molecular ions will be required, combining experiments and atomistic simulations (Gault et al., Reference Gault, Saxey, Ashton, Sinnott, Chiaramonti, Moody and Schreiber2016; Zanuttini et al., Reference Zanuttini, Blum, Rigutti, Vurpillot, Douady, Jacquet, Anglade and Gervais2017a, Reference Zanuttini, Blum, Rigutti, Vurpillot, Douady, Jacquet, Anglade and Gervais2017b; Schwarz et al., Reference Schwarz, Weikum, Meng, Hadjixenophontos, Dietrich, Kästner, Stender and Schmitz2020).
An electric field penetrating into a specimen's ice surface could drive ion migration processes, both away or toward the specimen's surface. This influence has been previously discussed, both near the specimen's surface (Wang & Tsong, Reference Wang and Tsong1982) or away in the bulk of the specimen (Greiwe et al., Reference Greiwe, Balogh and Schmitz2014) and the resulting reconstruction would obviously differ from the original physical structures. Additionally, heating from laser pulsing can affect the specimen's outer shape (Fig. 15) and, since this affects ion projection (Hyde et al., Reference Hyde, Cerezo, Setna, Warren and Smith1994; Loi et al., Reference Loi, Gault, Ringer, Larson and Geiser2013), this can introduce uncertainties in a spatial reconstruction. Lastly, the reconstruction protocols typically used across the community (Bas et al., Reference Bas, Bostel, Deconihout and Blavette1995; Gault et al., Reference Gault, Haley, de Geuser, Moody, Marquis, Larson and Geiser2011; Larson, Reference Larson2013) make use of the atomic volume to calculate the depth increment. But what volume should be used for various molecular ions? Little has been done in the community with respect to such a major issue, and only once has the data been reconstructed (Breen et al., Reference Breen, Moody, Gault, Ceguerra, Xie, Du and Ringer2013).
Effect of Base Temperature and of laser Pulsing
Optimizing APT's analytical performance and yield is often about balancing the electric field and the temperature via experimental parameter control (Wada, Reference Wada1984; Gault et al., Reference Gault, Moody, De Geuser, La Fontaine, Stephenson, Haley and Ringer2010a, Reference Gault, Müller, La Fontaine, Moody, Shariq, Cerezo, Ringer, Smith, Müller, La Fontaine, Moody, Shariq, Cerezo, Ringer and Smith2010b; Yao et al., Reference Yao, Cairney, Zhu and Ringern2011; Mancini et al., Reference Mancini, Amirifar, Shinde, Blum, Gilbert, Vella, Vurpillot, Lefebvre, Lardé, Talbot, Pareige, Portier, Ziani, Davesnne, Durand, Eymery, Butté, Carlin, Grandjean and Rigutti2014). To decrease the applied electric field while maintaining evaporative conditions, one can increase the specimen temperature. This is the concept behind laser pulsed atom probe. At higher temperatures, the yield improves but typically at the cost of the spatial resolution (Müller et al., Reference Müller, Gault, Smith and Grovenor2011a). The optical absorption by metallic specimens is well understood (Robins et al., Reference Robins, Lee and Langlois1986; Sha et al., Reference Sha, Cerezo and Smith2008; Vurpillot et al., Reference Vurpillot, Houard, Vella and Deconihout2009), including as a function of the wavelength (Houard et al., Reference Houard, Vella, Vurpillot and Deconihout2009, Reference Houard, Vella, Vurpillot and Deconihout2011). But for ice under high electric fields, such studies have not been done. How does field evaporation behavior change with wavelength and pulse duration? Is the evaporation caused by thermal excitation or by electronic excitation? These questions remain unanswered for the time being.
Ice's Crystal Structure
We do not yet know the ice specimen's crystallography—amorphous or crystalline? And if crystalline, which one of the many possible phases (Engel et al., Reference Engel, Anelli, Ceriotti, Pickard and Needs2018) occurs? Do the intense electric fields upon the surface cause a structural change? Indeed, APT specimens must sustain a high amount of stress during an analysis, because of the electrostatic pressures generated (Rendulic & Müller, Reference Rendulic and Müller1967). This stress can cause metallic specimens to fail mechanically during the analysis (Wilkes et al., Reference Wilkes, Titchmar, Smith, Smith, Morris, Johnston, Godfrey and Birdseye1972; Moy et al., Reference Moy, Ranzi, Petersen and Ringer2011). In some cases, the low yield rates simply prevent meaningful analyses. Is this phenomenon relevant at all to frozen liquids? Under high pressures, and even at cryogenic temperatures, ice can deform (Wu & Prakash, Reference Wu and Prakash2015), which could lead to a change in the specimen's shape and potentially in the distribution of solutes.
The invention of an experimental protocol investigating an ice APT sample's structure will need to be performed. Assessing the structure may traditionally have been done by field ion microscopy, but the scattered results in the literature do not give strong indications that this will be a simple endeavor (Stintz & Panitz, Reference Stintz and Panitz1991, Reference Stintz and Panitz1992; Stuve, Reference Stuve2012). Correlative workflows with TEM have been developed over the past decades (Loberg & Norden, Reference Loberg and Norden1968; Felfer et al., Reference Felfer, Alam, Ringer and Cairney2012; Herbig et al., Reference Herbig, Choi and Raabe2015; Herbig, Reference Herbig2018; Liebscher et al., Reference Liebscher, Stoffers, Alam, Lymperakis, Cojocaru-Mirédin, Gault, Neugebauer, Dehm, Scheu and Raabe2018; Makineni et al., Reference Makineni, Lenz, Kontis, Li, Kumar, Felfer, Neumeier, Herbig, Spiecker, Raabe, Gault, Raabe and Gault2018) as well as with transmission Kikuchi diffraction (Babinsky et al., Reference Babinsky, De Kloe, Clemens and Primig2014; Breen et al., Reference Breen, Babinsky, Day, Eder, Oakman, Trimby, Primig, Cairney and Ringer2017; Schwarz et al., Reference Schwarz, Stechmann, Gault, Cojocaru-Mirédin, Wuerz and Raabe2018). Correlative protocols will now need to be adapted for cryo-transmission–Kikuchi diffraction or cryo-TEM to confirm the ice's crystal structure.
Conclusions
All new microscopy developments are underpinned by the ability to prepare specimens, and this study is hence a necessary step toward opening a new playing field for near-atomic scale analysis of solute effects in confined freezing, nano-objects, and molecular or biological materials in their native environment. Much remains to be done to grasp the physics of the field evaporation of frozen liquids, but the preliminary data obtained on two separate instruments from our two separate groups, in parallel, demonstrate the general feasibility of these analyses. Alternative approaches for the preparation of specimens suitable for both TEM and APT are currently under development and will surely progress in the coming years.
Acknowledgments
We thank Uwe Tezins, Christian Broß, and Andreas Sturm for their support to the FIB and APT facilities at the MPIE. Professor Roger Newman from the University of Toronto is acknowledged for providing the Ag–Au alloys. We are grateful for the financial support from the BMBF via the project UGSLIT and the Max-Planck Gesellschaft via the Laplace project. A.A.E., S.-H.K., L.T.S., and B.G. acknowledge financial support from the ERC-CoG-SHINE-771602. The funding by the German Research Foundation (Deutsche Forschungsgemeinschaft, DFG) within the Collaborative Research Center (CRC) 1333 (Project No. 358283783) is gratefully acknowledged.


 Open access