Worldwide, data from different time points between 1995 and 2013 show that the prevalence of newborns receiving breast milk at some point in their lives was over 80 %, while exclusive breastfeeding (EBF) rates were below 50 %. Although breastfeeding at all ages is higher in low- and middle-income countries than in high-income ones, only 37 % are exclusively breastfed(Reference Victora, Bahl and Barros1).
Despite the benefits of breastfeeding, infant formula (IF) sales increased globally by 40·8 % between 2008 and 2013, from 5·5 to 7·8 kg per child/year. Studies projected an increase in this rate to 10·8 kg by 2018(Reference Baker, Smith and Salmon2) and in advertising investments for these products(Reference Brady3).
The WHO International Code of Marketing of Breastmilk Substitutes(4) regulates the advertising of breast milk substitutes to protect and promote breastfeeding. Yet, 34 years after the Code was adopted, global sales of breast milk substitutes were US$44·8 billion, and, in the coming years, it is expected to reach US$70·6 billion(Reference Rollins, Bhandari and Hajeebhoy5). The Code has been differently adopted among countries. In 2018, of the 194 countries, in which all Latin American countries are included, 136 (70 %) presented legal measures to cover all, some or few provisions of the Code(6). However, most countries lack monitoring mechanisms and report numerous violations(Reference Lutter, Chaparro and Grummer-Strawn7).
The use of IF and baby bottles is higher for infants from high-income families compared with those from low-income families in low- and middle-income countries(Reference Barros, Victora and Scherpbier8). A recent study showed that country’s gross domestic product (GDP) is positively correlated with the use of IF and negatively with EBF in low- and middle-income countries(Reference Neves, Gatica-Domínguez and Rollins9). Especially in Latin America and the Caribbean, the prevalence of EBF was higher among infants from the low-income group whereas IF was higher among infants from the high-income group. The prevalence of IF was higher in Latin America than in other regions, in which even the low-income group had a higher prevalence than high-income groups in West, East and Central Africa, and South Asia(Reference Neves, Gatica-Domínguez and Rollins9). This suggests that as countries become richer IF replaces breast milk(Reference Neves, Gatica-Domínguez and Rollins9).
Social inequality is a relevant determinant of health(10) and inequality in breastfeeding has been reported in the literature(Reference Victora, Bahl and Barros1,Reference Barros, Victora and Scherpbier8,Reference Neves, Gatica-Domínguez and Rollins9,Reference Dodgson11,Reference Victora, Aquino and Leal12,Reference Boccolini, Pérez-Escamilla and Giugliani13) . However, analysis of inequalities in breastfeeding and IFs jointly needs further investigation(Reference Neves, Gatica-Domínguez and Rollins9), especially in Latin America after 1990 due to the development of programs and public policies to promote breastfeeding. No previous study has included a comprehensive set of EBF and IF indicators simultaneously in Latin American countries. Moreover, the time trend in inequality between 1990 and 2010 decades has not been described. To identify whether the rate and the direction trend of BF practice and the use of IF are the same or opposite and how they are distributed according to socio-economic positions, it is important to better inform policymakers and to promote strategies to support breastfeeding according to the situation in each country. Thus, the objective of this study was to analyse the trend of social inequality in breastfeeding and the use of IFs in Latin American countries from 1990 to 2010 decades.
Methods
Study design and data source
This is a time series analysis conducted with data from the Demographic Health Surveys (DHS) Program, which presents a cross-sectional design and is nationally representative. These surveys provide data on fertility, family planning, maternal and child health, gender, HIV/AIDS, malaria and nutrition, aiming to monitor the demographic and health indicators and evaluate the areas of population, health and nutrition, as well as public policies’ effects. Data are comparable between and within countries across different periods of time. All data are available on the DHS Program website (https://dhsprogram.com/).
For this study, we selected data from surveys performed in six countries in Latin America from 1990, including a total of twenty-six databases: three surveys in Bolivia (1998, 2003 and 2008), five in Colombia (1990, 1995, 2000, 2005 and 2010), four in the Dominican Republic (1996, 2002, 2007 and 2013), two in Guatemala (1995 and 2015), five in Haiti (1994, 2000, 2006, 2012 and 2017), and five in Peru (1991, 1996, 2000, 2004–2009 and 2010–2012). Inclusion criteria were at least two surveys performed between 1990 and 2000 or 2010 with variables on breast milk, IFs and a list of previous 24-h food consumption and wealth index. The datasets of Peru have been continuous in DHS since 2004.
Sampling and study population
All surveys used complex probabilistic sampling, including stratification, two-stage clustering and weighting. The primary sampling units comprehend selected clusters with a proportional probability to the cluster size, and secondary sampling units of households by simple random sample.
All alive infants younger than 12 months and living with mother/respondent were included in the study. The total sample comprised 51·358 infants and samples by survey year and countries are described in Table S1. The percentage of excluded infants ranged from 1·7 % in Colombia (2010) to 7·4 % in Haiti (1994) (see online supplemental Table S1).
Indicators of breastfeeding and infant formulas
The feeding indicators assessed were (1) EBF: proportion of infants from 0 to 6 months on EBF (numerator: infants under 6 months of age in EBF; denominator: infants under 6 months of age); (2) breastfeeding between 6 and 12 months (BF6-12): proportion of infants from 6 to 12 months on breastfeeding (numerator: infants aged from 6 to 12 months, who received breast milk on the previous day; denominator: infants aged from 6 to 12 months); (3) IF use (IF): proportion of infants from 0 to 6 months using IF (IF < 6) (numerator: infants under 6 months of age whom received IF; denominator: infants under 6 months of age); and (4) IF use between 6 and 12 months (IF6-12): proportion of infants from 6 to 12 months using IF (numerator: infants aged from 6 to 12 months, who received IF in previous day; denominator: infants aged from 6 to 12 months). All indicators considered information from maternal current status recall in the previous 24 h, as recommended by the WHO(14).
The EBF indicator was defined based on the variables about foods consumed in previous day, including breast milk, water, tea, juices, milks, IFs and solid foods. In the absence of consumption of foods other than breast milk, infants were classified as EBF. Food variables ranged from 13 and 38, according to survey year and country. All surveys presented a variable on previous-day IF consumption (yes/no).
The use of IF was not assessed in the surveys carried out in Colombia in 1990 and in Peru in 1991 because the question about IF was only asked for breastfed infants. Therefore, it was not possible to know about the use of IF for non-breastfed infants.
Wealth index
Wealth index was used in this study as a proxy for income, because in DHS this information is not available(Reference Filmer and Pritchett15). Wealth index is a relative socio-economic position measurement defined by principal component analysis on a series of household assets (household goods and house characteristics), such as toilet facilities, flooring material, ownership of radio, television, bicycle, among others(Reference Rutstein and Kiersten16). The first principal component resulting from this analysis is assigned as the wealth index categorised into five quintiles into which the first corresponds to the lowest socio-economic position (poorest) and the fifth to the highest socio-economic position (richest). The wealth index was available in all survey’s dataset. Wealth index was applied to calculate two inequality indexes – the slope index of inequality (SII) and concentration index (CIX). The wealth index is a measure used as an equity stratifier to assess inequality following the WHO recommendation(10).
Inequality indexes SII and CIX were used to assess inequality in BF and IF indicators for each country and survey year. These measures capture differences among indicators in the lower and upper quintiles. SII assesses absolute inequality between the wealth index quintiles and represents the absolute difference in the indicator prevalence. CIX assesses relative inequality and the concentration of income within the wealthiest group. SII and CIX range from −100 to +100. Negative values mean the indicator is more prevalent within the less privileged group (lower wealth quintiles – poorest) and positive values mean the indicator is more prevalent within the more privileged group (higher wealth quintiles – richest), while zero indicates total equality(Reference Barros and Victora17). SII and CIX were calculated using information from all five quintiles and they are complementary to assess trend of inequality over time.
Data analysis
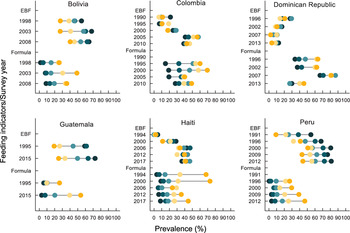
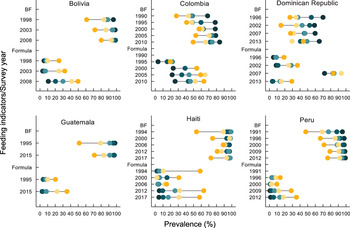
The four feeding indicators – EBF, BF6-12, IF < 6 and IF6-12 – were expressed in prevalence and 95 % CI. Prevalence was estimated through the ratio of the indicators previously described. Proportion and SE for each feeding indicator were used to estimate 95 % CI. The prevalence on the indicators of EBF, BF6-12, IF < 6 and IF6-12 were expressed in wealth index quintiles, using a specific graph called equiplot (http://www.equidade.org) (18). In these graphs, the prevalence of these indicators was plotted for each of the five quintiles of wealth index, by survey year and country.
The trend analysis of the prevalence of BF and IF indicators and of inequality in these indicators over time was performed by linear regression analysis with weighted least squares variance. Regarding the trend analysis of prevalence of the indicators, four linear regression models were performed, and one for each outcome (EBF, BF6-12, IF < 6, IF6-12). The predictor variable was the survey year. Sensitivity analysis was performed excluding the year 2007 for the Dominican Republic, because there was an outline increase in IF use specifically in this year. Regarding trend analysis of inequality, the outcomes were the two inequality indices (SII and CIX) for each BF and IF indicators and the predictor was the survey year.
The slope coefficient of regression is interpreted as the average annual change (increase or decrease in prevalence and increase and reduction in absolute and relative inequalities), expressed in percentage with the respective trend P value. The level of significance adopted was 5 %. All analyses considered complex sample design and sampling weights and were performed using the 12.0 Stata se®.
All surveys in DHS Program were approved for an ethical committee. All participants received an explanation about informed consent statement to accept or decline to participate. The informed consent statement contained information about the purpose of the interview, the average duration of the interview, all procedures, potential risks and benefits to the respondents, information that participation is voluntary, and that all information are confidential. In all surveys, the name of the participants was replaced by a code with numbers. More information about ethical procedure is available at https://dhsprogram.com/What-We-Do/Protecting-the-Privacy-of-DHS-Survey-Respondents.cfm.
Results
Table 1 shows the BF and IF indicators according to country and survey year. We observed that the lowest prevalence for all BF indicators was in the Dominican Republic (2013), ranging from 9·5 % for EBF to 45·5 % for BF6-12 (most recent survey). The highest prevalence of EBF was 65·7 % in Peru (2012), and BF6-12 was 94·3 %, in Bolivia (2008). The lowest prevalence of IF use (19·7 %) in infants under 6 months was in Haiti (2017) and for infants from 6 to 12 months in Guatemala (11·8 %) in 2015. Colombia (2010) showed the highest prevalence of IF among infants under 6 months (36·9 %) and from 6 to 12 months (45·0 %).
Table 1 Trends in the prevalence of breastfeeding and infant formulas by countries and survey year. DHS, 1990–2010

EBF: exclusive breastfeeding, BF: breastfeeding, IF: infant formula; DHS: Demographic and Health Surveys.
Regarding the trend analysis of the indicators, the highest annual increase in EBF was observed in Colombia and Haiti. For IF < 6, the highest annual increase was in Bolivia (Table 1). Colombia presented an increase in all BF indicators and a decrease in IF < 6. In Bolivia, Guatemala, Haiti and Peru, we observed an increase in both breastfeeding and IF indicators, whereas in the Dominican Republic decrease in BF and an increase in IF were observed (Table 1). Nonetheless, excluding data from 2007 in the Dominican Republic, we found a decrease in IF use trend (IF < 6 and IF6-12) over time, suggesting a different trend from the one including 2007 dataset. Figures 1 and 2 describe the prevalence of breastfeeding and IF indicators by wealth index for infants under and above 6 months, respectively. In Table 2, we quantify the magnitude of inequality (absolute and relative) in breastfeeding and IF for each country and survey year.

Fig. 1 Prevalence of exclusive breastfeeding (EBF) and infant formula (formula) among infants under 6 months by wealth index (quintiles), countries and survey years. Demographic and Health Surveys (DHS), 1990–2010. ![]() , Q1;
, Q1; ![]() , Q2;
, Q2; ![]() , Q3;
, Q3; ![]() , Q4;
, Q4; ![]() , Q5
, Q5

Fig. 2 Prevalence of breastfeeding (BF) and infant formula (formula) among infants aged 6 to 12 months by wealth index (quintiles), countries and survey years. Demographic and Health Surveys (DHS), 1990–2010. ![]() , Q1;
, Q1; ![]() , Q2;
, Q2; ![]() , Q3;
, Q3; ![]() , Q4;
, Q4; ![]() , Q5
, Q5
Table 2 Prevalence of breastfeeding and infant formulas by first and fifth income quintiles, inequality slope index (SII) and concentration index (CIX) by countries and survey year. DHS, 1990–2010

EBF: exclusive breastfeeding; BF: breastfeeding; IF: infant formula; SII: slope of inequity index; CIX: concentration index; DHS: Demographic and Health Surveys.
* P < 0·05.
** P < 0·001.
Bolivia, Guatemala, Haiti, Peru and the Dominican Republic had negative SII and CIX values for EBF and BF6-12 (first quintile of wealth index) and positive for IF < 6 and IF6-12 (fifth quintile of wealth index). In Colombia, SII was positive for EBF and negative for BF6-12; for IF (< 6 and 6-12), it was positive (Table 2).
In Fig. 3 we plotted values of SII (absolute inequality) and CIX (relative inequality) for EBF (green) and IF (red) in each country. The objective of this plot is to summarise the trend of absolute and relative inequalities in four scenarios. Zero values mean equality. The best scenario was the lower left quadrant because absolute and relative inequalities decreased (prevalence of EBF and IF was similar between the poorest and richest). The worse scenario was the top right quadrant because absolute and relative inequalities increased (prevalence of EBF and IF was different between the poorest and richest). However, in this plot it was not possible to see whether inequality decreased in breastfeeding indicators because prevalence increased in the richest or decreased in the poorest; and whether inequality decreased for IF because prevalence increased in the poorest or decreased in the richest. This information can be verified in Table 2.

Fig. 3 Slope of inequity index (SII) and concentration index (CIX) values for exclusive breastfeeding (EBF) and infant formula (IF) indicators among infants under 6 months (a) and infants aged 6–12 months. ![]() , Exclusive breastfeeding;
, Exclusive breastfeeding; ![]() , infant formula. (b) Demographic and Health Surveys (DHS), 1990–2010.
, infant formula. (b) Demographic and Health Surveys (DHS), 1990–2010. ![]() , Breastfeeding (6-12 m);
, Breastfeeding (6-12 m); ![]() , infant formula (6-12 m)
, infant formula (6-12 m)
Regarding EBF, we observed an increase in inequality in Colombia, Haiti and Peru, due to an increase in the prevalence of this indicator solely within the highest quintile. Countries that decreased inequality (P < 0·001) for IF < 6 were: Bolivia, Colombia, Haiti and Peru. In these countries, we observed that IF prevalence increased within the lowest wealth index quintile, reducing inequality between this and the highest income quintile. Inequality in EBF decreased in Guatemala due to the increase in the prevalence in the highest income quintile and constancy in the lowest. The upper right quadrant portrays countries with increased SII and CIX. Inequality in IF < 6 increased, resulting from IF < 6 increases only among infants from the highest quintile (Fig. 3a). The inequality decreased for BF6-12 in Guatemala and the Dominican Republic, due to the increased prevalence in the highest income quintile and remained equal in the lowest one (Fig. 3b). For IF6-12, absolute (SII) or relative (CIX) inequality increased in all countries except Haiti, and in these countries the prevalence increased only among infants in the highest quintile. The supplementary table (see online supplementary material, Supplemental Table 2S) shows the characteristics of the International Code of Marketing of Breastmilk Substitutes in the analysed countries.
Discussion
The prevalence of breastfeeding and IF indicators showed an upward trend for both age groups in most of the analysed countries. In five of the six countries, the prevalence of EBF was higher in the lowest wealth index quintiles. Whereas for IF, all of them presented higher prevalence in the highest wealth index quintiles. Bolivia, Colombia, Haiti and Peru reported a decrease in inequality for IF. Guatemala reported an increased inequality was for IF < 6, and Colombia, Haiti and Peru for EBF. Guatemala was the only country to show a decrease in inequality for EBF and BF6-12 and an increase for IF6-12, maintaining the most prevalent pattern of BF within the lowest quintiles and IF in the highest ones, in all survey years.
Overall, such increase in BF prevalence corroborates a similar study performed by Lutter and Morrow(Reference Lutter and Morrow19) with data from global surveys for a period of 13 to 25 years (between 1986 and 2011). The authors attribute this increase to the implementation of the WHO Global Strategy(20) and other policies and programs issued since the 1980s(Reference Brown21).
Colombia showed a positive trend in the prevalence of BF indicators and a negative in IF indicators. Such increase may be explained by the combination of successful interventions(Reference Brown21), such as advertisement investments and protection and pro-breastfeeding policies, such as the Code, which protects breastfeeding against commercial influences that discourage it; the Baby-friendly Hospital Initiative, which promotes, protects and supports breastfeeding in hospitals; the National Breastfeeding Promotion Program; the Global Strategy for Infant and Young Child Feeding; the Maternity pay and leave; and the National Food and Nutrition Policy(Reference Gupta, Suri and Dadhich22,23) , besides media campaigns, training for health professionals and development of mother-to-mother support groups.
Furthermore, Colombia was the only country to show an inverse pattern for EBF, higher prevalence among the highest wealth index quintiles. A cohort study(Reference Victora, Aquino and Leal12) reported an increase in breastfeeding at 3 months in all socio-economic groups, but the prevalence remained higher within the highest quintile. Regarding the socio-economic inequalities, EBF benefits were grasped faster by richer mothers than by poorer mothers. This may be explained by the inverse equity hypothesis, which states that public health interventions or programs are initially more accessible and used by people with a more favourable economic situation (richest), increasing socio-economic inequalities in health(Reference Victora, Aquino and Leal12). The richest are, in general, the first to benefit from the newly introduced interventions due to their greater access to information and healthcare(Reference Barros and Victora17). Another possible explanation is the greater use of paid maternity leaves by women with higher educational level, due to their formal jobs.
Although EBF is a widespread practice in Peru, it showed but a slight positive trend, possibly because of its already high prevalence since the first survey. Peru culturally supports breastfeeding, with a high prevalence of breastfeeding in the first hour of life(24). Possibly, in this country, the support of health professionals to breastfeed after birth, in the hospital environment and in health services is frequent and benefiting BF(Reference Matias, Nommsen-Rivers and Dewey25,26) . The Dominican Republic presented a low EBF prevalence. In this country, IF was introduced in 55 % of infants during the first days of life(Reference Boccolini, Pérez-Escamilla and Giugliani13), indicating a violation of the current legislation on IF promotion, as most births take place in health units and are assisted by health professionals(27).
For IF, the values of SII and CIX were positive in all countries and survey year, whereas for breastfeeding the values of SII and CIX were negative (except in Colombia). Our results corroborate the results and conclusions from Victora et al. (Reference Victora, Bahl and Barros1) regarding inequalities that breastfeeding is one of the few positive health behaviours more prevalent among the less privileged. This suggests that breastfeeding patterns reduce health gaps, which would be even greater without it, between rich and poor infants in low- and middle-income countries. There was a decrease in inequality in IF < 6 (Bolivia, Colombia, Haiti and Peru), indicating that this practice has been disseminated not only among the rich but also among the poor. Rollins et al. (Reference Rollins, Bhandari and Hajeebhoy5) estimated that IF sale would increase in middle-income countries in recent years. This could be explained by an increase in purchase power among poor mothers over time or between countries. Poorer mothers not breastfeeding may be able to use IF instead of cow milk and other liquids, as their income increases, a concern reinforced by the decreasing rates in breastfeeding within the poor populations(Reference Victora, Bahl and Barros1).
Even though IF presented a decreasing trend, its prevalence remains high in Colombia, and the Dominican Republic, based on the latest survey. The results of the World Breastfeeding Trends Initiative (WBTi), created to assess and monitor the implementation of the Global Strategy, indicate that all countries studied (except for Haiti) had good scores in the third indicator (Implementation of the International Code), suggesting that the Code has been partially or completely implemented. However, the monitoring data about Code in Latin American countries did not achieve an adequate and recommended pattern(Reference Lutter, Chaparro and Grummer-Strawn28). The Code may be suffering violations(29).
The recommended scenario would be to reduce inequality for breastfeeding, so that an increase in prevalence is observed in both the poorest and the wealthiest infants. This scenario was verified only for EBF in Guatemala. We can speculate that implementation of pro-breastfeeding policies and programs improved over time. In this country, an increase in WBTi score of 12·5 points was observed from 2011 to 2015 (45·5 to 58 points). WBTi is a tool that punctuates these policies and programmes in each country. It is necessary to analyse the data regarding the situation of the International Code of Marketing of Breastmilk Substitutes in these countries (see online supplementary material, Supplemental Table 2S). All countries, except for Haiti, have already prepared and implemented it. In all of them, the Code was enacted as a legislation or decree. The Code has been implemented for 38 years in Peru, 37 in Guatemala, 28 in Colombia, 24 in the Dominican Republic, and 14 in Bolivia. However, implementing the Code does not mean that it has been applied or constantly monitored. The data in this study are worrisome, as 4 of the 6 countries showed an increase in the prevalence of IF, higher within the lowest quintiles, possibly resulting in the lack of legal monitoring.
The International Baby Food Action Network(30), since its creation in 1979, plays an essential role in protecting breastfeeding, especially by efforts in implementing and monitoring the Code within countries where it is present. The Global Breastfeeding Scorecard measures the extent of the Code’s implementation. Worldwide, only 18 % of countries fully implemented the Code, so that the Collective has set a goal to fully implement the Code in law in 40 % of countries by 2030(31).
Despite all monitoring limitations, implementing the Code is a necessary step but insufficient to improve breastfeeding results. In addition, other factors that facilitate breastfeeding are necessary, such as adequate maternity leave, breastfeeding training for health professionals, strengthening health systems by the Baby Friendly Hospital Initiative and counselling for mothers regarding breastfeeding. Additionally, it is necessary for health professionals to discourage the use of IFs. For this, we believe that two main actions are necessary: to improve the training of health professionals on breastfeeding management, because the IF is usually prescribed when the professional does not know how to manage BF, and to monitor the Code more rigorously, as the health professionals receive benefits from companies when prescribing formulas. In addition, emphasise the worse nutritional composition of the formula compared to breast milk(Reference Robinson, Buccini and Curry32).
One of the strengths of this study was the use national representative databases that enable comparison between and within countries by uniform available variables. Furthermore, the selection of all available surveys made the trend analysis more robust and broadened the understanding of the situation of breastfeeding and IF indicators. We highlighted the analyses of BF and IF in same study and assessed their prevalence according to the socio-economic position (wealth index), making it possible to identify inequalities and their trends. The identification of similarities and differences between countries highlighted specific needs and can better inform policymakers.
The main limitations of our study are related to the variables available in the databases. We used food consumption in the previous day to estimate EBF. However, an increase in the number of food variables throughout the years was observed in the surveys, which may have impaired the assessment of EBF prevalence. That is, the prevalence in the oldest survey years may be overestimated as the questions contained only a few foods. Another limitation is that within the surveys, in addition to IF, mothers were asked about cow’s milk consumption (fresh or powdered), which may have confused them. The 2007 data set from the Dominican Republic showed a very different estimate on the IF use compared to the other years, which lead to different results when we included and excluded this year from the analyses. We do not know what could explain these results, therefore they should be read with caution, and future studies should further explore this issue. Another limitation refers to the use of a relative socio-economic position measure (wealth index). The concept of this measure relies on the assumption that infants classified in one quintile will be in a higher or lower position compared with the others. However, if a country is getting richer over time the virtual distance between the poorest and the richest will decrease.
Another possible limitation was the difficulty in incorporating in the analysis information regarding the presence of laws for breast milk substitutes and the lack of data on monitoring. We also point out that, in most of the selected countries, the latest research available refers to data from 10 years prior to this study. Future studies focusing on recent years may show a different scenario, especially for IF.
Conclusion
The prevalence of EBF increased in five of the six countries, with the most significant increase in Colombia and Haiti. At the same time, the trend towards the use of IF has also increased. In general, BF indicators are more prevalent in the lowest wealth index quintiles and IF in the highest, and the inequality between BF and IF remained over time. The decrease in inequality was observed mainly in IF < 6, due to the increase in FI use in low-income infants. The main reduction in inequality in BF was for Guatemala. Our results suggest the need for interventions to promote EBF and reduce the use of IF considering the socio-economic status, and also to monitor and enforce legislation to regulate IF and other breast milk substitutes.
Acknowledgements
Acknowledgements: We thank Prof. Aluísio Jardim Dornellas de Barros (International Center for Equity in Health| Pelotas - UFPEL) for his support in drawing Figure 3. Financial support: The present study was supported by Brazilian National Council for Scientific and Technological Development (CNPq), nº427673/2016-0 awarded to Ana Elisa Madalena Rinaldi. Conflict of interest: There are no conflicts of interest. Authorship: C.S.F.: study design, database configuration, data analysis and interpretation; writing of the article; final approval of the version to be submitted. C.M.A.: data interpretation, writing of the article, critical review of relevant intellectual content; final approval of the version to be submitted. A.E.M.R.: study design, data analysis and interpretation, writing of the article, critical review of relevant intellectual content; final approval of the version to be submitted. Ethics of human subject participation: This study was conducted according to the guidelines laid down in the Declaration of Helsinki and all procedures involving research study participants were approved by the ICF Institutional Review Board. Written informed consent was obtained from all subjects.
Supplementary material
For supplementary material accompanying this paper visit https://doi.org/10.1017/S1368980021000392