


Implications
Selection on feed efficiency results in large correlated reductions in the environmental impacts of pig production; with gross feed efficiency having more impact than net feed efficiency. Our pig-based evaluation model will allow definition of selection criteria that result in even larger reductions in environmental impact.
Introduction
Beyond being an economic bottleneck, feed greatly contributes to the environmental impacts of pig farming (McAuliffe et al., Reference McAuliffe, Chapman and Sage2016). Improvement in feed efficiency is a major goal for pig production sustainability, because it reduces environmental fluxes associated with feed production (Nguyen et al., Reference Nguyen, Hermansen and Mogensen2011) and reduces the amount of effluent per pig as a result of mass balance (Ali et al., Reference Ali, de Mey, Bastiaansen and Lansink2018). Feed efficiency, which is usually inversely expressed as feed conversion ratio (FCR), stands for the BW gain per unit of feed consumed. Selection for FCR, directly or via increased growth rate or reduced fatness, has been very effective to improve feed efficiency in the past. However, as a ratio, FCR is closely correlated with production traits, and selection on this trait has uncontrolled effects on the components of the ratio (Saintilan et al., Reference Saintilan, Mérour, Brossard, Tribout, Dourmad, Sellier, Bidanel, van Milgen and Gilbert2013). In 1963, Koch et al. introduced a more targeted indicator for net feed efficiency, residual feed intake (RFI). The RFI, which is a linear combination of traits, is moderately heritable in pigs (Saintilan et al., Reference Saintilan, Mérour, Brossard, Tribout, Dourmad, Sellier, Bidanel, van Milgen and Gilbert2013) and is defined as the difference between observed feed intake and the feed intake expected from individual maintenance and production requirements. Among the range of approaches for measuring feed efficiency, RFI is increasingly becoming the measure of choice in some species (Kenny et al., Reference Kenny, Fitzsimons, Waters and McGee2018). Improving animal feed efficiency is possible at two stages. The first stage, which arises from the interaction between feed and animal in the digestive tract, is to improve conversion of the feed gross energy into metabolisable energy (ME). The second stage is to improve the partitioning of uptaken energy between maintenance and tissue accretion through protein (PD) and lipid deposition (LD) (Nguyen et al., Reference Nguyen, McPhee and Wade2005). Improving feed efficiency through selection based on RFI essentially corresponds to the latter (Gilbert et al. Reference Gilbert, Billon, Brossard, Faure, Gatellier, Gondret, Labussière, Lebret, Lefaucheur, Le Floch, Louveau, Merlot, Meunier-Salaün, Montagne, Mormede, Renaudeau, Riquet, Rogel-Gaillard, van Milgen, Vincent and Noblet2017). Separate selection for RFI has been investigated and impacts on production performance (Gilbert et al., Reference Gilbert, Bidanel, Gruand, Caritez, Billon, Guillouet, Lagant, Noblet and Sellier2007; Cai et al., Reference Cai, Casey and Dekkers2008) as well as on sow reproduction and piglet traits were reported (Gilbert et al., Reference Gilbert, Bidanel, Billon, Lagant, Guillouet, Sellier, Noblet and Hermesch2012; Young et al., Reference Young, Bergsma, Knol, Patience and Dekkers2016). However, to date, its impacts have not been thoroughly assessed from an environmental viewpoint due to the lack of an appropriate model. To quantify environmental impacts, several studies using life cycle assessment (LCA) examined the environmental burdens of different pig production options (Garcia-Launay et al., Reference Garcia-Launay, van der Werf, Nguyen, Le Tutour and Dourmad2014; Mackenzie et al., Reference Mackenzie, Leinonen, Ferguson and Kyriazakis2015; McAuliffe et al., Reference McAuliffe, Takahashi, Mogensen, Hermansen, Sage, Chapman and Lee2017). The aim of the present study was to develop a model adapted to the evaluation of pig selection strategies and use it to estimate the environmental impacts of selection for RFI, through comparative LCA of two lines of pigs divergently selected for RFI.
Material and methods
Experimental data
The experimental data were obtained from the fifth generation of Large White pigs divergently selected for RFI. The selection process and results concerning low RFI (LRFI, more efficient pigs) and high RFI (HRFI, less efficient pigs) lines are reviewed in Gilbert et al. (Reference Gilbert, Billon, Brossard, Faure, Gatellier, Gondret, Labussière, Lebret, Lefaucheur, Le Floch, Louveau, Merlot, Meunier-Salaün, Montagne, Mormede, Renaudeau, Riquet, Rogel-Gaillard, van Milgen, Vincent and Noblet2017). The present data set includes 60 male pigs in the LRFI line and 58 male pigs in the HRFI line. Growing pigs had ad libitum access to a one-phase conventional diet (Table 1). The experimental data were collected from birth to slaughter. Body weight was recorded at birth; at weaning (average 28 days of age); at the beginning of the fattening period (10 weeks of age); at 11, 15, 19, and 23 weeks of age; and at the end of the test (target BW 115 kg). During the fattening period, data on individual daily feed intake (DFI) recorded on ACEMA 64 automatic feeders (ACEMO, Pontivy, France) were available, and back fat thickness (BFT) was measured by ultrasound on live animals at 23 weeks of age, using an ALOKA SSD-500 echograph (Aloka, Cergy Pontoise, France). From these records, FCR and RFI were computed as described in Gilbert et al. (Reference Gilbert, Bidanel, Gruand, Caritez, Billon, Guillouet, Lagant, Noblet and Sellier2007). For LRFI and HRFI sows/litters, the mean values of age at farrowing and weaning, sow BW and BFT before farrowing and at weaning, lactation DFI, number of total born, stillborn, weaned piglets, piglet BW at birth and at weaning and weaning age were taken from the experimental data presented in Gilbert et al. (Reference Gilbert, Bidanel, Billon, Lagant, Guillouet, Sellier, Noblet and Hermesch2012).
Table 1 Ingredients, chemical composition and nutritional value of the experimental diet of pig lines

NE = net energy; ME = metabolisable energy.
1 Calculated according to the method of Sauvant et al. (Reference Sauvant, Perez and Tran2004).
2 Standardised ileal digestible lysine.
Goal, scope and framework of the environmental assessment
A ‘cradle-to-farm-gate’ system boundary was chosen, including feed production, manure management and the entire pig production system comprising reproducing sows and their piglets, post-weaning and fattening pigs. One kilogram of live weight (LW) of pig at the farm gate was used as the functional unit with the goal of comparing the environmental impacts between the HRFI and LRFI lines. To implement LCA, all the materials and energy consumed in the production of one functional unit of the system have to be included in the life cycle inventory (LCI), in addition to all excretions and emissions to the environment. The LCI needs to consider all the processes that take place inside the system boundary. To obtain a flexible and predictive model for daily feed intake, it was required to switch from the mass context of the data recording to the energy context for modelling. Due to the pigs’ ability to adapt their feed intake to the net energy (NE) concentration of different diets (Quiniou and Noblet, Reference Quiniou and Noblet2012), the model was developed based on the daily NE supply during fattening to allow prediction for different diet compositions and guaranty generality. Our model was consequently developed based on NE for the fattening period and ME for reproducing sows, to estimate the flux of dietary energy which propagates through all individual pigs within the system boundary (Figure 1).

Figure 1 Scheme of the system boundary, which includes the entire pig farm, feed production processes and manure management. GE = gross energy; DE = digestible energy; ME = metabolisable energy; NE = net energy; MEm = metabolisable energy required for maintenance; NEm = net energy required for maintenance; NE gain = net energy required for gain; CF = crude fibre; AA = amino acid; N = nitrogen; Ca = calcium; P = phosphorus; K = potassium; Cu = copper; Zn = zinc.
Model structure
The model consists of six modules with distinct functions.
Feeding plan module
InraPorc®, which is a model and software designed to simulate the performance response of pigs to different nutritional strategies (Dourmad et al., Reference Dourmad, Etienne, Valancogne, Dubois, van Milgen and Noblet2008; van Milgen et al., Reference Dourmad, Etienne, Valancogne, Dubois, van Milgen and Noblet2008), was incorporated in the LCA model to benefit from its features. It contains the licensed INRA-AFZ database of characterised feed ingredients (Sauvant et al., Reference Sauvant, Perez and Tran2004) as an embedded library. This library distinguishes different nutritional values depending on the animal physiological status (sows and growing pigs). In the feeding sub-module, the composition of the diet and the feeding plan (rationing and sequencing plan) during the different periods of the animal’s lifetime were defined based on experimental data. The outcome of this sub-module is the chemical compositions and nutritional values of the diets, based on the INRA-AFZ database.
Animal profile module
Each animal profile is the compilation of the feeding plan, housing conditions, experimental data, NE system and a final calibration in InraPorc®. The Gamma function was used to express ad libitum feed intake because of its flexibility which enables it to adjust to changes in feed intake and BW (van Milgen et al., Reference van Milgen, Valancogne, Dubois, Dourmad, Sève and Noblet2008). The daily ad libitum feed intake and NE of the feed characterised the animal daily NE requirements. InraPorc® was used to establish the individual profiles for each pig separately in the lines during the fattening period (day 68 to day 179), based on the animal’s individual data, which were recorded daily, as previously proposed by Saintilan et al., Reference Saintilan, Brossard, Vautier, Sellier, Bidanel, van Milgen and Gilbert2015. The average profiles for groups of sows and their piglets were defined separately in InraPorc® based on the experimental data on the average HRFI and LRFI sows/litters performance summarised by Gilbert et al. (Reference Gilbert, Bidanel, Billon, Lagant, Guillouet, Sellier, Noblet and Hermesch2012). The outcome of this module is the predicted growth performance (average daily gain (ADG) and average daily feed intake (ADFI)), PD and LD during fattening, respectively, the ratio of body protein to and body lipid (BP/BL ratio) and mineral excretions of the pigs. As InraPorc® was not designed to model the performance of animals post-weaning, a calculation module was developed in R to estimate the excretions and emissions during the post-weaning period (28 days to 10 weeks of age), according to Rigolot et al. (Reference Rigolot, Espagnol, Pomar and Dourmad2010a and Reference Rigolot, Espagnol, Robin, Hassouna, Béline, Paillat and Dourmad2010b).
Emission and excretion module
To calculate the emissions and excretions, and the slurry composition, three sub-modules were developed in R for the sow-litter, post-weaning and fattening stages. The average performance data were used for the sow-litter stage and the individual performance data were used for the post-weaning and fattening stages. The components of the excreta (DM, organic matter (OM), nitrogen (N), phosphorus (P), potassium (K), copper (Cu) and zinc (Zn) were calculated using the mass-balance approach, as the difference between nutrients taken up from the feed and the nutrients retained in the body. Emissions of enteric methane (CH4), nitrogen monoxide (NO), nitrous oxide (N2O), ammonia (NH3) and carbon dioxide (CO2) during housing were calculated according to Rigolot et al. (Reference Rigolot, Espagnol, Pomar and Dourmad2010a and Reference Rigolot, Espagnol, Robin, Hassouna, Béline, Paillat and Dourmad2010b). Subtraction of N excretion and gaseous N lost in housing determined the quantity of N at the beginning of manure storage (Garcia-Launay et al., Reference Garcia-Launay, van der Werf, Nguyen, Le Tutour and Dourmad2014).
A sub-module was developed to estimate emissions, leaching and runoff during manure storage and application in the field. The NH3 emissions during outside storage were calculated according to the emission factors recommended by Rigolot et al. (Reference Rigolot, Espagnol, Robin, Hassouna, Béline, Paillat and Dourmad2010b). The NOx emissions were calculated according to Nemecek et al. (Reference Nemecek, Heil, Huguenin-Elie, Meier, Erzinger and Blaser2004). Methane emissions from manure during storage were calculated using guidelines by the Intergovernmental Panel on Climate Change (IPCC, 2006). Direct and indirect emissions of N2O and NH3 during the spreading of slurry were calculated according to IPCC (2006). The value of the manure as a replacement for synthetic fertiliser was considered according to the mineral fertiliser equivalency of 75% for N (Nguyen et al., Reference Nguyen, Hermansen and Mogensen2010) and 100% for P and K (Nguyen et al., Reference Nguyen, Hermansen and Mogensen2011).
Water, energy expenditure and transport modules
The model linked drinking water to feed intake according to the Institut de la Filière porcine (IFIP) report on typical French farms (IFIP, 2014), with water to feed ratios of 4.5, 4.0, 2.5 and 2.7 for lactating, gestating, post-weaning and fattening pigs, respectively. Cleaning water was estimated at 2300 l per sow and 30 l per fattening pig according to IFIP (2014) and Rigolot et al. (Reference Rigolot, Espagnol, Pomar and Dourmad2010a). In addition, the energy expenditure link to the functional unit was 0.42 kWh/kg LW and was broken down into electricity, oil and gas components, according to IFIP (2014). Transport of feed was calculated as a coefficient of feed intake. Linking water and transport to feed intake made the model sensitive to feed efficiency for further sensitivity and uncertainty analyses.
Life cycle impact assessment
An individual LCA was conducted for each pig in the LRFI and HRFI lines through incorporating its own experimental recorded traits and the traits obtained from InraPorc® in the LCA model. The outputs of the LCA model were the impact categories of climate change (CC), terrestrial acidification potential (AP), freshwater eutrophication potential (EP), land occupation (LO) and water depletion (WD). For impact analyses, the ReCiPe Midpoint 2016 (H) V1.13 (Huijbregts et al., Reference Huijbregts, Steinmann, Elshout, Stam, Verones, Vieira, Hollander, Zijp and van Zelm2016), one of the most recently updated life cycle impact assessment methods, with the Ecoalim (Wilfart et al., Reference Wilfart, Espagnol, Dauguet, Tailleur, Gac and Garcia-Launay2016) and Ecoinvent (Wernet et al., Reference Wernet, Bauer, Steubing, Reinhard, Moreno-Ruiz and Weidema2016) inventory databases, were used. The equivalency factors for the impact categories were assigned according to the factors recommended in the ReCiPe method. All environmental impact assessments were implemented in the SimaPro V8.5.4.0 on the MEANS (MulticritEria AssessmeNt of Sustainability) platform (http://www.inra.fr/means).
The line impact differences were tested with a t test, and impacts were declared significantly different for P < 0.05. In addition, correlations between performances and environmental impacts were calculated within lines, for a better understanding of the relationships between the components.
Uncertainty analysis
Monte Carlo simulations is an approach, available in SimaPro V8.5.4.0, to quantify the effects of the uncertainties in the model parameters on the estimated environmental impacts: by resampling the parameter values based on assumptions about their uncertainties, a confidence interval for each impact can be obtained. In addition, the Ecoinvent LCA databases, which are embedded in SimaPro V8.5.4.0, provide quantitative uncertainties for parameters in most of its processes, mainly with log normal distributions (Ivanov et al., Reference Ivanov, Honfi, Santandrea and Stripple2019). To incorporate the intended traits in the LCA, a trait-based model was developed based on the growth performance equations presented by van Milgen et al. (Reference van Milgen, Valancogne, Dubois, Dourmad, Sève and Noblet2008) (also applied in InraPorc®) and linked to the emissions and excretions according to Rigolot et al. (Reference Rigolot, Espagnol, Pomar and Dourmad2010a and Reference Rigolot, Espagnol, Robin, Hassouna, Béline, Paillat and Dourmad2010b). The quantities of all feed ingredients were linked to the related traits, such as ADFI and fattening duration, by considering their incorporation rate in the diet. This integrated and connected model made it possible to perform uncertainty and sensitivity analyses in SimaPro. To evaluate the impact of the LCA model parameter uncertainty on the results, the line mean values of the performance traits (ADFI, FCR, ADG, BP/BL ratio, PD, fattening duration, BP and BL at slaughter and BFT) were extracted from the experimental data and InraPorc® outputs and used as inputs for the uncertainty analysis. Then the parallel Monte Carlo simulations were run on the two lines jointly to evaluate the sensitivity of the impact categories to the model parameter uncertainties.
Sensitivity analysis
Sensitivity analysis is the study of the relative importance of the different input parameters in the model outputs. To perform a sensitivity analysis, it is necessary to have a parametric model in which all the parameters are mathematically interlinked (Supplementary material S1). To perform the sensitivity analysis on animal performance traits, related traits had to be incorporated in the model as direct input parameters accompanied by their distributions. In this way, any change in animal traits propagates through the model and affects the appropriate material, process, emission and excretion sub-inventories in the LCI.
An one-at-a-time (OAT) sensitivity analysis, an appropriate approach for limited parameter and linear LCA models, was conducted based on the upper and lower bounds of the 95% confidence interval (CI) (±2 SD) of the main production trait distributions. The LCA model was considered sensitive to a trait if a change in any impact value was greater than 5% after a change to the upper and lower bounds of the intended trait compared to the initial impact value (Mackenzie et al., Reference Mackenzie, Leinonen, Ferguson and Kyriazakis2015). The OAT sensitivity analysis of the traits made it possible to identify the best candidate traits for improvement in the corresponding environmental impact categories.
Results
Traits comparison between lines
Prior to LCA, a statistical review of the experimental data provided a general overview on the variation in the growth performance traits between the two lines. The mean growth performance traits in the two lines were compared with a Student’s t test (Table 2) as well as the trait predictions from InraPorc®. The FCR differed significantly between the lines (−130 g/kg gain for LRFI compared to HRFI pigs; P < 0.001), as did the ADFI (P < 0.0001) and RFI (P < 0.01). The lines also differed in their ADG (P < 0.05), age at slaughter (P < 0.05), fattening duration (P < 0.05), but not in BW at slaughter (P = 0.43). The two lines had similar protein content at slaughter (P = 0.32), but not lipid content, back fat thickness and LMP (P < 0.0001), leading to a difference in the BP/BL ratio (P < 0.0001).
Table 2 Growth performance traits and InraPorc® estimations of body composition of pigs in low residual feed intake (LRFI) and high residual feed intake (HRFI) lines
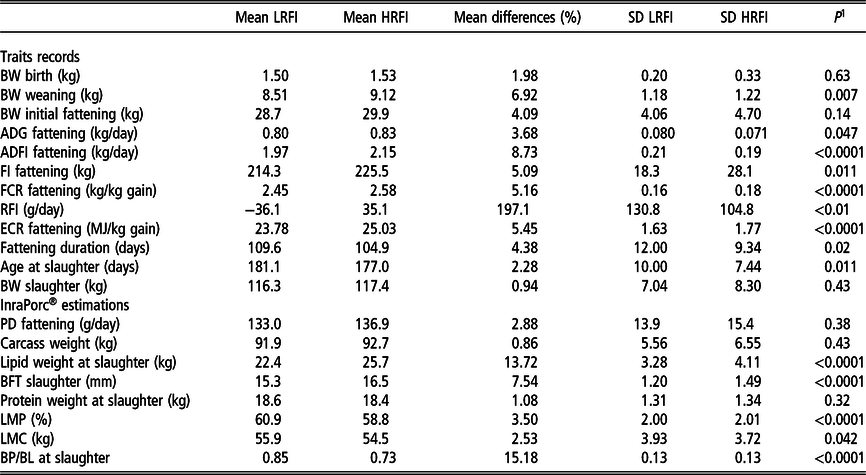
BW = body weight; ADG = average daily gain; ADFI = average daily feed intake; FI = total feed intake; FCR = feed conversion ratio; RFI = residual feed intake; ECR = energy conversion ratio; PD = protein deposition; BFT = back fat thickness; LMP = lean meat percentage; LMC = Lean meat content; BP/BL = ratio of body protein weight/ Body lipid weight at slaughter.
1 P were calculated via a t test on the line effect.
Individual life cycle assessment on the low and high residual feed intake lines
The five impact categories were calculated for 116 pigs through individual LCA. The outcomes of individual LCA on the LRFI and HRFI lines in the five impact categories are summarised in Table 3. The values in all impact categories were lower in the LRFI line than in the HRFI pigs (P < 0.0001): CC (2.60 v. 2.77 kg CO2-eq), AP (44.5 v. 48.1 gr SO2-eq), EP (3.35 v. 3.63 g P-eq), LO (4.19 v. 4.45 m2a) and WD (0.044 v. 0.047 m3). The minimum and the maximum differences between HRFI and LRFI were in LO (6.01%) and EP (8.02%), respectively, and the average difference for the five impact categories was 7%. To test the relative contributions of the different processes involved in the LCA, the impact categories were segmented into feed, housing and manure and on-farm water and energy (electricity, gas, etc.) use. Their percentage contribution to each segment is shown in Figure 2 for the two lines combined, as there were limited line differences. Feed had the maximum share in the impact categories of CC (72%), LO (100%) and WD (79%), whereas housing and manure had the biggest share in EP (66%) and AP (60%). On-farm water and energy had relevant impacts only in WD (28%).
Table 3 Five impact categories calculated per kg pig weight at farm gate by the life cycle assessment (LCA) model based on ReCiPe 2016 Midpoint (H) V1.13 method for low residual feed intake (LRFI) and high residual feed intake (HRFI) lines

P = phosphorous; m2a = area time; m3 = cubic meter;
1 P were calculated via a t test on the line effect.

Figure 2 Relative contribution of the segmented pig farming processes within the system boundary of life cycle assessment (LCA), in the five impact categories. Feed ingredients are clustered as 1. feed; 2. emissions and excretion during housing, manure storage and spreading are clustered as housing and manure; 3. On-farm consumption of water and energy are clustered as on-farm water and energy. CC = climate change; AP = acidification potential; EP = freshwater eutrophication potential; LO = land occupation; WD = water depletion.
The correlations between impact categories and performance traits, obtained from experimental data (ADG, FCR, ADFI and RFI) and traits simulated by InraPorc® (BP/BL ratio, BFT, PD, BL, and BP), are reported in Table 4. Based on the 95% CI of the correlation estimations, no line differences were evident, except for BP with EP and AP, with a higher negative correlation in LRFI line. All impact categories were highly correlated to FCR, with values higher than 0.96 for both lines. All impact categories had moderate to high correlations with RFI (from 0.51 in HRFI pigs to 0.74 in LRFI pigs) and BP/BL ratio (values between −0.68 and −0.85). All impact categories are highly correlated to BFT, BP, BL and PD, with the absolute values higher than 0.48 for both lines except BP for HRFI line whose correlations had lower magnitude with AP and EP.
Table 4 Phenotypic correlations (95% CI) of five environmental impact categories with the recorded traits in the low residual feed intake (LRFI) and high residual feed intake (HRFI) pig lines

ADG = average daily gain; ADFI = average daily feed intake; FCR = feed conversion ratio; RFI = residual feed intake; Outcomes from InraPorc®: PD = protein deposition; BFT = back fat thickness; BP/BL = ratio of body protein weight/ Body lipid weight; Outcomes from life cycle assessment: CC = climate change; AP = acidification potential; EP = fresh water eutrophication potential; LO = land occupation; WD = water depletion.
Uncertainty analysis
A parallel Monte Carlo simulation study based on the mean values of the traits was run on both lines. The results are graphically represented in Figure 3 in five impact categories. In 100% of the simulations for CC, AP, EP and LO and 61% for WD, the LRFI line had less impacts than the HRFI line, indicating that the line differences are not sensitive to the uncertainty of the model parameters imbedded in SimaPro, except for WD.

Figure 3 Life cycle assessment (LCA) applied to parallel Monte Carlo simulations for the high residual feed intake (HRFI) and low residual feed intake (LRFI) lines. The figure shows the percentage of scenarios from 1000 Monte Carlo simulations in which each line outperformed the other. Parallel Monte Carlo simulations use identical values from shared uncertainties to calculate environmental impacts. Therefore, the percentage difference in the results can be referred to as the difference between the lines. Positive values are associated with simulations in which the HRFI line has more favourable impacts than LRFI pigs, and negative values, the reverse.
Sensitivity analysis
To perform the OAT sensitivity analysis, all incorporated production traits were kept constant, but the value of one trait was changed by ± 2 SD based on the distributions listed in Table 2. The focus traits BP, ADG, ADFI, PD, BL, FCR and BP/BL were changed OAT.
The percentage change in the environmental impact categories compared to the initial impact values due to the changes in any trait are presented in Figure 4. For all categories, the environmental impacts were sensitive to ADFI, ADG, FCR, BP and PD, which corresponded to more than 5% changes in the impacts compared to the initial values. The maximum and the minimum sensitivity for ADFI (+20.6% and −10.7%) were related to EP and WD, for ADG (+17.6% and −10.5%) to LO and WD, for FCR (+13% and −8%) to EP and WD, for BP (+17.7% and −9%) to EP and WD and for PD (+21% and −16%) both maximum and the minimum sensitivity were related to EP.

Figure 4 One-at-a-time sensitivity analysis based on the performance traits for the low residual feed intake (LRFI) and high residual feed intake (HRFI) pig lines. Percentage of changes in environmental impacts compared to the mean values due to changes in ± 2 SD in each trait. ADFI = average daily feed intake; ADG = average daily gain; BP = body protein at slaughter; BP/BL = ratio of body protein and body lipid at slaughter; PD = average daily protein deposition; BFT= back fat thickness; FCR = feed conversion ratio; BL = body lipid content at slaughter.
Discussion
The aim of this study was to develop a model to evaluate the environmental impacts of selection for feed efficiency using comparative LCA and to apply the model to individual records of two divergent pig lines after five generations of selection for RFI. The FCR is correlated with RFI, and selection for reduced RFI has been shown to also reduce the FCR in these lines (Gilbert et al., Reference Gilbert, Billon, Brossard, Faure, Gatellier, Gondret, Labussière, Lebret, Lefaucheur, Le Floch, Louveau, Merlot, Meunier-Salaün, Montagne, Mormede, Renaudeau, Riquet, Rogel-Gaillard, van Milgen, Vincent and Noblet2017). Lower FCR is generally due to lower feed intake, higher BW gain or both. Major differences in ADFI in the two lines and minor differences in ADG indicated that lower FCR in LRFI was mostly due to lower ADFI, which matches the objectives of selecting for RFI and agrees with earlier results in the same lines at that stage of the selection experiment (Gilbert et al., Reference Gilbert, Bidanel, Gruand, Caritez, Billon, Guillouet, Lagant, Noblet and Sellier2007).
Studies have reported a negative (favourable) correlation between RFI and body leanness (e.g. Cai et al., Reference Cai, Casey and Dekkers2008). On the other hand, energy partitioning between PD and fat deposition can be modified by improving the feed efficiency (Noblet and van Milgen, Reference Noblet and van Milgen2004). If the general weight gain was little affected by selection, the InraPorc® model showed that the protein to lipid ratio differed significantly between the lines, mainly due to the significant differences in lipid content at slaughter, meaning that selection for LRFI improved the protein to lipid ratio mainly through reduced LD and back fat thickness, in agreement with the hypothesis stated by Dekkers and Gilbert (Reference Dekkers and Gilbert2010) concerning the switch of more efficient pigs to a more oxidative metabolism.
Inferring from the differences between LRFI and HRFI feed intake, we hypothesised that the lines would have different environmental impacts. Indeed, the LRFI impacts were on average 7% lower than HRFI impacts in all categories, in agreement with the positive genetic correlation between FCR and RFI with excretion traits (N and P) reported by Saintilan et al. (Reference Saintilan, Mérour, Brossard, Tribout, Dourmad, Sellier, Bidanel, van Milgen and Gilbert2013) and Shirali et al. (Reference Shirali, Doeschl-Wilson, Knap, Duthie, van Arendonk, Roehe and Kanis2012) who used models at the level of the animal only to predict individual excretion of pigs.
Differences in the level of environmental impact categories between different LCA studies may be due to the differences in the methods, inventories, assumptions, emission factors and system boundaries. To guarantee consistency in the calculation model, LCA method, inventories and system boundary, when comparing the lines, we applied the same model to both. By changing the method to the CML-IA baseline V3.04 (Center of Environmental Science of Leiden University, http://cml.leiden.edu/software/data-cmlia.html) with the same inventories, the impact values decreased to 2.56 kg CO2-eq for LRFI and to 2.70 kg CO2-eq for HRFI, confirming the importance of the model for comparing impacts. Thus, although it may not be reasonable to compare the results of two different studies, one can reasonably compare their orders of magnitude and range. The values of the CC impact for LRFI and HRFI were in the same ranges as the values reported by Dourmad et al. (Reference Dourmad, Ryschawy, Trousson, Bonneau, Gonzàlez, Houwers, Hviid, Zimmer, Nguyen and Morgensen2014) (2.3 to 3.5 kg CO2-eq/kg LW) and de Vries and de Boer (Reference de Vries and de Boer2010) (2.3 to 5.0 kg CO2-eq/kg LW) for typical European production farms. The impacts of LRFI and HRFI on AP were also in the range of values reported by de Vries and de Boer (Reference de Vries and de Boer2010) (8 to 120 g SO2-eq/kg LW). The impact on EP for LRFI and HRFI differed from the impacts reported in the literature. These variations were due to the use of ReCiPe midpoint 2016, which accounts for the impact of freshwater EP based on P-eq rather than PO4-eq. When EP was calculated based on PO4-eq (according to the CML-IA baseline method) the values changed to 25 g PO4-eq for LRFI and 27 g PO4-eq for HRFI, which is in the same range of values reported by de Vries and de Boer (Reference de Vries and de Boer2010) (12 to 38 g PO4-eq/kg LW). The LO values were also in the range reported by de Vries and de Boer (Reference de Vries and de Boer2010) (4.2 to 6.9 m2/kg LW).
Clustering the different processes involved in the system boundary provided further insights into the relative contributions of each segment to the impact categories, with limited differences between lines. The relative importance of feed and manure were in accordance with the results published by Garcia-Launay et al. (Reference Garcia-Launay, van der Werf, Nguyen, Le Tutour and Dourmad2014). The higher feed contribution to three impact categories of CC, LO and WD is certainly the main driver of the higher environmental impacts of HRFI compared to LRFI. Moreover, as HRFI pigs consume more feed with limited difference in digestibility (Barea et al., Reference Barea, Dubois, Gilbert, Sellier, van Milgen and Noblet2010; Montagne et al., Reference Montagne, Loisel, Le Naou, Gondret, Gilbert and Le Gall2014), they excrete more nutrients and produce more manure because of the mass balance. Considering manure as organic fertiliser partly compensated for the higher environmental impacts of HRFI associated with higher excretion and emission rates. Relative contribution of the segmented process confirmed that improving feed efficiency and manure management presents the main opportunities for improvement in pig farming.
According to the average values of the traits, the RFI lines only marginally differ in BP and PD (P = 0.32). The PD plays a role in affecting the environmental impacts in two ways. On the one hand, BW is strongly dependent on protein accretion and LD (Noblet and Etienne, Reference Noblet and Etienne1987), which could affect FCR. On the other hand, changes in protein content influence N retention and subsequent excretion. Excreted N is at the origin of the emissions of N gas as N2O and NH3 during animal housing, outdoor storage of manure and application of manure in the field. A change in body protein, on the one hand, alters FCR through a change in BW, and on the other hand, may – due to a domino effect – influence all downstream N-associated excretions and emissions. While all impact categories are moderately correlated to PD (−0.58), the marginal difference in the lines in BP suggests that selection for RFI would have only limited effects on PD and thus N excretion, which is one of the main sources of environmental impacts. However, the RFI correlations with impacts were of similar magnitude as PD, which could indicate that these two criteria would reduce the environment impacts partly via different levers. Thus, it could be inferred that selection for RFI could be combined with other criteria to target PD. In that respect, the close genetic correlation between FCR and lean meat growth rate (Clutter et al., Reference Clutter, Rothschild and Ruvinsky2011) makes this trait a more promising criterion for environmental improvement, which from a practical perspective is interesting, as it has been for decades the main criterion used on pig farms to improve feed efficiency. The very high correlation between FCR and all impact categories confirmed FCR as a key trait to reduce the environmental burdens of pig production. However, selecting for FCR has major impacts on decreasing leanness, which might not be any more desirable for some commercial lines in the future. Our study shows that RFI would be a valid alternative to select for feed efficiency with positive environmental impacts.
The statistical analysis of the results of individual LCA, performed on all pigs, revealed that the lines are significantly different for the five categories of environmental impacts. The results of parallel Monte Carlo simulations confirmed these differences and showed that the line difference is not sensitive to the model parameter uncertainties. The OAT sensitivity analysis showed that the impact categories are highly sensitive to ADFI, PD, ADG and FCR and less sensitive to BFT, BL and BP/BL. On the other hand, the correlations between the impacts and the traits show that the impacts are highly correlated to FCR, BP/BL, BFT and BL. This discrepancy between the OAT results and the correlations obtained from individual LCA could be due to not considering the correlations between the traits in the OAT sensitivity analysis, as proposed by Ottosen et al. (Reference Ottosen, Stephen, Mackenzie, Wallace and Kyriazakis2019). Consequently, further global sensitivity analyses accounting for trait dependencies should enable a more global understanding of the influence of genetic trait changes on the environmental impacts. Ultimately, this could be used to propose new selection indexes optimising the economic and environmental components jointly, as explored recently by Besson et al. (Reference Besson, Komen, Rose and Vandeputte2020).
Conclusion
The feed-efficiency concept arose from an economic incentive as the ratio of gain (pig weight gain) to cost (feed). To date, emissions associated with pig farming have not been accounted for in selection strategies, neither as a cost nor as an income. In the environmental context, P and N excretions, associated emissions and other fluxes emerge as main sources of the environmental burden of pig farming. Ignoring that economic drivers influence the main sources of environmental costs was pointed out, and we suggest that including environmentally optimised criteria could alleviate the environmental burden of pig production, while still satisfying economic requirements. Consequently, our study shows that more optimal selection criteria could emerge through restructuring the trait weights from an environmental point of view.
Acknowledgements
This study is part of a European collaborative project (SusPig), financially supported by the European Research Area on Sustainable Animal (ERA-NET SUSAN) production (www.era-susan.eu) via the French National Research Agency contract ANR-16-SUSN-0005. Data were collected in the framework of the PIG_FEED project funded by the French National Research Agency ANR-08-GENM-038. The authors are grateful to the staff of the experimental farm for data collection and animal care. The authors want to acknowledge the two anonymous reviewers for their precious comments and recommendations.
T. Soleimani 0000-0001-6101-6530
Declaration of interest
None.
Ethics statement
None.
Software and data repository resources
The model was not deposited in an official repository.
Supplementary material
To view supplementary material for this article, please visit https://doi.org/10.1017/S175173112000138X


 Open access