


Background
Schizophrenia is a highly complex mental disorder and the diagnosis primarily depends on the patient's clinical symptoms along with the psychiatrist's training and expertise. Structural magnetic resonance imaging (MRI) has been used to identify the neuroanatomic correlates of schizophrenia, provide important information about possible pathophysiological mechanisms and facilitate accurate identification of the disorder. Voxel-based morphometry (VBM) is widely used to evaluate alterations in regional grey and white matter volumes across the whole brain.
Previous meta-analytic studies have concluded that patients with schizophrenia exhibit reduced grey matter volumes in some regions within the limbic and paralimbic zones, including the insula,Reference Glahn, Laird, Ellison-Wright, Thelen, Robinson and Lancaster1 superior temporal gyrus,Reference Honea, Crow, Passingham and Mackay2 medial temporal gyrus,Reference Honea, Crow, Passingham and Mackay2 anterior cingulateReference Glahn, Laird, Ellison-Wright, Thelen, Robinson and Lancaster1 and thalamus.Reference Glahn, Laird, Ellison-Wright, Thelen, Robinson and Lancaster1 The pallidumReference van Erp, Hibar, Rasmussen, Glahn, Pearlson and Andreassen3 and striatumReference Ellison-Wright, Glahn, Laird, Thelen and Bullmore4 have been reported to have increased volumes in patients with schizophrenia. However, conflicting findings have also been reported. For instance, in one study smaller volumes in the putamen were reported in people with schizophreniaReference Farnia, Farshchian, Farshchian, Alikhani, Bahmani and Brand5 but in another study the putamen tended to increase in volume with illness duration.Reference van Erp, Hibar, Rasmussen, Glahn, Pearlson and Andreassen3 Additionally, significant reductions in the temporal poleReference Gur, Turetsky, Cowell, Finkelman, Maany and Grossman6 and occipitalReference Zhao, Zhu, Liu, Pu, Lai and Chen7 grey matter volumes have been reported in schizophrenia, but these regions have rarely been reported in meta-analyses. These inconsistencies may have a variety of causes, such as limited sample sizes, heterogeneity in clinical characteristics and symptoms, and differences in the scanning protocols and analytic methods.
Traditional meta-analyses that have summarised statistical findings reported in the literature are coordinate-based and thus may be limited by the reported peak coordinates in the primary studies, leaving some regions unexplored or findings for some regions inconsistent.Reference van Erp, Hibar, Rasmussen, Glahn, Pearlson and Andreassen3,Reference Ellison-Wright, Glahn, Laird, Thelen and Bullmore4,Reference Salimi-Khorshidi, Smith, Keltner, Wager and Nichols8 With the rapid growth of neuroimaging data-sets, large-scale multisite studies have shown that prospective, image-based meta-analysis strategies that pool statistical results computed at multiple sites using uniform image processing and analytic methodsReference Salimi-Khorshidi, Smith, Keltner, Wager and Nichols8 are highly effective for identifying the consistency of abnormalities related to brain disorders.
Use of deep-learning techniques
In contrast to group-level statistical analysis, deep-learning techniques, such as convolutional neural networks (CNNs) and deep neural networks (DNNs), have attracted recent interest for automatically discriminating patients with schizophrenia from healthy controls at an individual level. However, most of the studies have assessed the resulting model's generalisability using cross-validation strategies in which both the training set and the test data were from the same site. The task of validating classifiers in a completely independent data-set is particularly meaningful for clinical translation but is also very challenging.
To our knowledge, only a few studies have investigated independent replications using neuroanatomical features for the identification of schizophrenia with deep learning, and each of them reported lower accuracies when using a different validation sample than when using a single sample.Reference Oh, Oh, Lee, Chae and Yun9–Reference Hu, Qian, Liu, Koh, Sim and Jiang12 For instance, Oh and colleagues trained 3D CNNs and obtained 70% accuracy in a completely independent data-set.Reference Oh, Oh, Lee, Chae and Yun9 Previous studies used either shallowReference Oh, Oh, Lee, Chae and Yun9 or deepReference Hu, Qian, Liu, Koh, Sim and Jiang12 CNN architectures, but both had a poorer performance when using a completely different data-set for validation. This may be because the number of samples (hundreds) is relatively small compared with the input of high-dimensional image data with a large number of voxels (hundreds of thousands) in CNN models; this can increase the risk of overfitting.
In terms of DNN studies, Vieira et al used surface- and voxel-based volume and thickness features, tested traditional machine learning and DNN models, and found that all the models generalised poorly to independent data-sets (with the highest accuracy being 70.5%).Reference Vieira, Gong, Pinaya, Scarpazza, Tognin and Crespo-Facorro10 To reduce the feature dimensions, they used principal component analysis, which is an unsupervised method and does not account for clinical labels. The reduced reproducibility in independent data-sets may also be attributable to a number of issues such as sample variability and differences in imaging protocols.
Aims
To overcome the limitations of previous studies and more reliably identify structural abnormalities associated with schizophrenia and facilitate the generalisation to independent cohorts, the present study recruited a relatively large sample of individuals with schizophrenia from eight sites across China (1275 participants) and harmonised the data acquisition. We used image-based group-level statistical analysis and individualised pattern classification of schizophrenia to detect reliable structural alterations related to schizophrenia. We set out to differentiate patients with schizophrenia from healthy controls using neuroanatomical features via feature selection, l 1 norm regularisation and DNN architectures to avoid overfitting. To assess the generalisability and robustness of our classifiers, we validated our classification models using a leave-one-site-out approach.
We hypothesised that, compared with healthy individuals, patients with schizophrenia would show neuroanatomical abnormalities in brain regions in the limbic and paralimbic zones using a group-level analysis and that these identified regions could be consistently identified using data-driven DNNs and would have the capacity to automate the identification of schizophrenia at the individual-participant level. As schizophrenia is heterogeneous in its clinical characteristics, we also anticipated that our classification architecture would be able to discriminate subsamples, i.e. discriminate both patients with a first episode and patients who have relapsed from healthy controls. The present study set out to increase understanding about the morphological features of schizophrenia and also to facilitate the use of automated identification systems in clinical settings.
Method
Participants
The participants were drawn from the Brainnetome Project for Schizophrenia, a multisite study examining sensitive biomarkers for the prognosis, diagnosis and monitoring of schizophrenia in individuals aged 18- to 45-years-old. The participants were recruited from seven hospitals in China: Peking University Sixth Hospital; Beijing Huilongguan Hospital; Xijing Hospital; Henan Mental Hospital; Guangzhou Brain Hospital; Renmin Hospital of Wuhan University; and Zhumadian Psychiatric Hospital. Henan Mental Hospital used two different MRI scanners, Siemens and General Electric, therefore in total there were eight scanning sites. The study at each site was approved by the local ethical review board. All the participants provided written informed consent.
In total, 662 patients and 613 health controls were included in the analysis. All the patients had a diagnosis of schizophrenia confirmed by trained psychiatrists using the Structured Clinical Interview for DSM-IV-TR Axis I Disorders (SCID-I, patient edition).Reference First, Spitzer, Gibbon and Williams13 None of the health controls had any personal history of psychotic illness nor any family history of psychosis in their first-, second- or third-degree relatives. For detailed descriptions of the samples and methods please refer to the Supplementary File 1 and Supplementary Tables 1–2 available at https://doi.org/10.1192/bjp.2022.22.
Image acquisition and processing
Three types of 3 T MRI scanners (four Siemens, three General Electric and one Philips) were used at the eight participating sites. Uniform scanning protocols for all eight sites were set up by an experienced expert to ensure equivalent and high-quality data acquisition. The MRI scan sequences and parameters for each site are listed in Supplementary Table 3. All the T 1-weighted images were processed using Statistical Parametric Mapping (SPM8, Wellcome Department of Imaging Neuroscience, London, UK) to obtain smoothed modulated grey matter, white matter and cerebrospinal fluid (CSF) maps.
Statistical analysis
Group differences in regional grey and white matter volumes were investigated by comparing the pre-processed grey and white matter images from the patients with schizophrenia with those from the health controls using two sample t-tests at each individual site with age and gender as covariates.Reference Lemaître, Crivello, Grassiot, Alpérovitch, Tzourio and Mazoyer14 Note that the modulated grey and white matter images had been corrected by individual brain sizes; therefore, intracranial volume was not needed as a covariate in the statistical models.
To evaluate the replicability of the abnormal morphological regions across the eight sites, a second-level random-effects image-based meta-analysis was used to pool the statistics from the individual sites. The effect sizes were calculated using Hedge's g, which was calculated using each site's means, s.d.s and corresponding sample size to provide an unbiased standardised mean difference that incorporated a correction for small sample size.
A Bonferroni correction accounting for the number of voxels tested (i.e. 422 078 voxels) was used for multiple comparisons with a conservative threshold of P < 0.05/422 078 = 1.18 × 10⁻⁷. As the characteristics of the structural signature of schizophrenia may be affected by medication, we correlated the altered brain volumes with the antipsychotic dosage while controlling for age, gender and site.
Overview of multisite classification procedure
In addition to the voxel-based morphometry analyses, we conducted an automated classification of schizophrenia based on the multisite VBM pre-processed features (grey matter, white matter and CSF) to examine whether the structural features can be used to differentiate the patients with schizophrenia from the health controls at the individual-participant level. To ensure generalisation and reduce variability, we evaluated our model using a leave-one-site-out cross-validation process, with one of the eight sites used as test data and the remaining seven as training data. Thus, there were eight experiments in total, and each research site was used once as the test data. The final classification results represented the average of these eight independent experiments. The classification stages are listed in Supplementary Fig. 1 and described below.
Feature extraction and selection
Voxel-based volumetric features were extracted from the normalised and modulated grey matter, white matter and CSF images prior to smoothing. Our feature-selection procedure, which was conducted on the training set, consisted of several stages. First, each feature vector was z scored across all individuals at each site to reduce the range of variations caused by the scanners. Second, to rule out demographic differences between the sites,Reference Rozycki, Satterthwaite, Koutsouleris, Erus, Doshi and Wolf15 we estimated the age and gender effects within a pooled sample of health controls in the training set using a general linear model, and the coefficients of age and gender were then applied to all the participants in the training and test sets. Finally, feature selection was achieved by ranking the features by Fisher scores and selecting the top 10% of the ranked features. In the end, our selected feature subset contained 20 023 features.
DNN models
In this study, we present a DNNs aimed at determining the representation of high-dimension voxel features. The idea of using DNN was inspired by the previous literature.Reference Hazlett, Gu, Munsell, Kim, Styner and Wolff16 We took grey matter, white matter and CSF extracted from neuroimaging data as the network input. The binary classifier output node corresponded to the schizophrenia and health control groups. Formally, let W = {W l|l = 1, 2, …, L} be a DNN model consisting of L layers. Let X = {x i|i = 1, 2, …, N} be the training feature set. N is the sample size, and let Y = {y i|i = 1, 2, …, N} denote the corresponding one-hot label set ([1, 0]T for a control and [0, 1]T for a patient). In this paper, the optimisation for training the DNN model W is defined as:

where the network loss function $L( W ) = \sum\nolimits_{i = 1}^N {D( y^i, \;p( y\vert x^i, \;W) ) }$ is averaged over the whole training feature set. D(y i, p(y|x i, W)) represents the cross entropy between the distribution of the training sample and the output from a DNNs model. Specifically, p(y|x i, W) is the softmax function in the experiment; thus $L( W ) = {-}( 1/N) \sum\nolimits_{i = 1}^N {\sum\nolimits_{j = 1}^2 {1\{ {y^{( i ) } = j} \} {\rm log}( p( {\rm y}\vert x^i, \;W) ) } }$
 .
.
In addition, DNN model optimisation is inherently difficult owing to the abundant parameters in the voxel-level high-dimensional input. To overcome this issue, the lasso method has been widely adopted to reduce the model complexity. The lasso in the DNN model is an efficient feature-selection strategy that yields a sparse solution, particularly in dealing with the high dimensionality of the input and intrasubject variability. Therefore, we added the l 1 norm regularisation term ${\parallel} W\!\!\parallel _1$ with a weight decay λ 1. l 1 norm regularisation is a sparsity constraint that can also effectively reduce the risk of overfitting when using high-dimensional features. Now, the optimisation problem can be readily solved using the stochastic gradient descent algorithm. Thus, the optimisation strategy can be formulated as $W_l^t = W_l^{t-1} + ( \partial L/\partial W_l^{t-1} ) + \lambda _1{\rm sign}( {W_l^{t-1} } )$
 .
.
In the present study, our DNN model consisted of a six-layer architecture, of which the channels were 20 023, 5000, 2000, 800, 200 and 2. We used layer-wise relevance propagation (LRP) to back-propagate the final two-dimensional classification scores, and quantified the region of interest (ROI)-based contributions to the DNNs and meta-analysis to ascertain the consistently altered brain regions. The training setup and LRP calculations are in Supplementary File 1.
For comparisons with the DNN, support vector machines (SVMs) and CNNs were performed in the automated classification procedure. In addition, DNN models with the same architecture were retrained to separately discriminate the patients with a first episode and the patients who had relapsed from the health control group and to identify the discriminating features contributing to the DNN models.
Results
Statistical analysis
Sociodemographic and clinical data are presented in Table 1. No statistically significant differences in age or gender were noted between the schizophrenia group and the health controls. Compared with the health controls, the schizophrenia group had a significantly smaller regional grey matter volume at each of the eight sites (Supplementary Fig. 2). At most of the sites the differences were most pronounced in the frontal and temporal lobes, insular cortex and thalamus. We observed more circumscribed frontal and temporal reductions in the data from the Henan Mental Hospital (Siemens scanning site) and Zhumadian Psychiatric Hospital sites. The most pronounced pattern of reductions in the patients obtained by a meta-analytic approach included the inferior, middle and orbital frontal cortices, superior and middle temporal gyrus, temporal pole, insula, middle cingulate cortex and thalamus (Fig. 1a). The white matter volumes did not show consistent abnormalities across the sites.
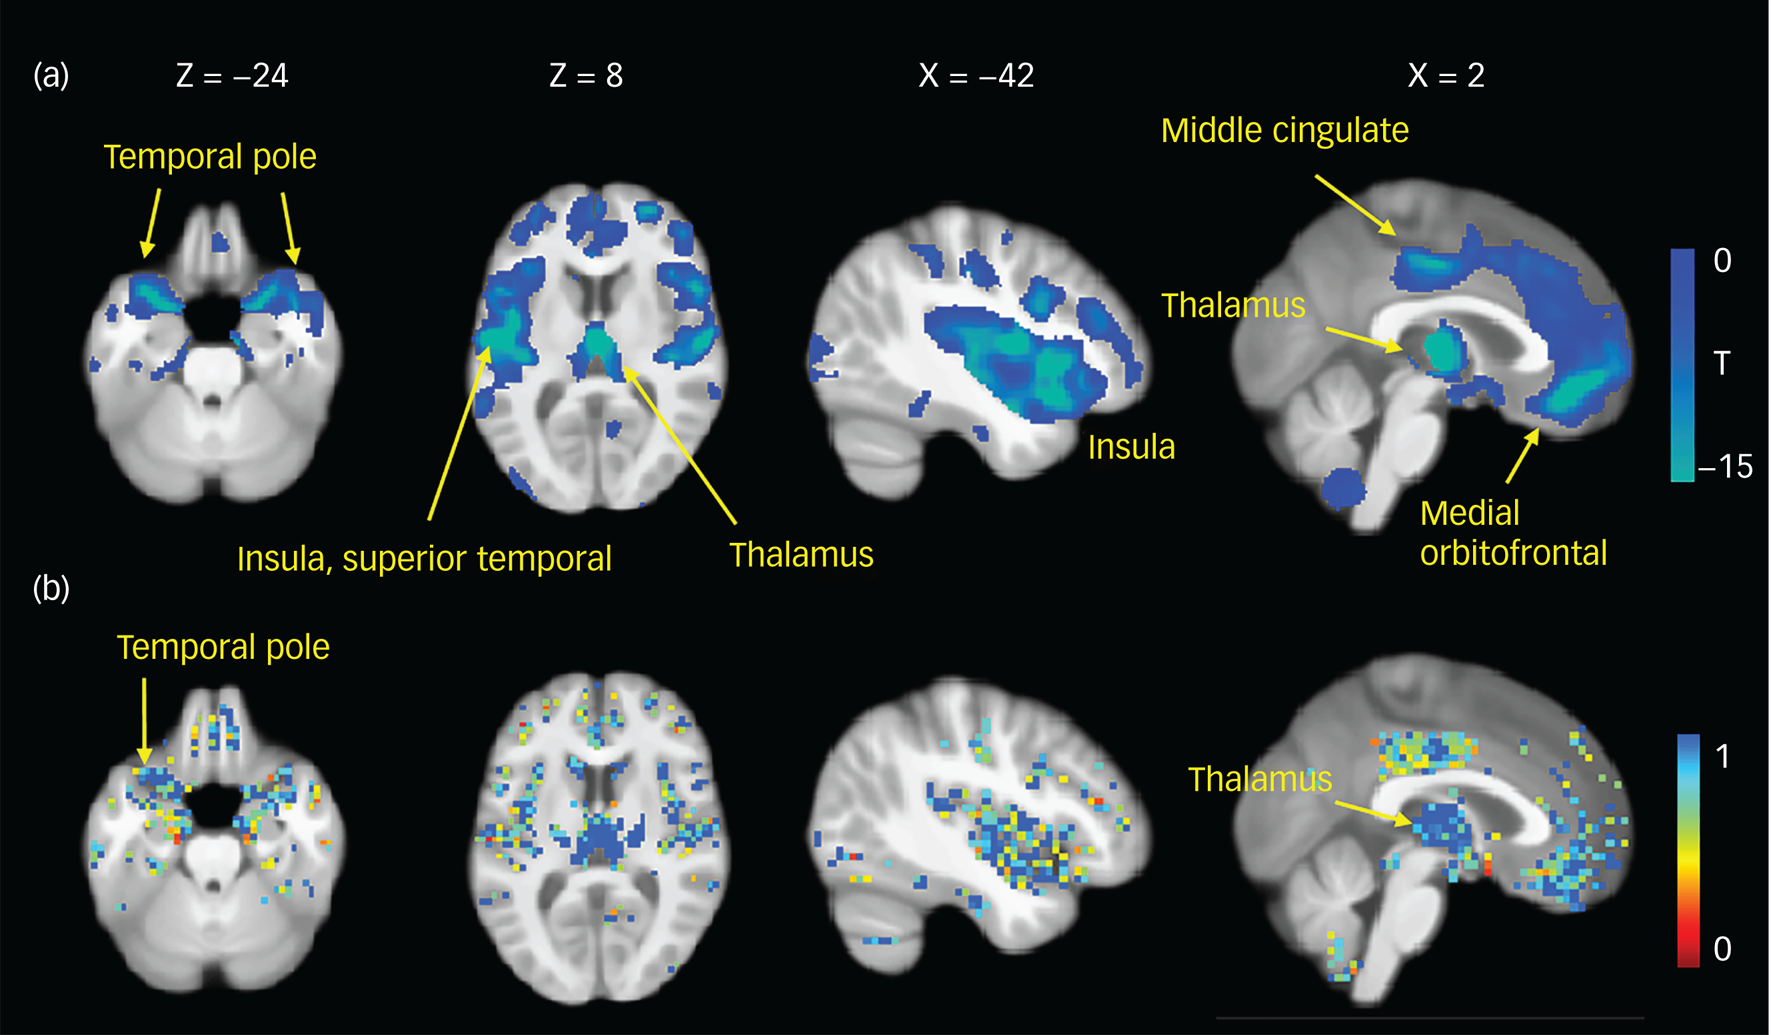
Fig. 1 Similar patterns of grey matter abnormalities using meta-analytic (a) and pattern classification (b) approaches. (a) Statistical maps displaying grey matter volume reductions in patients with schizophrenia compared with healthy controls. A Bonferroni correction was used for multiple comparisons with a threshold of P < 1.18 × 10⁻⁷. The colour bar indicates T values. (b) Voxel probability maps of reliable grey matter volumetric contributions to schizophrenia using eight classification experiments. A higher value indicates a greater discriminative ability for the classification of patients with schizophrenia.
Table 1 Demographic and clinical characteristics of the patients with schizophrenia and healthy controls

a. Data were missing for 39 patients and 26 controls.
b. Data were missing for 362 patients.
Classification performance
The performance characteristics were determined as the average of eight classification experiments on an independent sample using a combination of grey matter, white matter and CSF. The balanced accuracy (BAC), sensitivity, specificity, and area under the receiver operating characteristic curve (AUC) for the DNN and SVM models are shown in Table 2; the receiver operating characteristic curves are shown in Fig. 2.
Table 2 Classification performance using a combination of grey matter, white matter and cerebrospinal fluid volumetric features in a deep neural network (DNN) and a support vector machine (SVM) for patients with schizophrenia versus healthy controls

BAC, balanced accuracy; AUC, area under the receiver operating characteristic curve.

Fig. 2 Receiver operating characteristic (ROC) curves for the leave-one-site-out deep neural networks (DNN) models (a), support vector machines (SVM) models (b) and the comparison between the average DNN and SVM approaches (c); (d) visualisation of the DNN classification feature space of the last hidden layer with Henan Mental Hospital (General Electric scanning site) as the test data and the remaining seven centres as the training data.
AUC, area under the receiver operating characteristic curve; PKUH6, Peking University Sixth Hospital; HLG, Beijing Huilongguan Hospital; XJ, Xijing Hospital; HMS, Henan Mental Hospital (Siemens scanning site); GB, Guangzhou Brain Hospital; HMG, Henan Mental Hospital (General Electric scanning site); RWU, Renmin Hospital of Wuhan University; ZMD, Zhumadian Psychiatric Hospital.
Figure 2d shows the visualisation of the feature space of the last hidden layer using the tSNE method to illustrate the feature discrimination capability when the Beijing Huilongguan Hospital site was used as the test data.
Our results clearly show that the DNN could discriminate between individuals with schizophrenia and health controls using leave-one-site-out validation, with BACs ranging from 77.19% to 85.74% and sensitivities from 75.31% to 89.29% for single sites, and with a BAC of 81.25%, a sensitivity of 80.97%, a specificity of 81.53% and an AUC of 0.852 for the average of the eight independent experiments. It outperformed SVM classifiers (a BAC of 76.07%, a sensitivity of 78.14% and an AUC of 0.844 for the average of the eight independent sites, P < 0.001 for the accuracy comparison) and CNNs (Supplementary Table 8).
As shown by the voxel probability maps of the grey matter features selected for classification (Fig. 1b), we observed a consistent abnormal pattern in the grey matter in both the multisite meta-analysis and the DNN. By quantifying the contributions of each ROI to the DNNs and meta-analysis both methods showed that the most severely and consistently altered ROI was the thalamus (Supplementary Table 10).
The white matter and CSF features contributing to the DNN are shown in Supplementary Fig. 5. We observed that most of the CSF regions showed a strong relationship with schizophrenia and that the white matter was less affected than the grey matter and CSF. The exclusion of CSF from the classification models resulted in an inferior performance, with about a 3.06% reduction in BAC (Supplementary Table 7), validating the contribution of CSF in identifying schizophrenia. We employed a partial correlation between the grey matter volumes and the antipsychotic dosage while controlling for age, gender and site. No significant correlations were observed after Bonferroni correction for multiple corrections.
We retrained the DNN models to detect subsamples with only the patients with a first episode or patients who had relapsed. The relapse subgroup versus the health control group performance was better than that of the first-episode subgroup versus the health control group (Supplementary Table 5). The first-episode classification model identified more circumscribed regions with lower contribution degrees than the relapsed model (Supplementary Fig. 6).
Discussion
Main findings
In this study, we identified robust schizophrenia-related grey matter abnormalities using a group-level image-based meta-analysis of whole-brain VBM and an individualised classification approach with large-scale multisite structural brain images from 662 patients with schizophrenia and 613 healthy controls. By validating our classification models at eight independent sites, the DNNs correctly classified 81.25% of patients with schizophrenia in eight experiments. The DNNs outperformed the SVM and CNN classifiers. This study identified replicable abnormal neuroanatomical abnormalities in people with schizophrenia using two methods across multiple sites. The identified markers were capable of discriminating patients with schizophrenia from health controls by using hierarchical non-linear architectures that can be generalised to independent cohorts.
Interpretation of our findings and comparison with other studies
We first examined the reproducible anatomical patterns related to schizophrenia using uniform imaging protocols, careful quality control and the same imaging processing of the whole-brain VBM analyses for each site, separately. Then we integrated each statistical result using a prospective, image-based meta-analysis. This strategy can potentially rule out the impact of sample heterogeneity, limited sample sizes, differences in the imaging scanning protocols and variability in the analytic methods.
We found consistently smaller spatially distributed grey matter volumes in patients with schizophrenia relative to healthy controls but observed no consistently increased grey matter or abnormal white matter volumes in those with schizophrenia.
Grey matter volume or density reductions have been demonstrated in people with schizophrenia in a number of studies,Reference Glahn, Laird, Ellison-Wright, Thelen, Robinson and Lancaster1,Reference Ellison-Wright, Glahn, Laird, Thelen and Bullmore4,Reference Haijma, Van Haren, Cahn, Koolschijn, Pol and Kahn17 and may reflect a loss of neurons, neuropil areas or interconnections between regions,Reference Selemon and Goldman-Rakic18 and further cause the functional deficits in those with schizophrenia. Pattern recognition and meta-analysis have identified similar schizophrenia-related patterns, which were mostly characterised by disruptions of limbic and paralimbic regions including the superior temporal gyrusReference Glahn, Laird, Ellison-Wright, Thelen, Robinson and Lancaster1,Reference Haijma, Van Haren, Cahn, Koolschijn, Pol and Kahn17 extending to the Heschl's convolutions,Reference Haijma, Van Haren, Cahn, Koolschijn, Pol and Kahn17 insular cortex,Reference Ellison-Wright, Glahn, Laird, Thelen and Bullmore4 orbitalReference Haijma, Van Haren, Cahn, Koolschijn, Pol and Kahn17 and middle frontal cortices,Reference Ellison-Wright, Glahn, Laird, Thelen and Bullmore4,Reference Haijma, Van Haren, Cahn, Koolschijn, Pol and Kahn17 cingulumReference Glahn, Laird, Ellison-Wright, Thelen, Robinson and Lancaster1 and thalamus.Reference van Erp, Hibar, Rasmussen, Glahn, Pearlson and Andreassen3,Reference Ellison-Wright, Glahn, Laird, Thelen and Bullmore4,Reference Haijma, Van Haren, Cahn, Koolschijn, Pol and Kahn17
Importantly, we identified the thalamus as the most severely affected region in both the DNN models and meta-analytic methods, suggesting a crucial role of the thalamus in the pathophysiological processes of schizophrenia. The thalamus is a deep grey matter structure that relays nearly all information to the cortex, and thus acts as a hub involving multiple functions, including processing sensory information, regulating consciousness, cognition, emotions, etc. Our findings are consistent with previous reports of structural and functional deficits in the thalamus in schizophrenia.Reference Pergola, Selvaggi, Trizio, Bertolino and Blasi19
In addition, we found volumetric reductions in the bilateral temporal poles in patients with schizophrenia using two methods. The temporal poles, together with the insula, cingulate cortex, orbitofrontal cortex and parahippocampal cortices are major regions in the paralimbic zone.Reference Mesulam20 The temporal pole has been implicated in some individual neuroimaging studies,Reference Gur, Turetsky, Cowell, Finkelman, Maany and Grossman6 but has rarely been reported in traditional meta-analysis. The difference between the two types of meta-analyses may have been that traditional meta-analyses cannot fully explore the collected data.Reference van Erp, Hibar, Rasmussen, Glahn, Pearlson and Andreassen3 We observed more circumscribed frontal and temporal reductions in the data from the Henan Mental Hospital (Siemens scanning site) and Zhumadian Psychiatric Hospital participants than from the other research sites. These inconsistencies may in part be because patients with schizophrenia present substantial heterogeneity in clinical characteristics and symptoms, differences in imaging scanners, etc. For instance, patients at the Henan Mental Hospital (Siemens scanning site) had the fewest positive symptoms, which may potentially have influenced structural abnormalities from their data. A strength of our meta-analytic approach is that integrating data from multiple sites provides a large sample size that raises statistical power,Reference Turner, Damaraju, van Erp, Mathalon, Ford and Voyvodic21 and the use of maps derived from individual sites and meta-analysis reduces the effects of intersite heterogeneity.
Identifying schizophrenia on the basis of MRI scans using a fully automated procedure may facilitate clinical diagnosis and has previously been investigated in many studies. However, most of these studies did not utilise independent samples to test the generalisability of the models. The variety of the clinical presentations of schizophrenia poses a challenge for independent replications; however, designing generalised automated diagnostic systems that can be used in clinical settings is highly desirable. In the present study, our classification algorithm was evaluated using eight independent samples to ensure generalisability. We found that the average accuracy over the eight samples marginally outperformed existing reports that included an independent sample for validation and used SVM classifiers (70.4–77% inReference Rozycki, Satterthwaite, Koutsouleris, Erus, Doshi and Wolf15,Reference Nieuwenhuis, van Haren, Pol, Cahn, Kahn and Schnack22 ) or deep-learning approaches (70.0–71.02% inReference Oh, Oh, Lee, Chae and Yun9–Reference Hu, Qian, Liu, Koh, Sim and Jiang12).
Strengths
The strengths of the present study may include the use of hierarchical DNNs that can automatically capture non-linear relationships and subtle hidden patterns in an enriched feature space.Reference Hazlett, Gu, Munsell, Kim, Styner and Wolff16 Accordingly, the brain features and network architectures that we identified as discriminating between the patients with schizophrenia and the health controls may be the ones that are most likely to contribute to the symptoms of schizophrenia and/or may be signposts that can be used to uncover the underlying neural mechanisms of schizophrenia.
Another strength of the current study is that it included multiple participating sites from different regions across China. These regions can accurately represent ‘real-world’ clinical environments with their heterogeneity in patients’ symptoms and scanners.
A third strength is the large sample size of 1275 participants, providing less susceptibility to sampling effects. Notably, we obtained a high sensitivity of 80.97%, with the highest sensitivity being 89.29% for a single site. Such a high sensitivity indicates that our models may be good identifiers for schizophrenia, which is particularly important for patients’ clinical management.
Subgroup analysis
Classifying subsamples of patients showed that discriminating ability was better for patients who had relapsed than for the patients with a first episode. The first-episode classification model identified more circumscribed regions with lower contribution degrees than those in a relapse situation. Therefore, the generalisability of our findings may be limited by the combination of subsamples experiencing various numbers of episodes, and the relapse subgroup may contribute more than the first-episode subgroup in terms of classification and structural alterations because of chronicity.
Inclusion of white matter measures
An automated, image-based classification system may benefit from using measures of grey matter abnormalities along with examinations of white matter and ventricular alterations. Although our multisite statistical analysis did not find reproducible differences in white matter measures, the classification results indicated that they were indispensable as the combination of grey matter, white matter and CSF performed better than when employing grey matter alone or the combination of grey matter and white matter (Supplementary Table 7). This is possibly because pattern recognition techniques can capture non-linear and complex relationships among various features. Different features may be mutually complementary in the enriched feature space, and their combination can thus work as a good classifier. Indeed, white matter abnormalities have been observed at a few individual sites in previous studies.Reference Zhou, Suzuki, Hagino, Takahashi, Kawasaki and Nohara23
Additionally, ventricular enlargement has been reported as one of the earliest and most prominent findings in schizophrenia.Reference Narr, Bilder, Woods, Thompson, Szeszko and Robinson24 This may be related to the shrinkage of brain structures including the thalamus, superior temporal gyrus and insula.Reference Gaser, Nenadic, Buchsbaum, Hazlett and Buchsbaum25
Medication
The structural signature of schizophrenia may be affected by medication. The effect of medication on brain structure is controversial, and we found no correlations between brain volumes and antipsychotic dosage. This is consistent with previous findingsReference Liao, Yan, Liu, Yan, Zhang and Jiang26 indicating that the altered brain volumes may not be because of medication use.
Limitations
There are some limitations to the present study. First, the sample size was indeed large for psychiatric cohorts; however, in the realm of neural nets, it is at the lower limit of mathematical applicability. Future replications are encouraged in larger cohorts with more sites and participants.
Second, we acknowledge that some of the patients had experienced a relatively long illness duration, although 25% of the patients had been ill for less than 1 year. Because the pathological processes associated with schizophrenia occur over a long time, the reliable neuroanatomical signature identified in the present study can still be useful for inferring useful information for the future identification of high-risk patients or patients with several comorbidities.
Third, despite making an effort to reduce the influence of sites and demographic effects, different scanning protocols cannot be fully identical. Finally, although T 1-weighted measures were used, an even better classification ability may be achievable by using neurophysiological measures and/or other structural and functional imaging techniques. Future studies will evaluate the incremental gain of other modalities of features in such automated systems. However, it should be noted that T 1-weighted scans are non-invasive and economical tools that are already widely used in screening assessments for many diseases.
Implications
In conclusion, this study showed a reliable pattern of grey matter abnormalities in people with schizophrenia in the limbic and paralimbic regions and differentiated patients with schizophrenia from healthy controls using a DNN model that combined grey matter, white matter and CSF volumes for multisite, ethnically homogeneous participants. To our knowledge, this is the first study that used image-based meta-analysis to investigate volumetric alterations in people with schizophrenia and replicated the findings using DNN models from multiple independent samples. The consistently identified regions may be related to the pathophysiology of schizophrenia and could serve as promising biomarkers for the identification of schizophrenia and may have applications in clinical settings as a diagnostic tool.
Supplementary material
To view supplementary material for this article, please visit https://doi.org/10.1192/bjp.2022.22.
Data availability
The data that support the findings of this study can be obtained from the corresponding author (T.J.) upon reasonable request.
Acknowledgements
The authors thank Drs Rhoda E. and Edmund F. Perozzi for English editing of the manuscript.
Author contributions
Concept and design: T.J. and Y.C. Analysis and interpretation of data: Y.C., C.L. and T.J.. Drafting of the manuscript: Y.C., C.L. and T.J. Supervision and critical revision of the manuscript: Y.C., C.L., B. L., J.S., M.S. and T.J.. The following provided data, contributed ideas and suggestions for analyses and interpreted results: J.C., Y.C., H.G., P.L., L.Lu, L.Lv, Y.N., P.W., Hua.Wa., Hui.Wa., Hua.Wu., H.Y., J.Y., Y.Y., H.Z. and D.Z.
Funding
This work was supported in part by the National Key Basic Research and Development Program (973) (Grant 2011CB707800), the Strategic Priority Research Program of the Chinese Academy of Sciences (Grant XDB02030300), the Natural Science Foundation of China (Grants 91132301, 31771076, and 82151307) and the Youth Innovation Promotion Association, Chinese Academy of Science.
Declaration of interest
The authors declare no conflict of interest.


eLetters
No eLetters have been published for this article.