


Introduction
China, the world’s most populous country, has had a higher than normal sex ratio at birth (SRB: ratio of live male births to female births, usually calculated by the number of boys to 100 girls) since the early 1980s. The normal range of SRB is between 102 and 107 (United Nations, 1955). The 1982 population census displayed an incipient rise in SRB, and the subsequent census data witnessed a rising tendency. Since 2000, the SRB has stabilized at around 120 male births per 100 female births. The high SRB and its potential implications have aroused considerable controversy in China itself (Jiang et al., Reference Jiang, Li and Feldman2011).
Internationally, high SRBs emerged in the 1980s not only in China, but also across Asian countries such as India and South Korea. The SRB in South Korea started to rise in the early 1980s, reached a level of 115 in 1990, plateaued at 114 in the early 1990s, and then gradually declined to within the normal range in 2007. Since then, it has remained normal, indicating the completion of the SRB transition in South Korea (Guilmoto, Reference Guilmoto2009). China, whose SRB began to rise almost at the same time as South Korea’s, is optimistically expected to follow the same pattern as South Korea, declining and returning to normal in the near future (Chung & Das Gupta, Reference Chung and Das Gupta2007; Guilmoto, Reference Guilmoto2009; Das Gupta et al., Reference Das Gupta, Chung and Li2009).
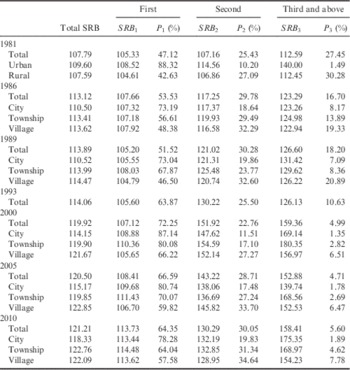
When discussing China’s SRB, one issue is the neglect of the compositional effect by birth order in the synthetic SRB. China’s SRB is characterized by discrepancies in different birth orders. In the 1982, 1990 and 2000 censuses, the SRB for the first birth order was normal; the SRB for higher birth orders was higher than normal. In the 2010 census, the first birth SRB was already 113.7, with much higher SRBs for following birth orders (Population Census Office under the State Council (PCO), 1993, 2002, 2012). Due to the steep gradient between sex ratios of first and subsequent births, the aggregate sex ratio of all births is very sensitive to the birth order distribution (Goodkind, Reference Goodkind2011). The trend in SRB after standardization by birth order distribution may be quite different from that displayed by raw synthetic data.
Among the discussions of SRB, few studies centre on the effect of birth order composition on changes in SRB. Goodkind (Reference Goodkind2011) used standardization method and obtained some different conclusions from those resulting from raw synthetic SRBs. Wang and Guo (Reference Wang and Guo2014) attempted to decompose the total SRB to examine the contribution of both the quantum effect of SRB and birth order composition to the total SRB.
The aim of this paper was to disentangle two effects, namely the effects of variations in SRB by birth order, and the effect of compositional changes of female births by birth order, on the general trend in China’s SRB over the past three decades. Especially, as both China and South Korea started to witness a rise in SRB almost simultaneously, the decomposition results in China and South Korea are compared to see the divergence between the two countries. Decomposition results concerning urban and rural SRBs over the past decades, and results for different provinces, are also provided. Thus this study provides a fuller picture of China’s SRB.
Methods and Data
Decomposition method
Drawing on the decomposition approach used by Kitagawa (Reference Kitagawa1955), Das Gupta (Reference Das Gupta1993) and Jiang et al. (Reference Jiang, Li, Li and Feldman2016a), the method devised for this study can be outlined as follows. Let SRB denote sex ratio at birth, and M and F separately denote numbers of male births and female births during a period of time, so that:
 $$SRB{\,\equals\,}{M \over F}{\times}100.$$
Let m 1, m 2 and m 3 denote the number of male births for the first, second, third and subsequent orders respectively; f 1, f 2 and f 3, denote the number of female births for the first, second, third and subsequent orders separately in the same period; SRB 1, SRB 2 and SRB 3 denote the sex ratio by birth order for the first, second, third and above orders; P 1, P 2 and P 3 denote the proportion of female births for the first, second, third and above orders to the total number of female births in the period. Then:
 $$P_{1} \,{\equals}\,{{f_{1} } \over F},\,P_{{\rm 2}} \,{\equals}\,{{f_{2} } \over F},\,P_{{\rm 3}} \,{\equals}\,{{f_{3} } \over F},\,{\rm and}$$
 $$SRB\,{\equals}\,{M \over F}{\times}100$$
 $$\,{\equals}\,{{m_{1} {\plus}m_{2} {\plus}m_{3} } \over F}{\times}100$$
 $$\,{\equals}\,{{f_{1} } \over F}{\times}{{m_{1} } \over {f_{1} }}{\times}100{\plus}{{f_{2} } \over F}{\times}{{m_{2} } \over {f_{2} }}{\times}100{\plus}{{f_{3} } \over F}{\times}{{m_{3} } \over {f_{3} }}{\times}100$$
 $$\,{\equals}\,P_{1} {\times}SRB_{1} {\plus}P_{2} {\times}SRB_{2} {\plus}P_{3} {\times}SRB_{3} $$
 $$\,{\equals}\,\mathop{\sum}\limits_{i\,{\equals}\,1}^3 {P_{i} {\times}SRB_{i} } $$
Let the superscripts x and y denote different points in time. The decomposition of changes in total SRB can be denoted as follows:
 $$SRB^{x} {\minus}SRB^{y} \,{\equals}\,\mathop{\sum}\limits_{i\,{\equals}\,1}^3 {\left( {P_{i}^{x} {\times}SRB_{i}^{x} {\minus}P_{i}^{y} {\times}SRB_{i}^{y} } \right)} $$
 $$\,{\equals}\,\mathop{\sum}\limits_{i\,{\equals}\,1}^3 {\left[ {{{P_{i}^{x} {\plus}P_{i}^{y} } \over 2}{\times}\left( {SRB_{i}^{x} {\minus}SRB_{i}^{y} } \right){\plus}{{SRB_{i}^{x} {\plus}SRB_{i}^{y} } \over 2}{\times}\left( {P_{i}^{x} {\minus}P_{i}^{y} } \right)} \right]} $$
 $$\,{\equals}\,\mathop{\sum}\limits_{i\,{\equals}\,1}^3 {{{P_{i}^{x} {\plus}P_{i}^{y} } \over 2}{\times}\left( {SRB_{i}^{x} {\minus}SRB_{i}^{y} } \right)} {\plus}\mathop{\sum}\limits_{i\,{\equals}\,1}^3 {{{SRB_{i}^{x} {\plus}SRB_{i}^{y} } \over 2}{\times}\left( {P_{i}^{x} {\minus}P_{i}^{y} } \right)} $$
where:
 $$\mathop{\sum}\limits_{i\,{\equals}\,1}^3 {{{P_{i}^{x} {\plus}P_{i}^{y} } \over 2}{\times}\left( {SRB_{i}^{x} {\minus}SRB_{i}^{y} } \right)} $$
denotes the effect of variations in SRB by birth order on the change in total SRB, and:
 $$\mathop{\sum}\limits_{i\,{\equals}\,1}^3 {{{SRB_{i}^{x} {\plus}SRB_{i}^{y} } \over 2}{\times}\left( {P_{i}^{x} {\minus}P_{i}^{y} } \right)} $$
denotes the effect of compositional changes of female births by birth order. Vaupel (Reference Vaupel1992) and Vaupel and Canudas Romo (Reference Vaupel and Canudas Romo2002) developed direct vs compositional decomposition; in this paper, the ‘direct’ term is not adopted.
Data
The Korean data used in this paper were obtained from vital statistics, and included number of live births by age group of mother, sex and birth order for the period 1981–2014 (Statistics Korea, 2016). The Chinese data included birth data from population censuses, sample censuses and survey data for the period 1980–2010, involving summary data by sex and birth order of the newborn population of all the provinces, municipalities and autonomous regions in mainland China, cities, towns and villages. Tables 1 and 2 present these data.
Table 1 Sex ratio at birth (SRB) and proportion of female births by birth order for 1981–2014 in South Korea
Data source: Statistics Korea (2016).
Table 2 Sex ratio at birth (SRB) and proportion of female births by birth order for 1981–2010 in China
A substantial volume of studies using China’s census and survey data have focused on the evaluation of data quality. Under-reporting, especially under-reporting of female newborns, has been regarded as one possible reason for the rising SRB (Zeng et al., Reference Zeng, Tu, Gu, Xu, Li and Li1993; Goodkind, Reference Goodkind2011). However, in the absence of reliable data to correct for those SRBs, here SRBs are employed from census data or representative surveys without adjustment.
Results
Decomposition results for South Korea and China
As Fig. 1 shows, the SRBs in South Korea and China were almost the same in the early 1980s, began to rise almost simultaneously, and followed a similar pattern until the mid-1990s. The Korean SRB peaked at 116.5 in 1990, and gradually declined to 106 in the mid-2000s, remaining within the accepted normal range thereafter. In contrast, as the South Korean SRB began to decline in the early 1990s, the Chinese SRB continued to rise. During the decade from 2000 to 2010, the Chinese SRB fluctuated around 120, after which it experienced a downward tendency.

Fig. 1 Sex ratio at birth (SRB) trends in South Korea and China. Data sources: Korea, Statistics Korea (2016); China, data from the annual One Per Thousand sample survey, census data and the 2015 One Per Hundred sample survey.
The decomposition calculations were performed for variations in SRB in South Korea and China during the past decades separately, using the above decomposition formula. The results are presented in Table 3 and Table 4, respectively.


The South Korean SRB rose slightly by 2.29 during 1981–1985, as indicated in Table 3. The variations in SRB of all birth orders increased the total SRB by 4.66, with the majority of 4.40 attributable to the rise in SRB in the third and further birth orders. The effect of compositional change in female births actually decreased the total SRB by 2.37, as the proportion of first birth order contributed a rise of 11.93 because of a significant increase in the proportion of first birth order females to the total female birth number, whereas the proportion of third and above birth orders decreased the total SRB by 18.94 due to a marked decrease in the proportion of third and subsequent female births to the total female births as a consequence of fertility decline.
From 1985 to 1990, the South Korean SRB rose dramatically by 7.06. The variations in SRB of all birth orders increased the total SRB by 9.39, with 3.55 attributable to the rise in the second order SRB, and 4.49 to the rise in SRB of third and subsequent birth orders. The effect of compositional change in female births actually decreased the total SRB by 2.33.
From 1990 to 1995 onwards, the South Korean SRB was on the decline. During each period, as can be seen in Table 3, the total effect of variations in SRB by birth orders decreased the total SRB, as SRB of different orders roughly decreased, and the total effect of compositional change in female births exerted relatively little effect on the total SRB.
The Chinese SRB was on the rise during the three decades from 1981 to 2010. From 1981 to 1986, the Chinese SRB rose dramatically by 5.34. The variations in SRB of all birth orders increased the total SRB by 6.32, with the SRB of every birth order contributing to this. The effect of compositional change in female births decreased the total SRB by 0.98, as the proportion of first birth order contributed a rise of 6.82, whereas the proportion of third and subsequent birth orders decreased the total SRB by 12.68. At the start of this period, China first launched the stringent birth control policy in 1980 by an ‘Open Letter’ advocating ‘one-couple-one-child’, which was strictly enforced (White, Reference White2006; Liang, Reference Liang2014; Chen, Reference Chen2015). Due to this control policy, as well as socioeconomic development, births of a higher order were reduced. As can be seen from Table 2, the proportion of third and subsequent female births decreased from 27.45% to 16.70%, and consequently decreased the total SRB greatly by 12.68. As for the rise in SRB of different orders, it can be seen that during this period, the SRB for first birth order rose slightly from 105.33 to 107.66, that for second birth order rose significantly from 107.16 to 117.25 and that for third and further birth order from 112.59 to 123.29. One reason for this increase is prenatal sex determination and sex-selective abortion (Zeng et al., Reference Zeng, Tu, Gu, Xu, Li and Li1993). As the strict birth control policy restricted the number of births a couple could have, they turned to technologies to ensure that they would have at least one son. In 1982, China began to introduce ultrasound B technology on a large scale. Couples with a strong desire for a son would try all means to have a son, even though the government banned prenatal sex determination. Couples would abort a female fetus and have another pregnancy until their desire for a son was fulfilled (Zeng et al., Reference Zeng, Tu, Gu, Xu, Li and Li1993).
From 1993 to 2000, the Chinese SRB rose dramatically by 5.86. The variations in SRB of all birth orders increased the total SRB by 8.86, with the SRB of second births contributing most to this. The effect of compositional change in female births decreased the total SRB by 3.01, as the proportion of first birth order contributed a rise of 8.92, whereas the proportion of third and later birth orders decreased the total SRB by 8.06. During this period, as the strong preference for sons prevailed within the context of strict birth control and easy access to prenatal sex determination and sex-selective abortion, the SRB in all birth orders rose. As for compositional change in female birth orders, as most people only had one child, or two children only if the first child was a girl (Gu et al., Reference Gu, Wang, Guo and Zhang2007), the proportion of first births rose, whereas the proportion of second and subsequent births declined. Besides the policy restriction, socioeconomic development played a decisive role in fertility decline during this period (Cai, Reference Cai2010; Chen et al., Reference Chen, Retherford, Choe, Li and Cui2010). The ideational transition in fertility intention as a result of socioeconomic development is a determining factor in the decline in the proportion of high birth orders. According to surveys on fertility intention and behaviour, most people preferred to have one or two children, even if the birth control policy were discontinued (Jiang et al., Reference Jiang, Li and Sánchez-Barricarte2016b). The decline in the composition of high birth orders drove the total SRB down.
After 2000, the effect of variations in SRB by birth order and the total effect of compositional change in female births was not very significant, and nor was the total SRB. From 2000 to 2005, the SRB for the total population rose by 0.58. The total effect of variations in SRB by birth order was −1.66, indicating that variations in SRB for all birth orders inhibited a further rise in SRB. Compositional changes in female births contributed 2.23 to the changes in the total SRB. From 2005 to 2010, the SRB for the total population rose by 0.72. Specifically, the total effect of variations in SRB by birth order was −0.04, and the overall effect of compositional changes of female births with different birth orders was 0.75. Some studies (Guilmoto, Reference Guilmoto2009; Das Gupta et al., Reference Das Gupta, Chung and Li2009; Goodkind, Reference Goodkind2011) pointed out that Asian countries, including China, are undergoing the SRB transition and have begun to show an incipient decline. During the decade from 2000 to 2010, the total effect of variations in SRB of all birth orders began to decline, even though the decline was not particularly marked. The effect of compositional changes in female births dominated the change in the total SRB, unlike previous periods. It may be anticipated that after the composition of female births stabilizes in subsequent years, the total effect of variations in SRB will accelerate its decline so as to lower the total SRB, following the South Korean pattern.
Decomposition results for urban and rural China
In the 1981 data, there is a classification of urban population and rural population. In the following years, data are classified as city population, township population and village population. In this study the city and township population were combined as the urban population for 1986, so as to make a comparison between 1981 and 1986. After 1986 three categories were adopted: city, township and village population. The decomposition results are presented in Table 5.

From 1981 to 1986, the SRB for urban areas rose by 0.89, whereas that for rural areas rose markedly by 5.99. For the large rise of 5.99 for rural areas, the total effect of variations in SRB raised the SRB by 7.13, with all birth orders contributing positively to this rise, while the effect of compositional changes in female births lowered the SRB by 1.15.
From 1989 to 2000, the SRBs rose greatly for city, township and village people (by 3.63, 5.91 and 7.20 respectively). The total effect of variations in SRB of all birth orders increased the SRB for city, township and village by 8.38, 10.51 and 14.09, respectively; whereas the total effect of compositional changes in female births lowered the SRB by 4.75, 4.59 and 6.90, respectively. During this period, SRBs of all birth orders rose, and the proportion of second and later order births declined as a result of the general fertility decline, with a total fertility rate of 2.31 in 1990 and 1.22 in the 2000 census.
From 2000 to 2005, the total effect of variations in SRB of different birth orders all decreased the SRB for city, township and village populations, whereas the total effect of compositional change in female births all increased the SRB for city, township and village populations. From 2005 to 2010, the SRB for the city population and township population rose considerably, by 3.17 and 2.90 respectively, while the SRB for the village population declined by 0.76. Variations in SRB by birth order showed strong regularity: the SRB of first births for total, city, township and village populations increased, the SRB for the second birth declined, while SRB for the third birth rose.
Decomposition results by province in China
Table 6 presents the decomposition results of variations in SRB in provinces, municipalities and autonomous regions from 2000 to 2005 and from 2005 to 2010. It can be seen that from 2000 to 2005 the SRB declined with each birth order in ten provinces, and rose in five provinces. From 2005 to 2010, the SRB for each birth order declined only in one province, and rose with each birth order in two provinces. For the overwhelming majority of provinces, the SRB for first births and second births had opposite influences on the total SRB. It can be seen that from 2000 to 2005, the effect of variations in SRB by birth order in provinces (except Hebei, Shanghai, Jiangsu, Zhejiang, Anhui and Hunan) on changes in total SRB was greater than that of compositional changes in female births. Comparing 2005–2010 with 2000–2005, it was found that the direction of effect of variations in SRB by birth order and compositional changes of female births had reversed in many provinces.
Table 6 Decomposition of variations in SRB by province in 2000–2005–2010

Figures 2 and 3 show the total effect of the variations in SRB of all birth order and the total effect of compositional changes by female births. Figure 2 provides the 2000–2005 decomposition and Fig. 3 the 2005–2010 decomposition. The SRB in China is significantly spatially auto-correlated based on the 2000 and 2020 census data (Shi & Sun, Reference Shi and Sun2014), and Figs 2 and 3 roughly display a geographical pattern for the total effect of variations in SRB of all birth orders, and the compositional effect. However, Moran’s I for the change in SRB, for the total effect of variations in SRB of all birth orders and for compositional effect by province indicate no spatial autocorrelation.

Fig. 2 Decomposition results for 2000–2005: (a) variations in SRB; (b) compositional change.

Fig. 3 Decomposition results for 2005–2010: (a) variations in SRB; (b) compositional change.
Figure 4 presents a comparison of the change in total SRB, the total effect of the variations in SRB of all birth orders and the total effect of compositional change by female birth orders. It can be seen that for most provinces during the two periods, the total effect of the variations in SRB of all birth orders accounted for the majority of the change in the total SRB by province.

Fig. 4 Decomposition results by province: (a) 2000–2005; (b) 2005–2010.
The factors that contribute to the regional differences in both the total SRB and the decomposition components include localized birth control policy and regional difference in socioeconomic development. Since the early days of China’s birth control policy, its implementation has varied from one location to another. Before the reform of the birth control policy in 2013, urban residents were permitted only one child. For rural residents, six provinces were subject to the one-child policy, including Beijing, Tianjin, Shanghai, Chongqing, Jiangsu and Sichuan; nineteen provinces were subject to the ‘1.5 children’ policy, namely couples were permitted a second child if the first was a daughter; another five provinces permitted rural residents to have two children, including Hainan, Ningxia, Qinghai, Yunnan and Xinjiang (Gu et al., Reference Gu, Wang, Guo and Zhang2007). Interwoven with localized birth control policy are regional differences in socioeconomic development. Economically developed provinces are mainly distributed in the eastern coastal areas, and the provinces (cities) or autonomous regions with a less developed economy are mainly located in the middle and western areas. The economic disparities between the eastern and middle–western areas and those between eastern coastal provinces and inland provinces are the main regional gaps in economic development in China (Xu & Li, Reference Xu and Li2005). Correspondingly, the regional difference in social public services development is interrelated with the regional differences in economic development, and is escalating over time (Li et al., Reference Li, Qin and Li2009). All these factors contribute to the differences in both the total SRB and its decomposition.
Discussions and Conclusions
China’s long-term high SRB has led to many problems, one of the most acute being that of the surplus male. Its effect on demographic, social and economic development has accordingly attracted close attention from academics, government and the common people (Jiang et al., Reference Jiang, Feldman and Li2014). However, there are few studies on changes in the SRB itself. Through decomposition of changes in SRB based on birth order difference, the following conclusions can be drawn.
First, the SRB trend was similar in China and South Korea before the mid-1990s, but then diverged as China’s SRB continued to increase and South Korea’s declined. During the rise and fall of the SRB in South Korea, the total effect of variations in SRB of all birth orders dominated the change in total SRB. For China, before 2000, the total effect of variations in SRB of all birth orders dominated the change in total SRB. However, after 2000, the effect of compositional change dominated the slight rise in total SRB. It can be predicted that the total SRB will decline markedly as the total effect of variations in SRB decrease rapidly, following the South Korean trajectory.
Second, the rural SRB increased much more than the urban SRB from 1980 to 2000, as the total effect of variations in SRB of all birth orders in rural areas was much larger than that in urban areas. After 2000, the total effect of variations in SRB of all birth orders was reversed, and the total SRB in rural areas declined. The effect of compositional change depressed the rise in total SRB before 2000, and then increased the total SRB during the decade from 2000 to 2010 only to a small extent.
Third, in most provinces, the dominant factor for change in total SRB was the variation in SRB of all birth orders, mainly the rise in SRB at the first birth, which promotes a rise in sex ratio at birth in all provinces. In 2005–2010, the absolute value of the influence of variations in SRB by birth order and compositional changes in female births by birth order was generally lower than that in 2000–2005. No spatial autocorrelation has been discerned for the changes in total SRB, or the total effect of decomposed components.
Finally, for the decomposition itself, changes in total SRB were decomposed into the sum of variations in SRB by birth order and compositional changes. Since the SRB is the ratio of male-to-female births, and generally female births are taken as a benchmark, the compositional change in terms of female births by birth order in this decomposition is logical. Also, it would be possible to use the distribution of male births by parity in the decomposition and the results might be somewhat different.
There are several limitations to this paper. First, generally there is misreporting in such data (Goodkind, Reference Goodkind2011). But as no other reliable data source or method were available to adjust systematically the data employed in this paper, the data were incorporated directly from the survey or census without any adjustment. Second, the method is rather traditional and improvements on this may be needed for more elaborate depiction of this important issue in China. Third, China’s 2015 One Percent Population Census has already been performed. However, the data cannot be accessed yet, so the latest changes have not been included in this paper.
For the first decade of the 21st century the SRB fluctuated around 120 in China, but the SRB for first birth increased substantially from 2000 to 2010. Since 2010, according to the official figures, China has experienced an annual consecutive decline in SRB, and some studies are quite optimistic about the declining trend. China’s 2015 One Percent Population Census displayed a SRB of 113.55 – a marked decrease from that in the 2010 census. However, this figure is doubtful, as this decline would appear to be too rapid for so large a population, so the actual change in SRB remains to be seen.
In October 2015, in view of the decline in fertility intention and fertility rate, China relaxed its 35-year stringent birth control policy and replaced it with a universal two-child-per-couple policy. This relaxation is expected in part to alleviate the imbalanced sex structure problem in China’s population. As the current universal two-child-per-couple policy will affect the composition of births, it will be useful to apply the above method to examine the SRB trend and its decomposition component when the data are available.
Acknowledgments
This work was jointly supported by the Key Project of Social Sciences Foundation of China (Grant No. 15ZDB136) and the Spanish Ministry of Economy and Competitiveness (CSO2012-31206).


 Open access