


Introduction
The major impact for rubella is among pregnant women. Whilst rubella virus infection causes a mild febrile and rash disease in children and adults, infection during pregnancy can result in miscarriage, foetal death, stillbirth or birth defects [1].
Zambia has no deliberate policy on rubella surveillance, however cases of rubella are identified through routine disease surveillance systems and integrated measles/rubella case-based surveillance [Reference Reef2]. The estimated rubella disease burden relies on the measles surveillance programme where samples testing negative to measles immunoglobulin M (IgM) are tested for rubella IgM. A negative measles IgM sample indicates that the patient suspected of having measles has not been exposed to the measles. Considering rubella has similar symptoms, though mostly more mild, the samples are then tested for rubella IgM. A positive IgM is indicative of an active infection.
Blood or throat swab samples are collected from persons suspected of having a measles infection. A suspected measles case is defined as persons displaying fever and generalised maculopapular (non-vesicular) rash, or a patient whom a health care worker suspects has measles.
Rubella-containing vaccines have been introduced in many countries to prevent these adverse pregnancy outcomes [Reference Grant3] and congenital rubella syndrome (CRS). Rubella vaccine was introduced in Zambia as a measles-rubella vaccine into the national immunisation schedules in September 2016. Two doses of measles-rubella vaccine are given at a minimum interval of 9 months starting at the age of 9 months [4].
Rubella surveillance is necessary to monitor disease burden after introduction of rubella-containing vaccine [Reference Grant3]. Disease surveillance data may be biased partly due to non-specific diagnosis, targeted to young children and to underreporting; for example, in 2016, WHO estimated 7 million rubella cases globally [Reference Dabbagh5], but only 132 137 were reported to the WHO [6]. For rubella, reporting is even less sensitive because 20–50% of rubella cases are asymptomatic [1]. The number of cases reported will depend on the quality of the system in identifying cases of rubella. However, well-conducted seroprevalence studies can help to improve the reliability of rubella incidence rates [Reference Vynnycky7].
The average incidence rates between 1977 and 1985 for rubella infection in the age group 15–44 were 399, 427, 373, 206 and 465 per 100 000 pregnancies for Cote d'Ivoire in Abidjan [Reference Vrinat8], Nigeria and western Nigeria [Reference Odelola, Fabiyi and Familusi9, Reference Odelola10] and Zambia, Lusaka [Reference Watts11], respectively. In 2009, 17388 cases of rubella with an incidence of 2.11 per 100 000 populations were reported in Africa [4].
An infection will persist in a community if the average number of secondary cases caused by an infected individual is equal to or greater than 1. If it is less than 1, then the generation of secondary cases is not adequate to maintain the infection in a community. Papadopoulos and Vynnycky [Reference Papadopoulos and Vynnycky12] estimated the basic reproduction number (Ro) for rubella for 98 settings from around the world and found that Ro was <5, 5–10 and >10 for 81, 14 and 3 settings respectively. In Africa, Ro was in the range 1.5–2.0 between 1979 and 2009. Particularly, in Zambia, the estimate was for the period 1979 and 1980.
Updated reliable estimates based on modelling studies are important in tracking the rubella epidemic in designing interventions to control and eliminate it. Hence, the objective of the study was to determine the incidence of rubella infection and its rate of reproduction in Zambia in a modelling study during the pre-vaccination period 2005–2016.
Methods
Model formulation and analysis for rubella infection in Zambia
This study used a deterministic compartmental model to describe the transmission dynamics of rubella infection in Zambia. Compartmental models are widely used to study the dynamics of viral infections among other infections that are transmitted in populations [Reference Anderson and May13]. The total population (N) is divided into the following epidemiological classes: susceptible, S (individuals who are not yet infected but may be infected with rubella over time). Some of these susceptible populations may be vaccinated or will be exposed when they come into contact with either an infectious pregnant woman or an infectious individual in the general population. The exposed (E) or latent class are individuals (pregnant women or the general population) who have been infected with rubella but are not infectious to others. Within days, this group of exposed individuals becomes infectious and move to the infectious (I) class. The infectious sub-classes are pregnant women and the general population that can transmit rubella infection to others in the susceptible class due to the high accumulation of viral load. Both the exposed and the infectious classes may recover from rubella infection at different rates and will be classified under the recovery sub-class. Infectious pregnant women can either host an infected foetus or an uninfected foetus due to the possibility of vertical transmission and the infected foetus may be either aborted or they will be born with CRS. This study emphasised that children may recover from the viral infection and join the recovery class.
The model adjusts for seasonality by [Reference Anderson and May13] including seasonality-dependent force of infection λ(t) = β 0 + β 1sin(2πt/12) + β 2cos (2πt/12) where t is time in months. The study distinguished between different levels of vaccination by assuming that individuals who are vaccinated only receive one dose and modelled the possibility of receiving full doses of vaccination. The transmission rate was estimated from the observed number of cases using the non-linear least square estimation via Levenberg–Marquardt algorithm that minimises the sum of squared error between the observed cumulative number of rubella cases and predicted cumulative cases. Other parameters were carefully chosen to fit our definition to fit the model. The time step for the model is monthly and we modelled counterfactual scenario of no vaccination post 2016. The systems of differential equations were analysed using the ‘desolve’ package in R [Reference Soetaert, Petzoldt and Setzer14]. Using the approach of Cori et al. [Reference Cori15], we estimated the time-dependent effective reproduction number Rt using monthly incidence time series rubella data between 2005 and 2016. The Cori et al. approach assumes that once infected, individuals have an infectivity profile given by a probability distribution W s, and is dependent on time since infection of the case, s, but independent of calendar time, t. The authors estimated the instantaneous reproductive number as the ratio of the number of new infections generated at time step t, I t, to the total infectiousness of infected individuals at time t, given by  $\sum\nolimits_{s = 1}^t {I_{t-s}W_s} $, the sum of infection incidence up to time step t − 1, weighted by the infectivity function W s. R t is the average number of secondary cases that each infected individual would infect if the conditions remained as they were at time t. The incidence at time t is Poisson distributed with mean $R_t\sum\nolimits_{s = 1}^t {I_{t-s}w_s} $.
A description of variables and parameters is given in Table 1 below.
Table 1. Description of variables and parameters

Figure 1 is a compartmental model showing the conceptualised dynamics of rubella between 2005 and 2016 in Zambia

Fig. 1. A compartmental model showing the dynamics of rubella infection in Zambia.
Systems of differential equations
 $$\displaystyle{{dS_G} \over {dt}} = {-}\displaystyle{{\lambda _{IG}S_GI_PI_G} \over N}-\mu S_G-\varepsilon S_G$$
 $$\displaystyle{{dS_P} \over {dt}} = {-}\displaystyle{{\lambda _{IG}S_PI_PI_G} \over N}-\mu S_P-\varepsilon S_P$$
 $$\displaystyle{{dE_P} \over {dt}} = \displaystyle{{\lambda _{IG}S_PI_PI_G} \over N}-\mu E_P-\sigma _PE_P-\eta _PE_P$$
 $$\displaystyle{{dE_G} \over {dt}} = \displaystyle{{\lambda _{IG}S_GI_PI_G} \over N}-\mu E_G-\sigma _GE_G-\eta _GE_G$$
 $$\displaystyle{{dI_G} \over {dt}} = \sigma _GE_G-\eta _GI_G-\mu _RI_G-\;\mu I_G$$
 $$\displaystyle{{dI_P} \over {dt}} = \sigma _PE_P-\eta _PI_P-\mu _RI_P-\;\mu I_P$$
 $$\displaystyle{{dV_1} \over {dt}} = \varepsilon S_T-\mu V_1-\theta V_1-kV_1$$
 $$\displaystyle{{dV_2} \over {dt}} = \theta V_1-\mu V_2-kV_2$$
 $$\displaystyle{{dQ} \over {dt}} = \displaystyle{{\lambda _{IG}S_PI_PI_G} \over N} + \displaystyle{{\lambda _{IG}S_GI_PI_G} \over N}$$
 $$\displaystyle{{dR} \over {dt}} = \eta _PE_P + \eta _GE_G + \eta _GI_G + \eta _PI_P + kV_1 + kV_2-\;\mu R$$
 $$\displaystyle{{dS_T} \over {dt}} = \displaystyle{{dS_G} \over {dt}} + \displaystyle{{dS_P} \over {dt}}-\varepsilon S_T + \rho V_1 + \pi N$$
 $$S_T( t ) = S_G( t ) + S_P( t ) $$
The total population size N(t) is assumed to be constant and homogenous:
 $$N( t ) = S_G( t ) + S_P( t ) + E_G( t ) + E_P( t ) + I_G( t ) + I_P( t ) + V_1( t ) + V_2( t ) + R( t ) $$
We did not provide detailed analytic expression of rubella infection since the focus of the study was to track the incidence of rubella.
Ethical consideration
The data used in this study are de-identified secondary data from the Government-run measles surveillance programme. Ethical clearance was sought from the Ministry of Health, ERES Coverage IRB (00005948) and the National Health Research Authority.
Results
Distribution of rubella infection in Zambia
During the 2005–2016 rubella pre-vaccination period, a total of 1313 cases of rubella were confirmed and notified on the basis of IgM sero-positivity in sera of 4497 suspected cases of measles found seronegative for IgM antibodies to measles. The annual cumulative cases of infection ranged from 190 cases in 2005 to 29 cases 2016 albeit high variation of annual reported cases within the period (Table 2). Also important to note is that 2016 was up to the month of September.
Table 2. Distribution of new rubella cases per year

Avg, average.
The highest annual number of 255 was recorded in 2008. The median rubella cases was 5.25 (interquartile range, IQR = 3.13–9.75). However, 2014 recorded the highest median positivity rate of 9.02%.
Seasonality analysis
Figure 2 shows the detailed monthly distribution of cases, cumulative cases and test positivity rate of rubella infection. There was a seasonal pattern in the occurrence of laboratory-confirmed rubella, with peaks in September observed. Although there were significant variations in the monthly test positivity rates in the pre-vaccination period of 2005–2016, higher test positivity rates of rubella infection were usually recorded in the months of September, October and November of each year. The monthly distribution of incidence cases and test positivity rate showed that the highest number of cases and test positivity rate were recorded in the month of September 2008 (51 cases) and October 2011 (48.39%), respectively. Figure 2 details the seasonality pattern of laboratory-confirmed rubella where panel (a) is the monthly incidence of rubella infection in Zambia between 2005 and 2016; panel (b) the cumulative distribution of rubella cases in Zambia between 2005 and 2016; panel (c) the test positivity rate of rubella infection in Zambia between 2005 and 2016; and panel (d) the monthly distribution of rubella cases (red) and rate of rubella infection between 2005 and 2016.
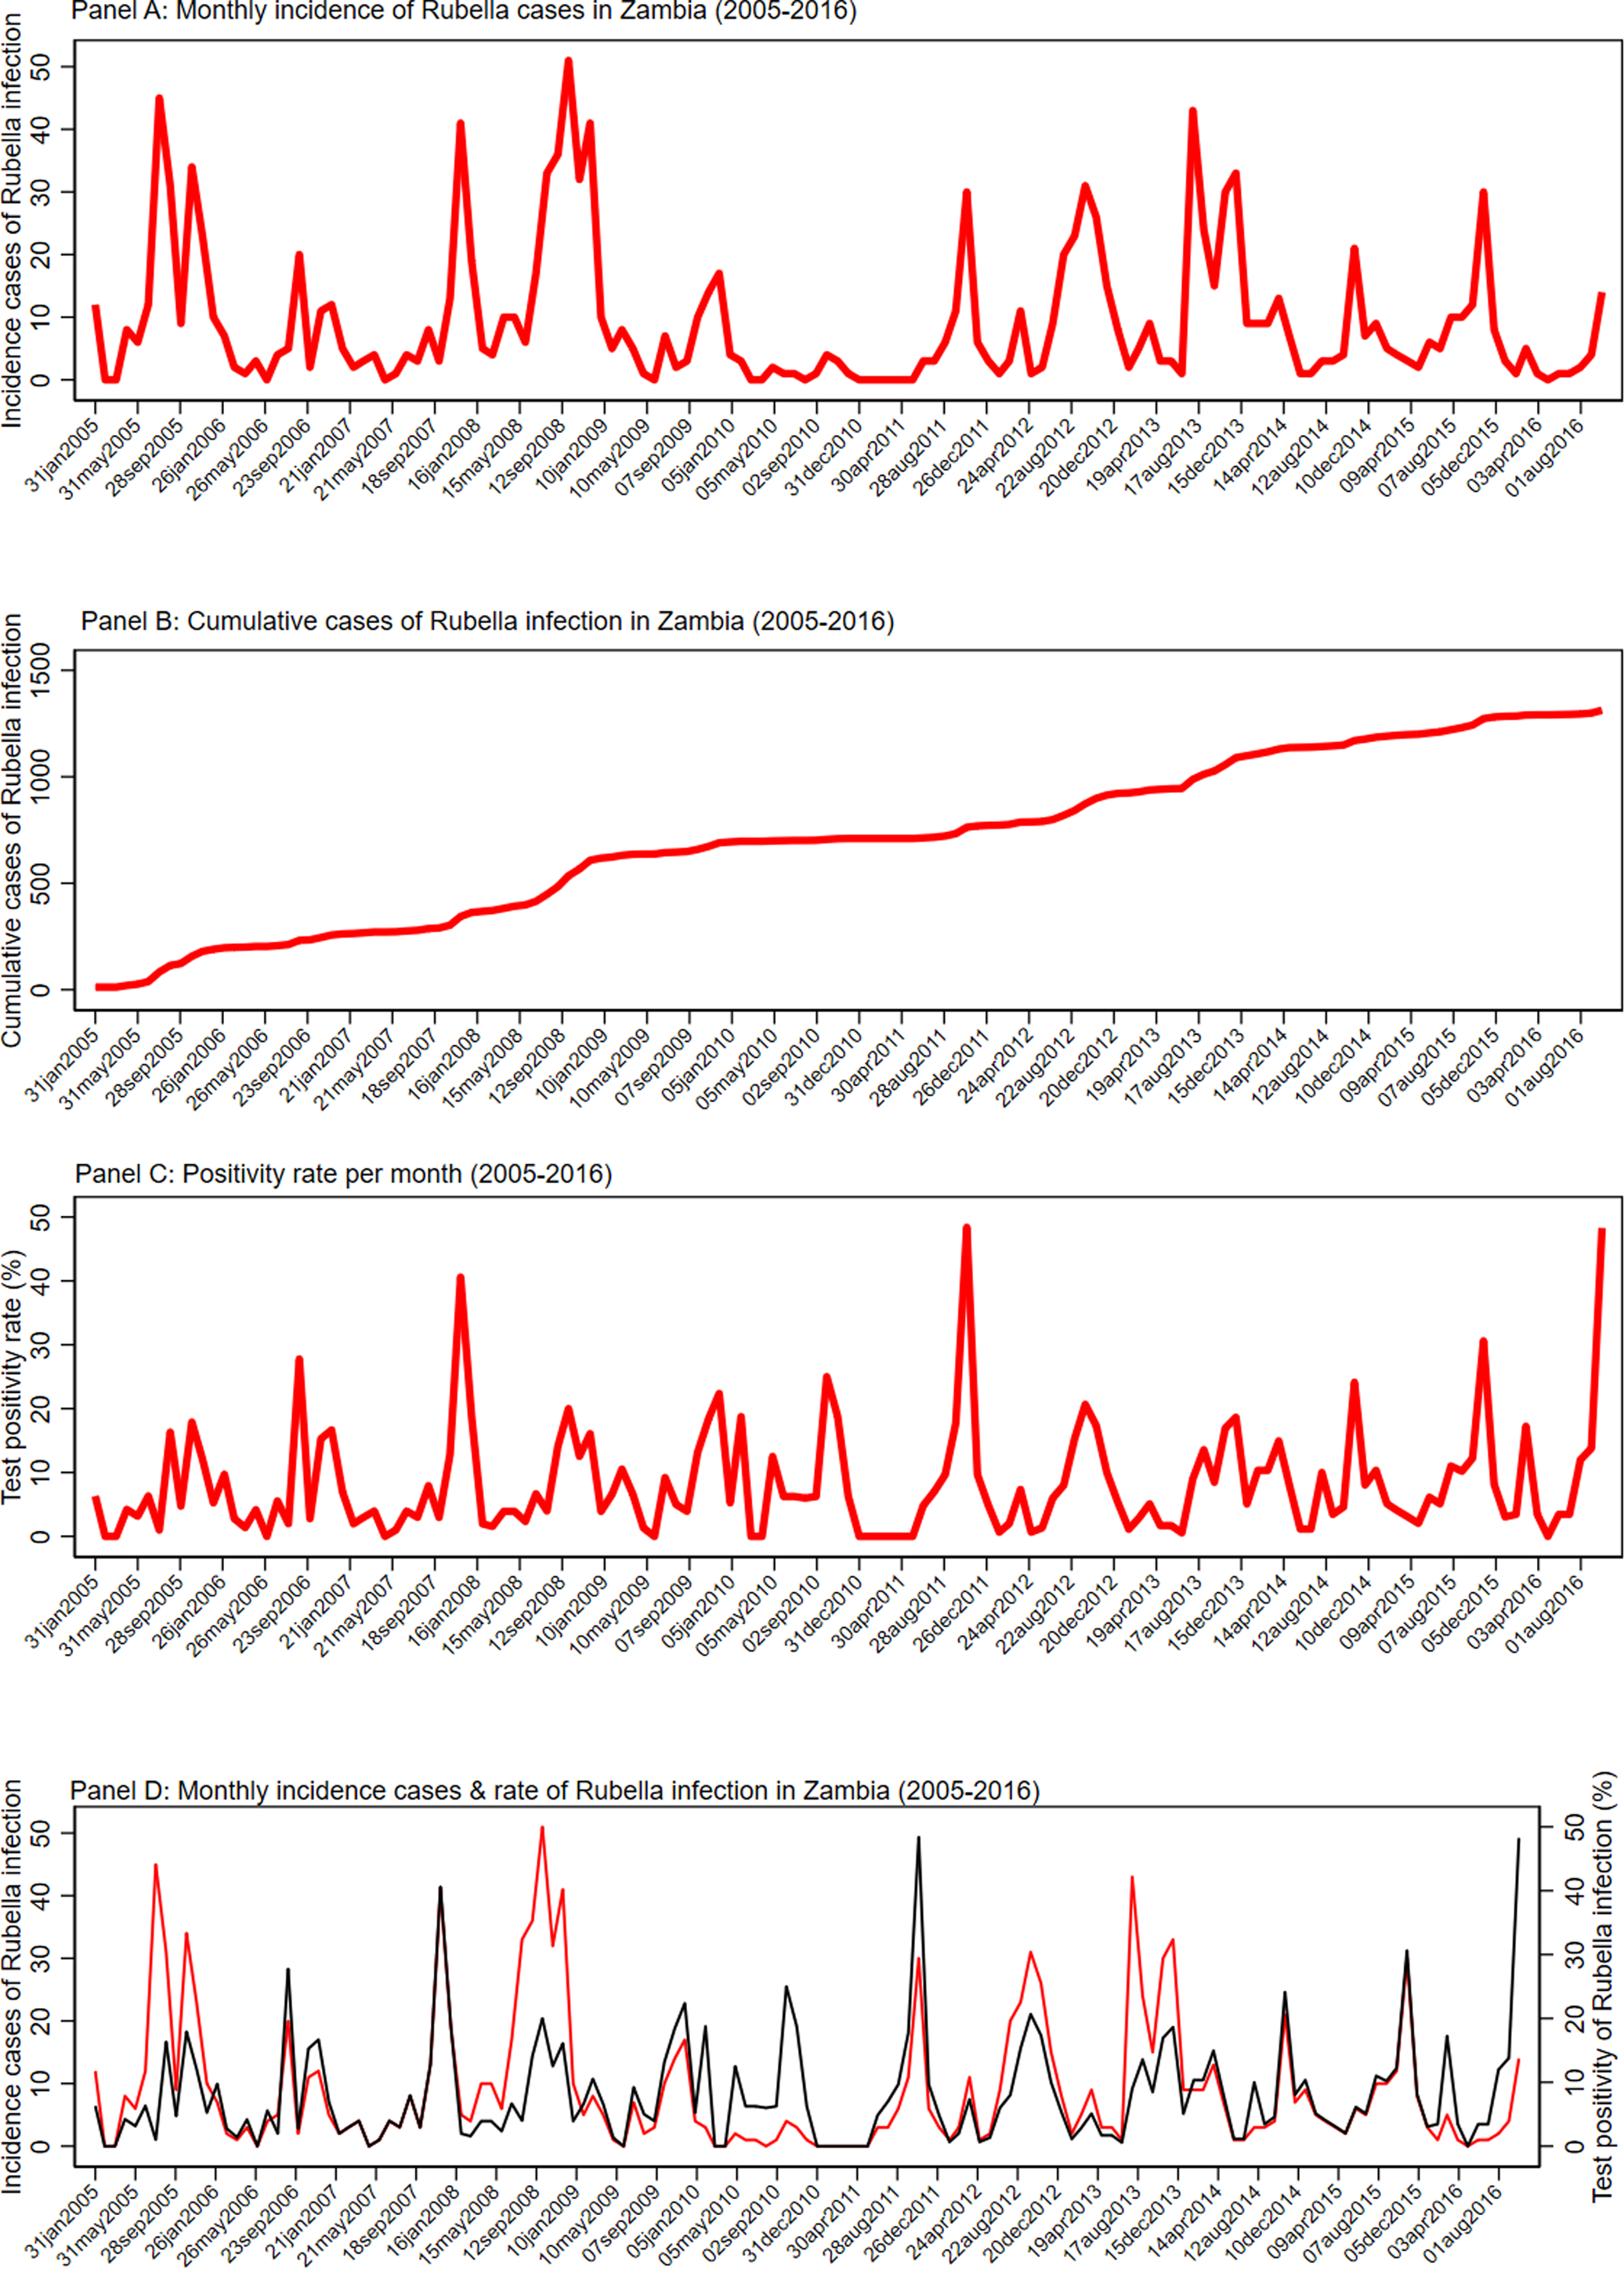
Fig. 2. Seasonality pattern of laboratory confirmed rubella. (a) Monthly incidence of rubella infection in Zambia between 2005 and 2016. (b) Cumulative distribution of rubella cases in Zambia between 2005 and 2016. (c) The test positivity rate of rubella infection in Zambia between 2005 and 2016. (d) Monthly distribution of rubella cases (red) and rate of rubella infection between 2005 and 2016.
Forecasting incidence of rubella
Figure 3 shows the dynamics of modelled expected incidence of rubella cases among the general population and pregnant women in Zambia. The vertical dark-short dashed line in Figure 3 represents the years before and after vaccine introduction. The modelled monthly median incidence of rubella infection among the general population before vaccination (2005–2016) in Zambia was 76 (IQR = 58–93) and 20 (IQR = 16–25) among pregnant women. The incidence of rubella among the other population (non-pregnant) category was 44 (IQR = 32–53). In the counterfactual scenario, that is assuming no vaccination after 2016, the total expected number of rubella infection among the general population was 89 and 24 among pregnant women. The number of rubella cases among the other population (non-pregnant) category post-vaccination was 53 (IQR = 37–67). The median rate of increase was 0.72 cases per month (95% CI 0.24–1.21, P < 0.001).

Fig. 3. Modelled incidence of rubella cases among the general population and pregnant women in Zambia. Note: The vertical dark-short dashed line represents the years before and after vaccine introduction
Analysis of the effective reproductive number
We explored the trend of effective reproduction number Rt prior to vaccination (2005 and 2016). The intensity of transmissibility and the effectiveness of interventions can be measured by the time-dependent reproduction number Rt, which is the average number of secondary cases caused by an infected individual.
Rt initially decreased from an initial median value of 2.6 (95% credible interval (CI) 2.1–3.1) from January 2005 to 0.5 (95% CI 0.4–0.7) in December 2005, and then increased to 1.4 (95% CI 1.1–1.9) in February 2006. The Rt fluctuated above and below the threshold of 1 over the period (2007–2016) but increased to 4.0 (95% CI 2.6–5.8) in June 2016. The annual mean estimates of Rt showed that the lowest Rt of 1.0 was recorded in 2014 (95% CI 0.8–1.1) and the epidemic recorded its peak in 2016 (Rt = 2.2; 95% CI 1.0–3.4). Figure 4 shows the trend analysis of the effective time-dependent reproduction number between 2005 and 2016. In this period there are 12 rubella epidemics.

Fig. 4. Trend analysis of time-dependent reproduction number (Rt).
Discussion
This is the first study to have modelled the incidence of rubella in Zambia. A total of 1313 cases of rubella were confirmed and notified between 2005 and 2016 with the highest number reported in 2008 (255). The highest median positivity rate in Zambia of 9.02% was recorded in 2014. In the same year 2014, many countries were experiencing increased transmission of rubella with 33 068 active rubella cases reported among 161 countries. Of these 44 were African countries [Reference Grant16].
The modelled monthly median incidence in the general population of 76 was greater than that of pregnant women (20) and non-pregnant women (44). These findings indicate that interventions targeted at the general population would produce the biggest impact on rubella control. The modelled monthly median incidence rate greater than observed value, suggesting underestimates in burden of rubella in general population, partly because the measles surveillance largely covers children under 15 years of age presenting with fever and rash typical of measles infection.
A seasonal pattern of rubella was observed and peaked in September (51 cases). Significant variations in the monthly test positivity rates were detected with higher rates observed in the months of September, October and November with the highest in October (48.4%). Similar variations with a peak in October were observed by Mazaba et al., although the peak period in their publication started in July through to November. [Reference Mazaba17]. A study looking at the epidemiology of rubella in Cameroon between 2008 and 2014 confirms a seasonality pattern with the peaks in February to April was highest, which represents the end of the dry season and beginning of the raining season in most parts of Cameroon. Meanwhile, Kenya in 2014 reports peaks in May, July and October, months characterised with rainy season and cold weather while Zimbabwe in a study between 2007 and 2011 reports peaks in October and November when it is generally dry, a pattern similar to Zambia [Reference Mengouo18–Reference Chimhuya20]. Rubella usually occurs in a seasonal pattern with highly variable extent and periodicity of the epidemic [1]. In the current study, a similar finding was observed with the epidemic peaking in late September and highest monthly test positivity rate occurring a month later in October. The implication of this finding is that mass vaccination campaigns should be conducted during the period when the incidence rate is at its low levels between January and June.
The annual mean estimates of Rt were between 0.5 and 2 for most of the times except in January 2005 and 2007 and April 2011 and 2016 when Rt was greater than 2. This finding is comparable to findings by Papadopoulos and Vynnycky [Reference Papadopoulos and Vynnycky12] who estimated the basic reproduction number (Ro) for rubella for 98 settings from around the world and found Ro was <5 for 81 out of 91 settings. In Africa, Ro was in the range 1.5–2.0 between 1979 and 2009. Particularly, in Zambia, the estimate was for the period 1979 and 1980. The finding from the current study suggests that there were 12 rubella epidemics in Zambia between 2005 and 2016. It is expected that the number of epidemics will decrease after the introduction of the vaccine.
Due to paucity in the data, some parameters used in the modelling were obtained from literature which may not be an accurate representation of the rubella epidemiology in Zambia.
In conclusion, the measles-based surveillance system underestimates the observed burden of rubella. The seasonal pattern observed and modelled are consistent. A greater impact of mass vaccination campaign on burden of rubella can occur when conducted among the general population between January and July when cases of rubella are at low levels. It would be of much relevance to re-model the incidence of rubella to date, 6 years after the introduction of routine measles-rubella vaccination in Zambia.
Acknowledgements
The authors acknowledge the Virology Laboratory and Ministry of Health in Zambia in its entirety for data availability, laboratorians, data collectors, advisors and supervisors.
Author contributions
All authors made substantial contributions and accepted to submit to the epidemiology and infection journal; gave final approval of the version to be published; and agree to be accountable for all aspects of the work. Specifically, the contributions by the authors were as follows: MLM contributed to conception and design, acquisition of data, analysis and interpretation of data; took part in drafting the article and revising it critically for important intellectual content; SB contributed to the methodology, interpretation of data; and took part in revising the article critically for important intellectual content; DC contributed to the conception and design, supervision, interpretation of data; and took part in revising the article critically for important intellectual content; MM contributed to conception and design, supervision and took part in revising the article critically for important intellectual content; SS contributed to conception and design, supervision, analysis and interpretation of data; took part in drafting the article and revising it critically for important intellectual content.
Financial support
No funding was received for the conduction of the study or manuscript preparation.
Conflict of interest
None.
Data availability statement
The dataset on which this paper is based is too large to be retained or publicly archived with available resources. Documentation and methods used to support this study are available from the corresponding author.


 Open access