


Delirium has been a social burden among elderly in-patients owing to the significantly poor outcomes related to it. Delirium is very common in older adult in-patients, especially those with dementia. It occurs in up to 50% of patients admitted to general internal medicine wards, 15–53% who are undergoing post-operative recovery and 70–87% who are in intensive care units (ICUs).Reference Inouye1,Reference Pisani, McNicoll and Inouye2 Delirium is a strong predictor of poor patient outcomes such as increased mortality rates, length of stay (LOS) in hospital and institutionalisation after discharge.Reference Inouye, Westendorp and Saczynski3 However, delirium is less likely to be treated because it is difficult to diagnose.Reference Ely, Stephens, Jackson, Thomason, Truman and Gordon4 Early identification of delirium can prompt medical workups and lead to capturing underlying medical problems, but proper detection of delirium has been a challenge. Although many useful tools for screening and detecting delirium using various questionnaire-style instruments have been developed,Reference De and Wand5 their subjective nature makes it difficult to precisely identify changes in mental status, especially when administered by different healthcare professionals. These questionnaires are also extensive, making it difficult for busy hospital staff to administer them several times each day. Owing to these challenges, it has been shown that tools of this type have suboptimal sensitivity (38–47%) when used in busy clinical settings such as the ICU.Reference van Eijk, van den Boogaard, van Marum, Benner, Eikelenboom and Honing6,Reference Nishimura, Yokoyama, Yamauchi, Koizumi, Harasawa and Yasuda7 Without effective and efficient tools for early detection, delirium remains seriously underdiagnosed and undertreated.Reference Inouye1,Reference Inouye, Westendorp and Saczynski3,Reference Fong, Tulebaev and Inouye8 Therefore, there is a need for a more objective and efficient device for delirium detection.
Delirium is characterised by low-frequency brain wave signals, and electroencephalography (EEG) can be used to detect such signals.Reference Engel, Romano and Goldman9–Reference Palanca, Wildes, Ju, Ching and Avidan11 We have developed a novel bispectral EEG (BSEEG) system that utilises only two EEG channels and can be easily applied by non-experts. Our novel EEG algorithm was found to detect delirium and reported promising data in general medicine settings, the emergency room, in electroconvulsive therapy patients and in lipopolysaccharide-induced delirium in rodents.Reference Shinozaki, Chan, Sparr, Zarei, Gaul and Heinzman12–Reference Yamanashi, Malicoat, Steffen, Zarei, Li and Purnell16 Although our previously published data using the original BSEEG device has shown its effectiveness in detecting delirium, our previous data did not report the level of correlation between delirium severity and the BSEEG score. Also, the device used had some limitations. For example, it did not have the ability to show a calculated BSEEG score at the bedside. Thus, the EEG recording had to be analysed at a later time in order to obtain a BSEEG score. In busy clinical settings, these additional steps would be unrealistic to implement as a routine procedure. For this reason, we have introduced a new device with the ability to send a wireless signal so that the BSEEG score can be calculated and displayed at the bedside, enabling its use as a point-of-care device.
Aims
Our aim in this study was to determine whether the BSEEG score can show delirium severity in a dose-dependent manner. We also aimed to demonstrate that our new device could and would replicate our previous findings in the detection of delirium, as well as predicting outcomes, including mortality and hospital LOS, as our original device did.Reference Shinozaki, Chan, Sparr, Zarei, Gaul and Heinzman12–Reference Saito, Malicoat, Leyden, Williams, Jellison and Long14 In addition, we have continued to pursue our interest in ways to improve the performance of the BSEEG method in the detection of delirium and the prediction of outcomes. The noise in EEG signals has presented challenges, so an additional aim was to investigate the effect of additional filtering by excluding EEG data with higher noise.
Method
Study design
This is a prospective cohort study to test the effectiveness of BSEEG in detecting delirium and predicting patient mortality using a new, small (thumb-sized) EEG device. The human participant protocol for this research study was approved by the University of Iowa Institutional Review Board. This study conforms to the provisions of the Declaration of Helsinki.
Setting and participants
We recruited participants between 55 and 99 years old at the University of Iowa Hospitals and Clinics (UIHC) between January and November 2019.
All participants were enrolled after admission to the UIHC or an emergency room visit. Because the study included patients with delirium, not all participants had the capacity to consent. We determined whether patients were able to consent to participate at the time of enrolment. Participants with the capacity to consent did so themselves; when participants were not able to consent, their legally authorised representative provided signed approval on their behalf.
The recruitment process and overall protocol for this study followed the same structure as our previous studies.Reference Shinozaki, Bormann, Chan, Zarei, Sparr and Klisares13,Reference Saito, Malicoat, Leyden, Williams, Jellison and Long14 Further details are described in the supplementary material available at https://doi.org/10.1192/bjp.2021.101.
Clinical data collection and case definition
Clinical data, including the Confusion Assessment Method for the Intensive Care Unit (CAM-ICU),Reference Ely, Inouye, Bernard, Gordon, Francis and May17 the Delirium Rating Scale-Revised-98 (DRS)Reference Trzepacz, Mittal, Torres, Kanary, Norton and Jimerson18 and the Delirium Observation Screening Score (DOSS),Reference Schuurmans, Shortridge-Baggett and Duursma19 were collected as described in previous papers.Reference Shinozaki, Chan, Sparr, Zarei, Gaul and Heinzman12–Reference Saito, Malicoat, Leyden, Williams, Jellison and Long14 We defined delirium status by a CAM-ICU-positive score, DRS score ≥18, DOSS score ≥3, or clinical documentation of delirium. Additional details are described in the supplementary material.
BSEEG data collection and score calculation
We used a portable, thumb-sized EEG device (ZA, ProAssist, Osaka, Japan) (supplementary Fig. 1(a)) to collect brain signals. EEG recordings were conducted at the same time as the clinical scale assessment. Signals were obtained from the two-lead montage Fp1–A1 for 3 min (supplementary Fig. 1(b)). A study team member interacted with the participants during the assessments to make sure that patients were not asleep during recording. The EEG sampling rate was 128 Hz. Raw EEG signals were processed and BSEEG score was calculated as a power ratio of low frequency (3 Hz) to high frequency (10 Hz) as described previously.Reference Shinozaki, Chan, Sparr, Zarei, Gaul and Heinzman12–Reference Saito, Malicoat, Leyden, Williams, Jellison and Long14,Reference Zarei, Sparr, Trapp, Neuhaus, Cromwell and Boes20 Further details are described in the supplementary material.
Standard deviation filtering and first BSEEG extraction
Because a BSEEG score with high s.d. suggests excess noise during the EEG recording, we employed additional filtering for EEG data by limiting signals to those with low s.d. values (s.d. filtering). The cut-off s.d. value was 0.18/0.19. We also extracted BSEEG scores from the first assessment day (first BSEEG) for survival analysis. We divided the study participants into two groups: (a) a BSEEG-positive group (BSEEG score ≥1.40, reflecting slower EEG activity on relative spectral density) and (b) a BSEEG-negative group (BSEEG score ≤1.39, reflecting faster EEG activity on relative spectral density)Reference Shinozaki, Bormann, Chan, Zarei, Sparr and Klisares13 (supplementary Table).
Assessment of mortality and LOS in hospital
All-cause mortality data were obtained from each patient's hospital records and obituary records as previously reported.Reference Shinozaki, Bormann, Chan, Zarei, Sparr and Klisares13,Reference Saito, Malicoat, Leyden, Williams, Jellison and Long14,Reference Yamanashi, Iwata, Crutchley, Sullivan, Malicoat and Anderson21 Hospital LOS data were collected by reviewing hospital records.
Statistical analysis
To compare the relationships between BSEEG and each delirium screening scale, all obtained BSEEG data were analysed. The BSEEG scores of the CAM-ICU-positive group and CAM-ICU-negative group were compared using Mann–Whitney U-tests. The receiver operating characteristic (ROC) curve and the area under the curve (AUC) were also used to analyse the relationship between BSEEG score and CAM-ICU results. The most optimised sensitivity and specificity were calculated. To compare the correlation between the BSEEG score and the DRS score, as well as the BSEEG and the DOSS scores, we performed Spearman's rank correlation. We also divided data into three groups based on the mortality risks associated with DRS and DOSS scores identified in our previous study: DRS = 0–3, 4–9 and ≥10; and DOSS = 0, 1–2 and ≥3.Reference Yamanashi, Iwata, Crutchley, Sullivan, Malicoat and Anderson21 The BSEEG scores of the three groups were compared using the Kruskal–Wallis test and Mann–Whitney U-test with Holm correction. The data are presented with scatter plots, medians and interquartile ranges. For outcome analysis, we used only the first BSEEG scores. This was to avoid potential bias from those who stayed longer in hospital and had more EEG recordings, and thus had more random chance to show higher BSEEG scores. Kaplan–Meier survival curves were used for visual presentation of time to death, and log-rank statistics were used to assess significance of difference in 365-day mortality. The hazard ratio (HR) for mortality was computed using Cox proportional hazards regression analyses. Age, gender, delirium status and severity of illness as quantified with the Charlson Comorbidity Index (CCI)Reference Charlson, Szatrowski, Peterson and Gold22 were added as covariates in the regression analyses. The association between mortality and BSEEG scores was illustrated by comparing two survival functions for BSEEG-positive and BSEEG-negative groups, as well as three survival functions for high-BSEEG, medium-BSEEG, and low-BSEEG groups. Finally, we conducted a subgroup analysis combining clinical delirium and BSEEG categories to show their mortality. Mann–Whitney U-tests were also used for the comparison of LOS between the BSEEG-positive group and the BSEEG-negative group. Corrected P-values <0.05 were considered significant. All analyses were performed with R software, version 4.0.2 for Windows.
Results
Participant demographics
We enrolled 279 participants. The average patient age was 71.2 years (s.d. = 9.0), 47.3% of the participants were female and 93.2% were non-Hispanic White. Among the 279 participants, 93 (33.3%) were identified as delirious and 186 (66.7%) were judged not to have delirium (supplementary Table). In total, 620 EEG recordings were available for analysis. On average, each participant had 2.2 recordings.
Correlation between BSEEG score and delirium screening scales
BSEEG and CAM-ICU
The BSEEG and CAM-ICU were measured 612 consecutive times. When the BSEEG scores were compared between CAM-ICU-negative groups and CAM-ICU-positive groups, the median BSEEG scores were 1.39 and 1.51 respectively (P < 0.001) (Fig. 1(a)). The AUC from the ROC curve was 0.71 (95% CI 0.66–0.76). The optimised sensitivity and specificity were 0.69 and 0.67 respectively (supplementary Fig. 2(a)). After s.d. filtering, similar results were observed (median BSEEG score of 1.39 (CAM-ICU-negative) and 1.51 (CAM-ICU-positive), P < 0.001) (Fig. 1(b)). The AUC from the ROC curve was 0.72 (95% CI 0.65–0.79). The optimised sensitivity and specificity were 0.70 and 0.67 respectively (supplementary Fig. 2(b)).
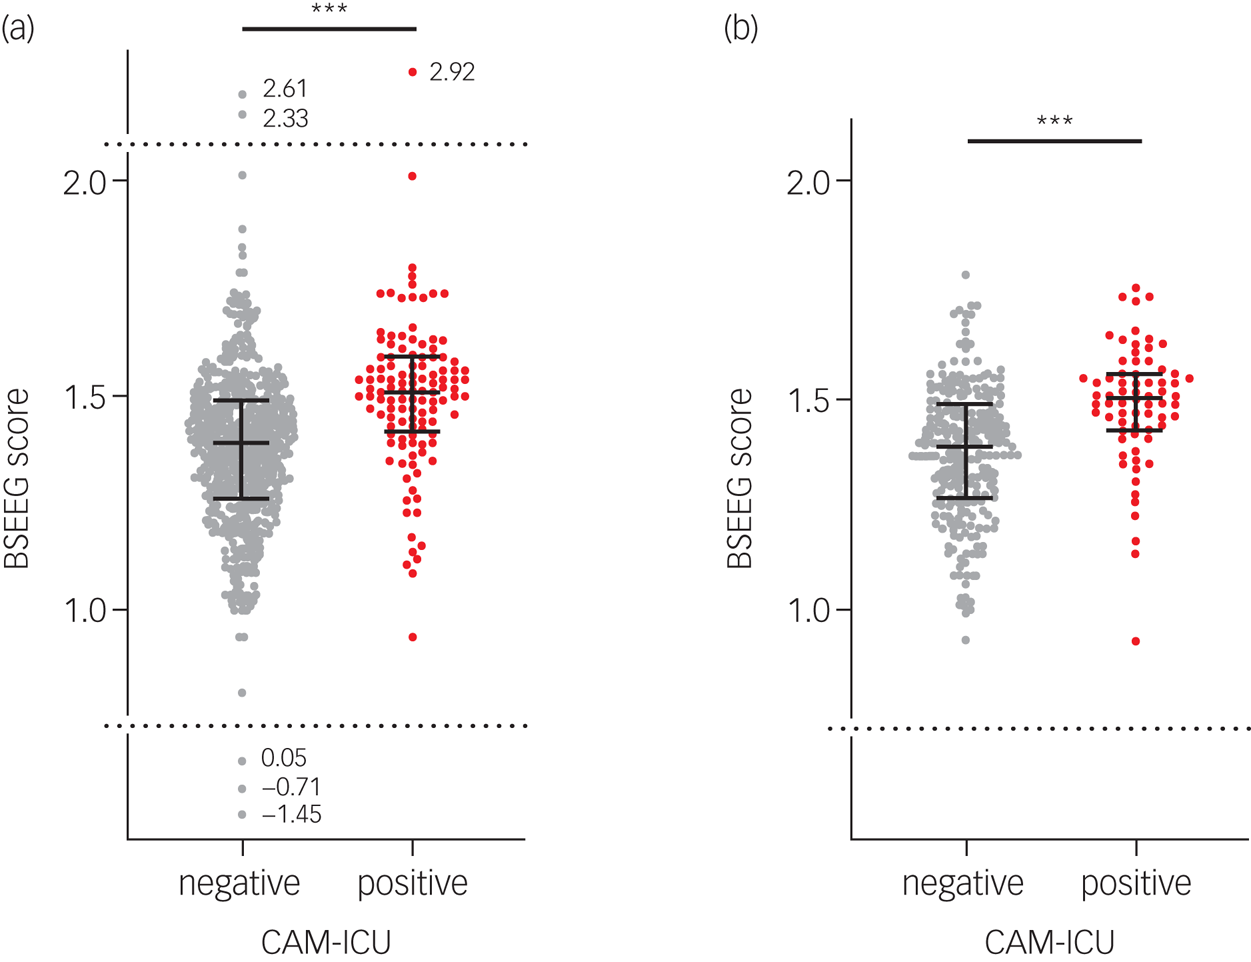
Fig. 1 Comparison of bispectral electroencephalography (BSEEG) scores between CAM-ICU-negative groups and CAM-ICU-positive groups (a) for all data and (b) after s.d. filtering. CAM-ICU, Confusion Assessment Method for the Intensive Care Unit.
BSEEG and DRS
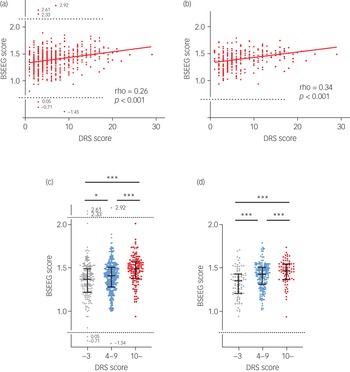
There were 607 times when the BSEEG and DRS were measured consecutively. We tested the BSEEG and DRS scores for correlation and the Spearman's rank correlation coefficient was 0.26 (P < 0.001) (Fig. 2(a)). When the BSEEG scores after s.d. filtering were analysed, the correlation coefficient increased to 0.34 (P < 0.001) (Fig. 2(b)). When we compared the BSEEG scores for the three groups divided on the basis of DRS scores of 0–3, 4–9 and ≥10,Reference Yamanashi, Iwata, Crutchley, Sullivan, Malicoat and Anderson21 there were significant differences in the scores among the three groups (P < 0.001). The BSEEG score increased along with the DRS score (Fig. 2(c)). These differences were observed more clearly when s.d.-filtered BSEEG scores were analysed (Fig. 2(d)).

Fig. 2 Correlation between bispectral electroencephalography (BSEEG) scores and Delirium Rating Scale-Revised-98 (DRS) scores. (a) All data. (b) Data after s.d. filtering. (c) All BSEEG scores grouped by DRS scores. (d) s.d.-filtered BSEEG scores grouped by DRS scores.
BSEEG and DOSS
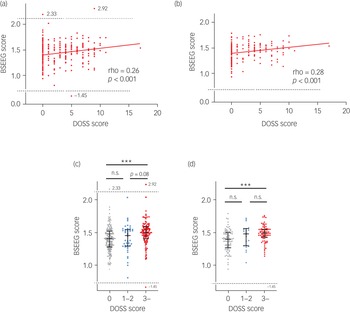
The BSEEG and DOSS were measured 374 times consecutively. When the BSEEG and DOSS scores were tested for correlation, Spearman's rank correlation coefficient was 0.24 (P < 0.001) (Fig. 3(a)). After s.d. filtering, the correlation coefficient increased to 0.28 (P < 0.001) (Fig. 3(b)). Comparing the BSEEG scores for the three groups divided on the basis of DOSS scores of 0, 1–2 and ≥3, there were no significant differences in BSEEG scores between the DOSS = 0 group and the DOSS = 1–2 group or between the DOSS = 1–2 group and the DOSS ≥3 group. However, the BSEEG scores of the DOSS ≥3 group were significantly higher than those of DOSS = 0 group (Fig. 3(c)). A similar tendency was observed when s.d.-filtered BSEEG scores were analysed (Fig. 3(d)).

Fig. 3 Correlation between bispectral electroencephalography (BSEEG) scores and Delirium Observation Screening Scale (DOSS) scores. (a) All data. (b) Data after s.d. filtering. (c) All BSEEG scores grouped by DOSS scores. (d) s.d.-filtered BSEEG scores grouped by DOSS scores.
Mortality prediction
Two-group comparison
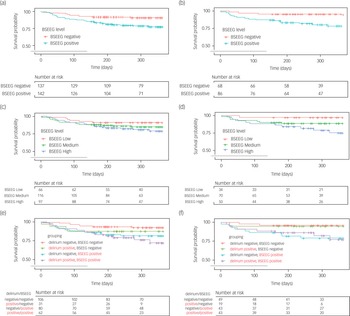
We tested to verify whether the first BSEEG score obtained using the new device could be used to predict 365-day mortality, replicating our previous data.Reference Shinozaki, Bormann, Chan, Zarei, Sparr and Klisares13 We looked at data from 279 participants with available mortality data. Mortality data for our 279 participants data confirmed that the BSEEG-positive group experienced higher mortality than the BSEEG-negative group (22.6 v. 9.1%, P = 0.004; log-rank analysis) (Fig. 4(a)). When we analysed participant mortality over 365 days controlling for age, gender and CCI score, the HR based on the two BSEEG groups (high versus low) was 2.36 (95% CI 1.20–4.65; P = 0.013). Even after control for clinical delirium status in addition to age, gender and CCI score, the HR based on the BSEEG groups remained significant, at 2.28 (95% CI 1.14–4.57; P = 0.020). Next, we analysed the s.d.-filtered first BSEEG data of 154 participants. The performance of mortality prediction improved when only s.d.-filtered first BSEEG scores were used. The BSEEG-positive group experienced higher mortality than the BSEEG-negative group (21.7 v. 4.4%, P = 0.006; log-rank analysis) (Fig. 4(b)). Analysing participant mortality controlling for age, gender and CCI score, the HR based on the two BSEEG groups was 4.56 (95% CI 1.32–15.62; P = 0.016). After controlling for clinical delirium status, in addition to age, gender and CCI score, the HR based on the BSEEG groups was 4.82 (95% CI 1.38–16.80; P = 0.014).

Fig. 4 Kaplan–Meier cumulative survival curve over 365 days based on (a) two-group comparison of all bispectral electroencephalography (BSEEG) scores, (b) two-group comparison of s.d.-filtered BSEEG scores, (c) three-group comparison of all BSEEG scores, (d) three-group comparison of s.d.-filtered BSEEG scores, (e) subgroup comparison of all BSEEG scores, and (f) subgroup comparison of s.d.-filtered BSEEG scores.
Dose-dependent increase in mortality by three-group comparison
Next, the participants were divided into three groups based on BSEEG score: high BSEEG, medium BSEEG, and low BSEEG. The low-BSEEG group tended to show a higher chance of survival (90.9%) than the medium-BSEEG (84.6%) and high-BSEEG groups (78.4%) (Fig. 4(c)). When we analysed participant mortality within 365 days controlling for age, gender, and CCI score, the association between the BSEEG grouping and mortality did not remain significant (HR = 1.29, 95% CI 0.85–2.00; P = 0.23). After controlling for clinical delirium status, in addition to age, gender and CCI score, the HR based on the BSEEG groups was 1.23 (95% CI 0.80–1.90; P = 0.34). When we limited our data to only s.d.-filtered BSEEG scores, analysis of the mortality rate showed a more distinct association between BSEEG score and mortality in a dose-dependent manner, indicating that a higher BSEEG score is associated with an increased risk for mortality (Fig. 4(d)). When we analysed participant mortality rates using this subset of participants, controlling for age, gender and CCI score, the HR based on the three BSEEG groups was 2.17 (95% CI 1.08–4.35; P = 0.029). Even after controlling for patients’ clinical delirium status, in addition to age, gender and CCI score, the HR based on the three BSEEG groups remained significant at 2.29 (95% CI 1.11–4.71; P = 0.024).
Subgroup survival analysis based on BSEEG and delirium diagnosis
We divided participants into four groups on the basis of their first BSEEG scores and clinical status of delirium (present or absent). BSEEG-positive participants with delirium showed the highest mortality rate. In contrast, BSEEG-negative participants without delirium showed the lowest mortality rate. Of note, BSEEG-positive participants without delirium had higher mortality rates than BSEEG-negative participants with delirium (Fig. 4(e)). Next, we analysed s.d.-filtered first BSEEG data. The mortality of the BSEEG-positive participants with delirium was nearly the same as that of BSEEG-positive participants without delirium. Similarly, the mortality of the BSEEG-negative participants with delirium was almost the same as that of the BSEEG-negative participants without delirium (Fig. 4(f)).
LOS in hospital
Hospital LOS in the BSEEG-positive group was significantly longer than in the BSEEG-negative group (median LOS: 4 v. 7 days, P = 0.032) (supplementary Fig. 3). The difference in LOS remained the same after s.d. filtering (median LOS: 4 v. 7 days, P = 0.047) (supplementary Fig. 3).
Discussion
In the present study, we investigated whether our new device could provide high-quality BSEEG signals to quantify delirium severity in participants who were at a higher risk of poor outcomes, such as mortality and/or extended LOS. We also investigated whether s.d. filtering could improve performance of the BSEEG method.
Identifying delirium and its severity
In our earlier study, we demonstrated that the BSEEG method could differentiate delirium-positive and delirium-negative cases.Reference Shinozaki, Chan, Sparr, Zarei, Gaul and Heinzman12 In this current study, high BSEEG score was related to CAM-ICU-positive status (Fig. 1 and supplementary Fig. 2). Furthermore, our present data validate the significant association between BSEEG scores and delirium severity measured by commonly used clinical assessment tools. We demonstrated that the BSEEG scores were correlated with DRS scores and DOSS scores (Figs 2(a), 2(b), 3(a) and 3(b)). And when participants were divided into three groups on the basis of the mortality risks associated with their DRS or DOSS scores,Reference Yamanashi, Iwata, Crutchley, Sullivan, Malicoat and Anderson21 the BSEEG scores increased along with the raised DRS or DOSS score in a score-dependent manner (Figs 2(c), 2(d), 3(c) and 3(d)). These results suggest that the BSEEG score can reflect the presence and severity of delirium.
Predicting mortality and LOS
The data presented here demonstrate that the BSEEG score is significantly associated with mortality among older hospital in-patients (Fig. 4(a) and (b)). It was also revealed that long-term mortality rates went up accordingly as the BSEEG score increased (Fig. 4(c) and (d)). Additionally, we showed that participants with a high BSEEG score stayed in hospital for a longer duration (supplementary Fig. 3). These results replicated and confirmed our previous BSEEG approach and established the reliability of this method.Reference Shinozaki, Bormann, Chan, Zarei, Sparr and Klisares13 Importantly, the BSEEG scores used to assess the association with mortality and LOS were from the very first EEG recordings conducted at the time of study enrolment. These initial EEG recordings were often within 24 h of admission to the hospital, suggesting that a single BSEEG score obtained from patients shortly after their arrival at hospital can and should be used to predict their outcomes. Such essential, vital and fundamental information would be extremely useful in a clinical setting to provide the opportunity for early and prompt intervention, with the potential to ameliorate poor outcomes and improve survival rates.
The new BSEEG method and device
In a recent fascinating publication describing work by Kimchi et al, it was demonstrated that EEG slowing detected by traditional EEG recording was associated with the presence of delirium. Their data also suggested that generalised EEG slowing, which was a composite measure defined as the presence of either generalised theta or generalised delta waves, was correlated with delirium severity.Reference Kimchi, Neelagiri, Whitt, Sagi, Ryan and Gadbois23 They demonstrated that patients with EEG slowing had poor outcomes, including increased LOS in hospital and increased rates of in-hospital mortality. Interestingly, they showed that rates of in-hospital mortality for patients with EEG slowing were high even if they were not diagnosed with delirium. Those data on detection of delirium, proportionality to delirium severity and association with poor outcomes based on EEG slowing are consistent with our data based on the BSEEG method.Reference Kimchi, Neelagiri, Whitt, Sagi, Ryan and Gadbois23 Because their results corroborate the results of our previous and present studies,Reference Shinozaki, Chan, Sparr, Zarei, Gaul and Heinzman12–Reference Saito, Malicoat, Leyden, Williams, Jellison and Long14 their data from traditional multichannel EEG supports the validity of our BSEEG method with the limited electrodes (just two leads in the present report) using our BSEEG algorithm. Moreover, the user-friendly BSEEG method has additional advantages. An EEG device used in this study is thumb-size with only two electrodes, and has the capacity to send EEG signals wirelessly so that BSEEG scores can potentially be calculated and displayed at the bedside. With objective scoring calculated by the BSEEG algorithm, it does not require expert EEG evaluation and can avoid potential delays in assessment. These advantages would make it easy to apply the BSEEG method in clinical settings.
BSEEG scores versus clinical diagnosis an an outcome predictor
Accumulated evidence suggests that patients with delirium have a higher mortality risk.Reference Marcantonio24,Reference Inouye, Rushing, Foreman, Palmer and Pompei25 However, our previous studies and our present subgroup analysis results verify that long-term poor outcome was predicted more significantly by BSEEG scores than by clinical diagnosis of delirium (Fig. 4(e)).Reference Shinozaki, Bormann, Chan, Zarei, Sparr and Klisares13,Reference Saito, Malicoat, Leyden, Williams, Jellison and Long14 Remarkably, subgrouping survival analysis using the s.d.-filtered BSEEG scores indicated that long-term mortality was predicted almost exclusively by BSEEG scores, regardless of the clinical status of delirium (Fig. 4(f)). These results suggests that a higher BSEEG score was stronger predictor of long-term mortality than clinically identifiable symptoms of delirium. There are two possible reasons for this. First, BSEEG could identify patients with brain dysfunction but without clinically diagnosable delirium. Our previous study demonstrated that even patients with only mild symptoms of delirium, that may not be diagnosed as delirium, had high mortality risk.Reference Yamanashi, Iwata, Crutchley, Sullivan, Malicoat and Anderson21 The BSEEG method might be able to capture such individuals with ‘subthreshold delirium’. Second, BSEEG may measure something different from clinical delirium. The BSEEG method likely measures more generic brain dysfunction, rather than brain dysfunction that is specific only to delirium. It is possible, however, that not all patients with brain dysfunction captured by BSEEG express symptoms of delirium as a phenotype. Our data suggest that the BSEEG method can detect many delirious patients and can quantify their delirium severity with reasonably accuracy. In addition to detection of what is called delirium, our data indicate that this BSEEG method may have independent prognostic significance. Further investigation using this BSEEG method is needed to make clear what is happening in participants with a high BSEEG score but without clinical symptoms of delirium, and it might lead to better understanding of delirium and its pathophysiology.
The signal-processing algorithm
We showed that s.d. filtering could improve performance of the BSEEG method. This is a practical but important step in developing BSEEG as a reliable clinical tool. We tested several methods to improve our signal-processing algorithm to seek the best performance. For example, we previously showed that a topological data analysis (TDA) approach improved delirium detection by BSEEG.Reference Yamanashi, Kajitani, Iwata, Crutchley, Marra and Malicoat15 However, TDA is computationally intensive and is harder to implement in a point-of-care device to be used at the bedside. Another approach we applied is s.d. filtering. There were several outliers with relatively high s.d., indicating that BSEEG data with high s.d. contain more noise. The use of s.d. filtering is a reasonably simple yet effective way of improving the performance of delirium detection as presented here. However, it was necessary to exclude much of the BSEEG data based on s.d. to increase performance. Approximately 45% of BSEEG scores were filtered out on the basis of high s.d.. For the device to be successfully implemented in a clinical setting, it is important that each individual score is reliable, so that detection of delirium and prediction of poor outcomes can be made promptly, followed by appropriate interventions. One way to achieve this goal is to implement s.d. filtering in the algorithm so that the EEG recording continues until optimal EEG signals under a certain s.d. cut-off value are obtained. We are actively planning to update our algorithm accordingly with this approach.
Limitations and further research
There are several limitations in this study. First, we obtained BSEEG scores at the time of enrolment, but there was no intervention initiated on the basis of BSEEG results. The next important step would be to obtain BSEEG scores, use this information to identify high-risk patients, intervene promptly and assess how early intervention modifies patient outcomes. Second, as mentioned above, s.d. filtering to exclude data was required to achieve better performance in this cohort. The technical challenges from a hardware standpoint need to be surmounted for further development of this approach. Third, this study was conducted in a single institution and more than 93% of study participants were non-Hispanic White. Thus, generalisability requires confirmation in a more diverse ethnic population. Nonetheless, the findings have been replicated repeatedly and consistently with hundreds of patients at UIHC over the past several years.
Supplementary material
Supplementary material is available online at https://doi.org/10.1192/bjp.2021.101.
Data availability
The data that support the findings of this study are available from the corresponding author (G.S.) on reasonable request.
Acknowledgement
The authors thank the patients who participated in this study.
Author contributions
T.Y. and K.J.C. contributed equally to this manuscript. T.Y. analysed data and wrote the manuscript. K.J.C. collected clinical data, analysed data and wrote the manuscript. M.K., K.Ko., Y.U. and Y.K. analysed data. N.E.W., E.J.S., K.R.C., T.T., M.V.M, P.S.M, F.M.H, G.C, Z.M.A., S.L., M.D.K. and N.O.N. contributed clinical data collection. M.I, K.Ka. and E.S. critically reviewed the manuscript. G.S. conceived ideas for the study, designed the study, organized data collection and analysis plan, and wrote the paper.
Funding
G.S. receives research grant support from the National Institutes of Health, NSF and Fujitsu Laboratories Ltd. These agencies had no role in the design, analysis, interpretation or publication of this study, except for the authors from Fujitsu Laboratories Ltd (M.K., K.Ko. and Y.U.), who participated in data analysis and publication preparation.
Declaration of interest
G.S. is co-founder of Predelix Medical LLC and has pending patents as follows: ‘Non-invasive device for predicting and screening delirium’, PCT application no. PCT/US2016/064937 and US provisional patent no. 62/263,325; ‘Prediction of patient outcomes with a novel electroencephalography device’, US provisional patent no. 62/829,411.


eLetters
No eLetters have been published for this article.