


Implications
A large number of sensor technologies have emerged in the past few years to measure multiple parameters that can inform about the nutritional status and processes in livestock including energy balance, feed degradation and digestion and energy expenditure. These technologies are considered in terms of nutrients intake and their use by ruminants in the present review. Data arising from them can be combined in different ways to achieve the objectives such as optimising feed and nutrient intake, feed efficiency, energy expenditure, nutrients retained or excreted. Some approaches to utilise these data include model-data fusion, data fusion and machine learning techniques to extract the best value from them, thus enhancing their utility.
Introduction
The fast advancement of new technologies, particularly sensors and information and communication technologies, promises a revolution in animal nutrition and production, as it has happened in many other fields such as livestock health and welfare (National Academies of Sciences, Engineering, and Medicine, 2016). The number of scientific publications and journals in this field has increased dramatically in the last 15 years. For example, a Scopus search for ‘sensor’ and ‘livestock’ resulted in less than 10 documents per year up to 2003, but it has yielded 79 documents in 2017. Research is performed across many aspects of new technologies to improve animal nutrition including, for example, the development of sensors to measure variables of interest, methodologies to analyse the large amounts of data collected, development of automated systems to monitor and control animal nutrition such as electronic feeders and auto-drafters and the discovery of new applications of the information gathered. Previous reviews of new technologies in ruminants focussed on aspects such as detection of animal health or physiological state, including oestrus (Rutten et al., Reference Rutten, Velthuis, Steeneveld and Hogeveen2013; Mottram Reference Mottram2016) or on the broader topic of precision livestock farming (e.g. Wathes et al., Reference Wathes, Kristensen, Aerts and Berckmans2008). However, no reviews seem to have focused on how such new technologies can be used to improve animal nutrition and the potential of integrating multiple data streams into nutrition simulation models. Technologies and processes exist today and continue to be developed to allow monitoring and managing animal nutrition in near real-time, following the precision livestock farming concept. Precision animal nutrition, or precision feeding, is an integrated information-based system to optimise the supply and demand of nutrients to animals for a target performance, profitability, product characteristics and environmental outcomes. Thus, precision animal nutrition is the application of principles, techniques and technologies that automatically integrate biological and physical processes related to animal nutrition using remote monitoring, modelling and control tools that allow making precise, accurate and timely decisions. The aim is to improve the precision of nutrition-related decisions to better manage the variability of the nutritional status of animals over time and between animals to achieve their optimal nutrition; this indirectly may also enhance their health and welfare (Kyriazakis and Tolkamp, Reference Kyriazakis and Tolkamp2018).
Feed resource requirements depend on the animal, including its production potential, stage of development, physiological state, energy expenditure, the environment and characteristics of the available feed. Resource requirements can also be affected and manipulated by management. Many of the variables that influence requirements can be measured in near real-time using sensor and information technologies, and be utilised for precision nutritional management, such as diet formulation or controlling feed delivery or access to particular feeds and amounts. However, precision nutrition of animals may also involve managing particular processes in the flow of nutrients such as designing grazing systems to optimise energy expenditure, grazing management and pasture utilisation rate (González et al., Reference González, Bishop-Hurley, Henry and Charmley2014a; Manning et al., Reference Manning, Cronin, Gonzalez, Hall, Merchant and Ingram2017); or facilitate the breeding of animals that are more efficient for certain nutritional scenarios such as prolonged dry seasons; or optimise slaughter strategies according to cost and value of weight gain.
The scope of this paper is to summarise the latest developments in techniques and technologies applicable to precise herbivore nutrition, with a strong focus on the nutrition of beef cattle. The boundary has been set to those technologies that can inform the type and amount of feed consumed by animals, and the biological processes of digestion and nutrient metabolism and excretion. We initially present a framework to visualise where and how the different technologies that can measure nutritional processes and contribute to precision animal nutrition, then discusses the most promising technologies highlighting advantages and limitations. Later, we discuss potential approaches to combine technologies and use their data together with mathematical models and data analytics. Finally, we address the challenges and potential gains that could be realised for research and commercial applications.
A framework to visualise where technologies may fit in livestock nutrition
An enormous number of technologies have been investigated and developed to improve the precision of herbivore nutrition. Technologies with similar design can collect very different data, which could determine their potential applications. One of the challenges is to visualise where each of the many technologies may fit in measuring key biological processes related to animal nutrition. These technologies must be evaluated for their accuracy and precision, and the necessary information should be added to the data collected, to maximise potential gains. Unfortunately, this process is often slower than developing the technology per se and may often limit adoption. Furthermore, different technologies may generate data streams that are incompatible with each other, which has been identified as a major bottleneck in developing an encompassing system (Wathes et al., Reference Wathes, Kristensen, Aerts and Berckmans2008).
Livestock nutrition is often visualised using charts representing the flow of nutrients and energy within the body of animals. These charts are often used to describe the nutritional processes of mechanistic prediction models (CSIRO, 2007; National Academies of Sciences, Engineering, and Medicine, 2016; Tedeschi and Fox, Reference Tedeschi and Fox2018). Figure 1 shows a simplified and idealised flow of nutrients (or energy) in the body of an animal, and it maps where technologies could fit in to measure key processes as nutrients are transformed. These nutritional processes could be managed and optimised with timely and accurate information provided by sensor technologies. Nutrient supply and demand, or inputs and outputs are the main targets to manage. The nutrition process, and thus the application of technologies, starts with the amount and quality of available feed at the top of Figure 1, followed by the selection and ingestion of feed and the breakdown of the feed consumed in the rumen to produce waste (e.g. methane) and useful by-products, such as volatile fatty acids and microbial proteins. Nutrients are then absorbed in the gastrointestinal tract to be used for basal metabolism and physical activities, and stored in body tissues, hair and excreted into milk (bottom of Figure 1). A fraction of the consumed nutrients is also excreted via urine and faeces.
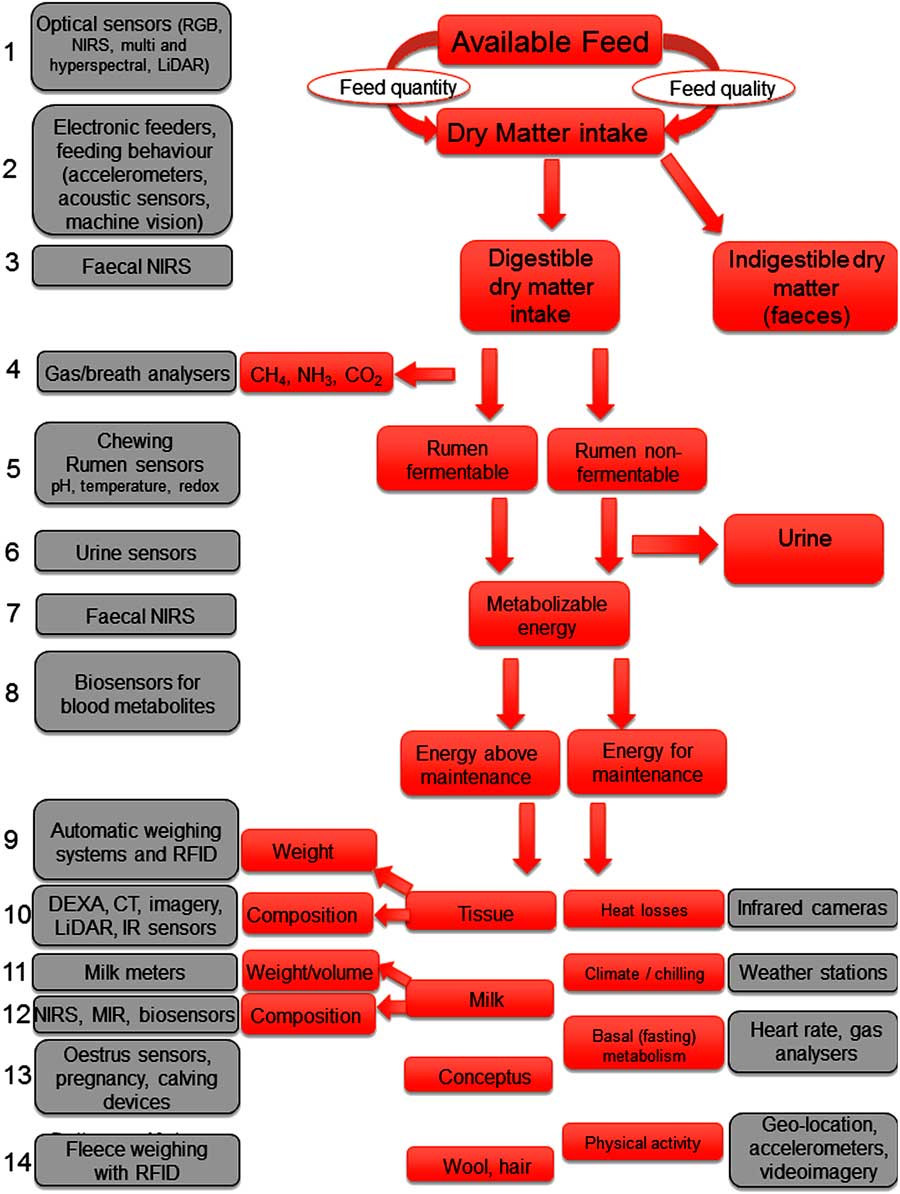
Figure 1 A simplified hypothetical flow of nutrients through an animal (red boxes) with potential technologies to measure key nutritional processes (gray boxes). RGB=red, green and blue; LiDAR=light detection and ranging; DEXA=dual energy X-ray absorptiometry; RFID=radio frequency identification; CT=computer tomography; MIR=mid IR.
At the top of Figure 1, the amount and quality of feed available to the animals determines the feed intake and hereby nutrient intake. Feed biomass and quality can be measured using a range of technologies and sensors that measure the reflectance of light, height, volume and density (Ali et al., Reference Ali, Cawkwell, Dwyer, Barrett and Green2016; Schaefer and Lamb, Reference Schaefer and Lamb2016). Measuring feed and nutrient intake of individual animals in a group in an accurate, precise and practical manner has been one of the most limiting factors in animal nutrition, especially under grazing conditions (Greenwood et al., Reference Greenwood, Valencia, Overs, Paull and Purvis2014). Because of this limitation, feed and nutrient intake has been estimated using alternative approaches in grazing animals such as faecal NIRS (fNIRS; Dixon and Coates, Reference Dixon and Coates2009), feeding behaviour (Greenwood et al., Reference Greenwood, Paull, McNally, Kalinowski, Ebert, Little, Smith, Rahman, Valencia, Ingham and Bishop-Hurley2017) and combining simulation models with measurements of growth rate, live weight (LW) and diet quality using fNIRS (González et al., 2014b). Measuring feed intake has recently become less challenging for intensively-produced animals, thanks to the development of electronic identification of individual animals and electronic feeders which weigh the amount of concentrates, forages or mixed rations throughout the day (Tolkamp et al., Reference Tolkamp, Schweitzer and Kyriazakis2000; Nkrumah et al., Reference Nkrumah, Okine, Mathison, Schmid, Li, Basarab, Price, Wang and Moore2006).
The next nutritional process of interest (row 3 of Figure 1) is the amount of digested nutrients, and thus available for the animal, and the amount that is eliminated via gaseous emissions, faeces and urine. Technologies are being developed to measure N excretion from N concentration, via urine volume and location of urination (Shepherd et al., Reference Shepherd, Shorten, Costall and Macdonald2017). Nutrients in faeces including total N, NH3, K and P can also be measured using fNIRS (Dixon and Coates, Reference Dixon and Coates2009), and gas emissions from manure using gas analysers (Mathot et al., Reference Mathot, Decruyenaere, Stilmant and Lambert2012). At row 4 of Figure 1, the rumen degradable fraction of the feed produces waste which is belched in the form of CH4, CO2 and NH3 and can be measured with breath analysers and gas sensors (Hegarty, Reference Hegarty2013). In addition, ruminal degradation of feed produces by-products, which directly changes the physicochemical conditions inside the rumen (row 5 of Figure 1) including the well-known reduction in rumen pH which in turn affects fibre degradation (National Academies of Sciences, Engineering, and Medicine, 2016).
Intra-ruminal devices have been developed to measure the pH and other characteristics of the rumen fluid (Mottram et al., Reference Mottram, Lowe, McGowan and Phillips2008; Bishop-Hurley et al., Reference Bishop-Hurley, Paull, Valencia, Overs, Kalantar-zadeh, Wright and McSweeney2016), whereas measuring rumination (row 2 of Figure 1) using accelerometers or pressure sensors (Zehner et al., Reference Zehner, Umstatter, Niederhauser and Schick2017) can help estimating saliva production, that is buffering capacity. Nutrients are then absorbed into the rumen or intestines and thus available for the metabolism of animals (row 7 and 8 in Figure 1) although some of these nutrients are eliminated via the urine (row 6 of Figure 1). Currently, there are no technologies for direct measurement of the amount of metabolisable energy or available nutrients. However, indirect measures could be derived from a combination of technologies such as feed composition and fNIRS for diet digestibility, metabolisable energy concentration of diet and energy expenditure and retained energy (Brosh, Reference Brosh2007). Cow-side sensors that measure the concentration of metabolites or minerals in blood have been tested successfully in livestock such as glucose, β-hydroxybutyrate and Ca (Iwersen et al., Reference Iwersen, Falkenberg, Voigtsberger, Forderung and Heuwieser2009; Neves et al., Reference Neves, Stokol, Bach and McArt2018). However, wearable devices that continuously and wirelessly measure the concentration of chemical compounds have not yet been trialled in farm animals to the authors’ best knowledge. However, successful examples exist in human medicine including tattoo-based wireless nanosensors on tooth for bacteria monitoring in the mouth or patches for the monitoring of sweat or interstitial fluid (Matzeu et al., Reference Matzeu, Florea and Diamond2015).
The amount of metabolisable nutrients and energy available for the animal are used for maintenance and production (rows 9 to 14 in Figure 1). Maintenance metabolism includes heat losses by radiation, conduction and convection with the former being the most important for standing animals (right-hand in rows 10 and 11 of Figure 1). This can, nowadays, be estimated using IR thermography cameras coupled with biophysical modelling (McCafferty et al., Reference McCafferty, Gilbert, Paterson, Pomeroy, Thompson, Currie and Ancel2011). Skin body temperature measured with IR cameras has also been linked to heat production, digestion, methane production and feed efficiency in cattle (Montanholi et al., Reference Montanholi, Swanson, Palme, Schenkel, McBride, Lu and Miller2010; Leão et al., Reference Leão, Coelho, Machado, Azevedo, Lima, Carneiro, Lage, Ferreira, Pereira, Tomich and Campos2018). Energy is also used to maintain body temperature with well-known models commonly used to estimate energy required under different ambient conditions (CSIRO, 2007; National Academies of Sciences, Engineering, and Medicine, 2016). Weather stations on farms, or research sites, could help estimating these conditions in real-time (right-hand in row 11 of Figure 1). On the right-hand side of row 12 of Figure 1, energy expenditure required for basal or fasting metabolism can be estimated measuring O2 consumption and heart rate in animals with technologies such as masks containing gas analysers and heart rate monitors (Brosh, Reference Brosh2007). The energy required for maintenance includes the part used for physical activities such as walking and grazing with several technologies available to measure behaviour such as Global Navigation Satellite Systems (GNSS) and accelerometers (Brosh et al., Reference Brosh, Henkin, Ungar, Dolev, Orlov, Yehuda and Aharoni2006; González et al., Reference González, Bishop-Hurley, Handcock and Crossman2015). Thus, energy expenditure and requirements can be precisely measured using a combination of gas analysers, heart rate monitors and behavioural monitoring of individual animals (right-hand in row 14 of Figure 1).
Energy and nutrients above maintenance are used for production, and therefore the total amount of energy and nutrients secreted or retained can be measured in milk or in empty BW and chemical composition, it is so wool production, and gestation (left-hand side of rows 9 to 14 of Figure 1). Technologies exist nowadays to measure these energy flows, such as online or handheld milk metres and sensors (Brandt et al., Reference Brandt, Haeussermann and Hartung2010) and automatic in-paddock weighing systems (González et al., Reference González, Bishop-Hurley, Henry and Charmley2014a). Several other technologies to measure BW and its composition are presently being adopted by the livestock industries such as carcass scanning using X-ray technology (Scholz et al., Reference Scholz, Bunger, Kongsro, Baulain and Mitchell2015).
In summary, a range of available sensor and information technologies can measure many nutritional processes concurrently, offering a huge potential to improve the precision of nutritional management of animals. However, it is unlikely that monitoring systems of every nutritional process will be implemented. It is likely that systems will focus on the key technologies that monitor the most limiting or critical factors to achieve particular objectives and facilitate timely decision making. For example, pasture utilisation rate, diet quality and energy expenditure in physical activities are often factors that play an important role in profitable grazing animal production. Thus, such production system would require technologies tailored to monitor those factors, which may not be of value for intensive animal production. However, some technologies could be of value for a broad range of production systems and be also suitable for other applications such as disease detection such as accelerometers to measure animal behaviour (Rutten et al., Reference Rutten, Velthuis, Steeneveld and Hogeveen2013).
It is important to highlight that some of these technologies are currently being used in commercial farming such as automatic weighing of animals, milk metres, collars, ear tags and leg attachments containing accelerometers, multispectral sensors implemented in satellites and drones to monitor pastures and electronic feeders. Other technologies are in the process of being deployed and adopted in commercial conditions such as X-ray scanning of animal bodies for muscle, fat and bone content. Lastly, other technologies remain at the research domain to date including breath analysers for gaseous emissions, heart rate monitors and IR thermography. It is important to note that some technologies collect the intended data autonomously needing no human intervention such as feed distribution and measuring feed intake in intensively housed animals, milk composition and volume, ruminal parameters and LW and growth rate. Others are in the process of being automatised such as body composition and condition using scanning technologies, and forage quantity and quality in grazing conditions using reflectance sensors. However, other data require animal handling or hand collection of samples for later analysis at present such as body fatness using ultrasound or diet composition and quality using NIRS on faeces or feed. Nevertheless, there are ongoing efforts around the world to develop techniques to automatise many of these processes using autonomous robotic systems or smart techniques such as the collection of 3D imagery at weighing stations to predict body composition, which could also be implemented under grazing conditions.
Description of promising technologies to assess the nutritional status of animals
Feed intake
Measuring feed intake allows the estimation of the amount of nutrients supplied to animals and feed utilisation efficiency, if animal production is also measured such as body growth and milk production. In addition, feed intake and feed efficiency are associated with dry matter (DM) digestibility, heat production and methane emissions in ruminants (Nkrumah et al., Reference Nkrumah, Okine, Mathison, Schmid, Li, Basarab, Price, Wang and Moore2006). The most common technologies to measure individual feed intake include fNIRS, electronic feeders, monitoring of feeding behaviour and frequent weighing of animals.
Electronic feeders
Electronic feed intake recording system is the most commonly used technology to measure the feed intake of individual animals for both research and commercial applications such as the allocation of feed types and amounts to individual animals based, for example, on production potential or target production level (Hills et al., Reference Hills, Wales, Dunshea, Garcia and Roche2015). There are a variety of these systems in the market with slightly different characteristics that allow different applications (Tolkamp et al., Reference Tolkamp, Schweitzer and Kyriazakis2000; Nkrumah et al., Reference Nkrumah, Okine, Mathison, Schmid, Li, Basarab, Price, Wang and Moore2006). Most of these systems consist of feeders mounted on load cells that continuously measure the weight of feed at high frequency (e.g. 1 Hz) and an animal radiofrequency identification system (RFID) to assign the feed disappeared from the feeder to individuals. The RFID tags are widely used as the official animal identification system in many countries and, therefore, are the backbone of many technologies such as those to measure LW, milk production and methane emissions. Electronic feeders also allow detailed measurements of feeding behaviour including daily feeding time, feeding rate, number of meals and the distribution of intake throughout the day (Tolkamp et al., Reference Tolkamp, Schweitzer and Kyriazakis2000; Kyriazakis and Tolkamp, Reference Kyriazakis and Tolkamp2018). Some electronic feeders also have pneumatic gates to control the amount and type of feed consumed by each animal fed in a group situation (Tolkamp et al., Reference Tolkamp, Schweitzer and Kyriazakis2000) and automatic feed dispensers (e.g. hoppers) which release a predefined amount of feed once the RFID of an animal has been read. Electronic feeders have seen widespread adoption to measure the residual feed intake (a measure of feed efficiency), because of the bearing on profitability and environmental footprint (Nkrumah et al., Reference Nkrumah, Okine, Mathison, Schmid, Li, Basarab, Price, Wang and Moore2006).
Similar solar-powered feeders are also available to measure supplement intake at pasture (Cockwill et al., Reference Cockwill, McAllister, Olson, Milligan, Ralston, Huisma and Hand2000; Reuter et al., Reference Reuter, Moffet, Horn, Zimmerman and Billars2017). In dairy cattle, electronic feeders are widely adopted, although it is unclear whether individual feeding of supplements at pasture increases production, fat or protein content of milk (Hills et al., Reference Hills, Wales, Dunshea, Garcia and Roche2015). Individualised supplementation of dairy cattle (type and amount of feed supplemented to each cow) could be driven by information provided by on-line milk metres, automatic weighing, parity and stages of lactation and pregnancy. However, Hills et al. (Reference Hills, Wales, Dunshea, Garcia and Roche2015) concluded that the difficulty of measuring pasture intake and thus substitution rate of pasture by supplements being a limitation. Individualised feed supplementation or nutritional management should consider the flow-on effects expected on the processes depicted in Figure 1. For example, increasing the supplementation of pasture-fed cattle can reduce pasture intake, reduce grazing time and energy expenditure, reduce ruminal pH and fibre digestion and affect LW and milk production and its composition. Inversely, concentrate feeding can maintain longer pasture sequence when grass is limiting and allocation of supplements using electronically controlled feeders based on available forage and nutrient requirements of individual animals have potential for commercial applications.
Feeding behaviour
Feed intake is the product of the number of bites per day and the size of each bite (g of DM per bite), but the former can also be predicted from bite rate (bites/min) and grazing time in min/day (Galli et al., Reference Galli, Cangiano, Milone and Laca2011). Theoretically, these four variables could be used to predict daily feed intake of herbivores and substantial effort has been put in their measurement. Feed intake can also be determined as the product of meal frequency and meal size, particularly in housed animals using electronic feeders (Tolkamp et al., Reference Tolkamp, Schweitzer and Kyriazakis2000). Remote monitoring of feeding behaviour has become common in animals using a range of sensors such as accelerometers providing position and movement of the head (Greenwood et al., Reference Greenwood, Valencia, Overs, Paull and Purvis2014), GNSS devices proving geolocation in the paddock (González et al., Reference González, Bishop-Hurley, Handcock and Crossman2015), accoustic recording to measure chewing and biting (Galli et al., Reference Galli, Cangiano, Milone and Laca2011), noseband sensors to measure jaw activity (Zehner et al., Reference Zehner, Umstatter, Niederhauser and Schick2017), passive RFID tags activated by an antennae at the feeder (Schwartzkopf-Genswein et al., Reference Schwartzkopf-Genswein, Huisma and McAllister1999), radio-localisation to measure time near or at the feeder (e.g. ultra-wideband active RFID technology; Theurer et al., Reference Theurer, Anderson, White, Miesner, Mosier, Coetzee, Lakritz and Amrine2013) or video-recording with automatic image analysis to measure animal presence at the feeder (Matthews et al., Reference Matthews, Miller, Plötz and Kyriazakis2017). Some of these technologies may be more practical for commercial applications than others such as accelerometers in ear tags or collars compared with noseband sensors; however, this will depend of the objective and benefit of one technology over another.
New technologies need to be evaluated for their ability to measure the parameters of interest. Accuracy, often measured through root mean square error, intercept and regression coefficient, and precision often measured through R 2 can be used concurrently to assess the predictability of mathematical nutrition models (Tedeschi et al., Reference Tedeschi2006). Precision is important in most contexts, however accuracy may only be important for observed v. predicted values of the same variable but not when the observed and predicted variables are different, for example measures of accuracy may not be relevant in a regression of daily feed intake against grazing time. Most of these technologies have shown acceptable accuracy and precision (often at or above 90%) to measure eating or ruminating activities, or both. However, the user needs to define its level of acceptability given the available instruments, the intrinsic random variability of the variable of interest and the objective or intended used of the data. Accelerometers combined with GNSS are most commonly used in cattle collars under grazing conditions because distance walked is also an important metric for the classification of sensor data (González et al., Reference González, Bishop-Hurley, Handcock and Crossman2015). However, accelerometers embedded in ear tags (Pereira et al., Reference Pereira, Heins and Endres2018) or neck collars (Oudshoorn et al., Reference Oudshoorn, Cornou, Hellwing, Hansen, Munksgaard, Lund and Kristensen2013) have also demonstrated high accuracy to measure eating time. Technologies that measure time spent at or near the feeder such as passive (Schwartzkopf-Genswein et al., Reference Schwartzkopf-Genswein, Huisma and McAllister1999) or active RFID ear tags (Theurer et al., Reference Theurer, Anderson, White, Miesner, Mosier, Coetzee, Lakritz and Amrine2013) cannot ascertain whether an animal is consuming feed or just standing at the feed bunk. Importantly, multiple sensors capable of measuring different aspects of animal behaviour are being integrated into ear tags (Greenwood et al., Reference Greenwood, Valencia, Overs, Paull and Purvis2014), collars (González et al., Reference González, Bishop-Hurley, Handcock and Crossman2015) or halters (Zehner et al., Reference Zehner, Umstatter, Niederhauser and Schick2017), which could improve predictions of feed intake.
Noseband pressure sensors allow estimating time spent eating and ruminating, and number and rate of chews and bites under both extensive and intensive production (Zehner et al., Reference Zehner, Umstatter, Niederhauser and Schick2017). Pressure sensors could allow measuring bite size and rate, while eating from the amplitude and frequency of ‘peaks and troughs’ in the data; however, there are no studies demonstrating that this is possible. Leiber et al. (Reference Leiber, Holinger, Zehner, Dorn, Probst and Neff2016) unsuccessfully used noseband sensors to estimate feed intake by dairy cows fed high-forage total mixed ration from daily eating time and rumination due to the large difference in feeding behaviour between animals. Greenwood et al. (Reference Greenwood, Paull, McNally, Kalinowski, Ebert, Little, Smith, Rahman, Valencia, Ingham and Bishop-Hurley2017) reported a R 2=0.59 to predict DM intake from grazing time (accelerometers in collars) of steers, whereas Umemura et al. (Reference Umemura, Wanaka and Ueno2009) reported a R 2=0.71 using a bite counter (accelerometer in collar) in grazing dairy cows compared with grass disappearance using a rising plate metre. Galli et al. (Reference Galli, Cangiano, Milone and Laca2011) predicted DM intake during short sessions in sheep with an R 2=0.92 from chewing energy per bite and the total amount of energy in chewing using acoustic monitoring.
The limiting measure to predict feed intake of grazing animals seems to be bite size at present. Predicting feed intake from feeding time and number of chews per day may require consideration of all factors likely to affect these such as motivation to eat or hunger, competition for feed, fibre content, particle size of forage, sward structure (height and density) or even health status of the animals. For instance, previous research demonstrated that daily feeding time could be reduced by two-fold in animals experiencing lameness or at high competition for feed amongst group mates (González et al., Reference González, Manteca, Calsamiglia, Schwartzkopf-Genswein and Ferret2012). In summary, feeding behaviour could eventually serve as a predictor of feed intake in very specific conditions, but unless bite size can be measured, seems unlikely to predict pasture intake in a wide range of conditions.
Near infrared spectroscopy
Analysis of faecal samples with NIRS instruments has been widely researched to determine daily pasture intake, chemical composition (quality) and digestibility of the diet selected and consumed by herbivores including elk, cattle, sheep, goats and deer (Dixon and Coates, Reference Dixon and Coates2009; Kneebone and Dryden, 2015). The fNIRS technique has the potential to be widely adopted by the livestock industries with the eruption of small handheld sensors into the market connected to or integrated into a smartphone (e.g. SCiO; Consumer Physics Inc., Tel Aviv, Israel, https://www.consumerphysics.com/). However, one of the main challenges is to develop accurate and generalised prediction equations, under the conditions on which these equations will be used (Dixon and Coates, Reference Dixon and Coates2009). Thus, large and diverse sample sets will be required to calibrate handheld NIRS sensors.
Kneebone and Dryden (2015) reported that fNIRS could predict DM, organic matter, CP, digestible DM and digestible organic matter intakes in sheep fed a range of forages with different supplements with a R 2 of 0.85 to 0.88 and a standard error of predictions between 4.0 to 6.4 g/kg of metabolic BW/day. However, previous studies using fNIRS have reported variable R 2 values when predicting DM and organic matter intake of forage diets ranging from 0.46 to 0.92 for DM and organic matter intakes by goats (Dixon and Coates, Reference Dixon and Coates2009). Crude protein intake (g/kg BW0.75 per day) predicted from fNIRS has shown R 2 of 0.64 to 0.98 across a number of studies and species reviewed by Kneebone and Dryden (2015). In general, fNIRS methods can predict intake by analysing faecal chemistry representing what was consumed by the animals through ‘undigested’ fractions or by-products reaching the faeces. Thus, feed ingredients or fractions that disappear completely in the gastrointestinal tract might not be picked up by fNIRS (e.g. molasses and urea; Kneebone and Dryden, 2015). The accuracy and precision of predictions of feed intake and growth rate have been less satisfactory compared with diet DM digestibility and CP (Dixon and Coates, Reference Dixon and Coates2009).
Live weight
Feed intake over short periods of time and under housed conditions (bunk or feeder) was recently measured with high accuracy in sheep using automatic weighing of individual animals before and after eating their meals (Gonzalez-Garcia et al., Reference Gonzalez-Garcia, Golini, Hassoun, Bocquier, Hazard, Gonzalez, Ingham, Bishop-Hurley and Greenwood2017). This technique could be valuable when defecation, urination and water intake do not occur between measurements of LW, or where these can be measured. Minson and McDonald (Reference Minson and Mcdonald1987) used a different approach where LW and growth rate were used to develop empirical equations that predicted daily forage intake with high accuracy in grazing cattle (RMSE=±0.4 kg DM/day; CV=±8.7%). Despite being accurate to predict forage intake, the equation is unlikely to be generalisable to other types of diets such as those containing concentrates and it does not account for potentially differing feed efficiency between animals.
Feed availability and quality
Timely and accurate information about the quantity and quality, or nutritional value, of the feed consumed is of critical importance for the nutrition of herbivores. A range of sensors are being investigated for this application including light detection and ranging (LiDAR) and light reflectance or absorption from the ground using spectrophotometers, red-green-blue (RGB) imagery, 3D image reconstruction, multi- or hyper-spectral sensors which can be handheld or mounted on vehicles, static poles, unmanned vehicles (e.g. drones) or satellites (Handcock et al., Reference Handcock, Gobbett, Gonzalez, Bishop-Hurley and McGavin2016; Schaefer and Lamb, 2016). Under intensive housing conditions, feed availability has been measured succesfully using volume as a proxy of feed weight or amount using both LiDAR (McCarthy et al., Reference McCarthy, Mcleod and McMeniman2018) and video imagery (Shelley et al., Reference Shelley, Lau, Stone and Bewley2016), which could open oportunities for new ways of measuring feed intake in herbivores. Under grazing conditions, a range of vegetation indices can be calculated from the reflectance of light from the ground across the visible and near-IF spectrums, each with advantages and disadvantages (Schellberg et al., Reference Schellberg, Hill, Gerhards, Rothmund and Braun2008). These include measuring pasture biomass, quality parameters such as nitrogen concentration, pasture growth rate, vegetation structure and composition, toxin and metabolite concentrations, mapping vegetation types, the presence of weeds and to assess the relationship with stocking rates (Schellberg et al., Reference Schellberg, Hill, Gerhards, Rothmund and Braun2008; Ali et al., Reference Ali, Cawkwell, Dwyer, Barrett and Green2016). Unmanned aerial vehicles offer the advantage of being able to collect imagery regardless of cloud cover, not be subject to satellite overpass schedule and have higher spatial resolution often at 1 to 2 cm/pixel. Meanwhile, satellite imagery can assess forage biomass and quality of very large areas often with less frequency and lower spatial resolution. Ausseil et al. (Reference Ausseil, Dymond, Dynes, Shepherd, DeVantier and Sutherland2011), for instance, reported a high correlation between vegetation indices and metabolisable energy (r=0.85), organic matter digestibility (r=0.85) and CP (r=0.83) contents. In line with other technologies based on light reflectance or absorbance, one of the most important limitations of using imagery to measure forage biomass and quality is the development of calibration equations with the required accuracy to predict the parameters of interest under diverse conditions, that is environments, pasture type and seasons.
Rumen parameters
Multiple factors are associated with suboptimal ruminal fluid pH including diet formulation, feeding management, feeding behaviour and the design of facilities, such as feeding space (González et al., Reference González, Manteca, Calsamiglia, Schwartzkopf-Genswein and Ferret2012). Ruminal degradation or total tract digestibility of fibre can be reduced at low pH. Many simulation models predict rumen fluid pH and then fibre degradation based on the composition of the diet consumed (National Academies of Sciences, Engineering, and Medicine, 2016). Ruminal sensors can provide objective data about rumen fluid pH (Mottram et al., Reference Mottram, Lowe, McGowan and Phillips2008), whereas accelerometers and noseband sensors can measure rumination activity when saliva, and thus buffering capacity, is produced. On the one hand, this information could be used to improve diet formulation to reduce the risk of ruminal acidosis. On the other hand, this information can also be used by simulation models in near real-time to predict diet digestion and milk production and composition (e.g. National Academies of Sciences, Engineering, and Medicine, 2016; Tedeschi and Fox, Reference Tedeschi and Fox2018). Intra-ruminal devices to measure rumen gas pressure could also find applications to monitor and reduce the impact of bloat in cattle grazing high-risk legume pastures or grain-based diets (Mottram et al. Reference Mottram, Lowe, McGowan and Phillips2008).
Rumen pH, temperature and gas pressure can nowadays be measured using intra-ruminal sensors (Mottram et al. Reference Mottram, Lowe, McGowan and Phillips2008). However, there are still limitations for this technology to be widely adopted due to drift of the pH measurements over time and the impossibility to easily recover the devices. The increasing capabilities of ruminal sensors to monitor internal conditions was recently demonstrated by Bishop-Hurley et al. (Reference Bishop-Hurley, Paull, Valencia, Overs, Kalantar-zadeh, Wright and McSweeney2016) who used an intra-ruminal device to measure ruminal fluid temperature, pressure, CH4, CO2 and H2 for 1 to 4 days. However, the technology is still in its early stages of development and more work is required to extend the life of the device under the conditions of the rumen and to determine the ability of this approach to predict daily emissions as the rumen liquor can become saturated with dissolved gases.
Live weight
Weighing systems coupled with RFID can nowadays record LW accurately in dairy cattle, beef cattle and sheep as the animals walk through weighing platforms installed at locations that animals frequently attend such as water points, supplement stations and milking sheds (Thorup et al., Reference Thorup, Hojsgaard, Weisbjerg and Friggens2013; González et al., Reference González, Bishop-Hurley, Henry and Charmley2014a; Gonzalez-Garcia et al., Reference Gonzalez-Garcia, Golini, Hassoun, Bocquier, Hazard, Gonzalez, Ingham, Bishop-Hurley and Greenwood2017). The LW and average daily gain (ADG) data have been shown to provide important information to capture detailed changes related to environmental factors, physiological status and nutritional and grazing management (Thorup et al., Reference Thorup, Hojsgaard, Weisbjerg and Friggens2013; González et al., Reference González, Bishop-Hurley, Henry and Charmley2014a).
Automatic drafting gates to segregate individual animals whose RFID have been read by the walk-over-weighing technology can also be implemented. This allows to draft animals into separate yards according to LW and growth rate, marketing program, genetics or physiological status for more precise nutritional management. For example, LW data collected from beef cows and calves in Figure 2 (González, unpublished data) show a large variability in LW and ADG between animals and over time. The variability in performance between individual animals in a grazing group is currently poorly understood and thus management solutions are difficult to develop. Auto-drafting of under-performing animals to provide supplementary feeding could be a plausible solution to reduce such variability in grazing animals and to better understand the individual’s responses to nutritional treatments. The temporal variation in LW and growth rate observed in Figure 2 was due to the physiological status of the animals (calving and lactation), and pasture availability and quality like that shown by González et al. (2014a). Animals in this experiment were changed to a different paddock, as routinely done on the farm using visual assessment of both the paddocks and animals. However, this grazing management appeared to be too late because animals were losing weight before they were moved to another paddock. This can be seen in Figure 2 with successive waves of LW declining and recovering but an ideal management would limit theses waves. Furthermore, it is unlikely that these cows would have been losing or gaining more than 5 kg/day of body tissue so fast. This highlights the need for further research to determine the relative contribution of rumen fill, compensatory growth and mobilisation of body reserves on the estimation of growth rate from LW data collected at high frequency. Interestingly, the calves in Figure 2 were mostly gaining weight during periods even when the cows were losing it (mobilising reserves). These periods could also be targeted for more precise nutritional management such as start and finish times of feed supplementation, amounts to be offered and type of supplement (energy, protein or minerals). Figure 2 also shows the changes in LW of cows that calved and not. Nutrients demands of cows increase after calving due to milk production and therefore remote monitoring of calving dates and the amount of LW loss could allow more precise nutritional management of females in grazing beef herds.
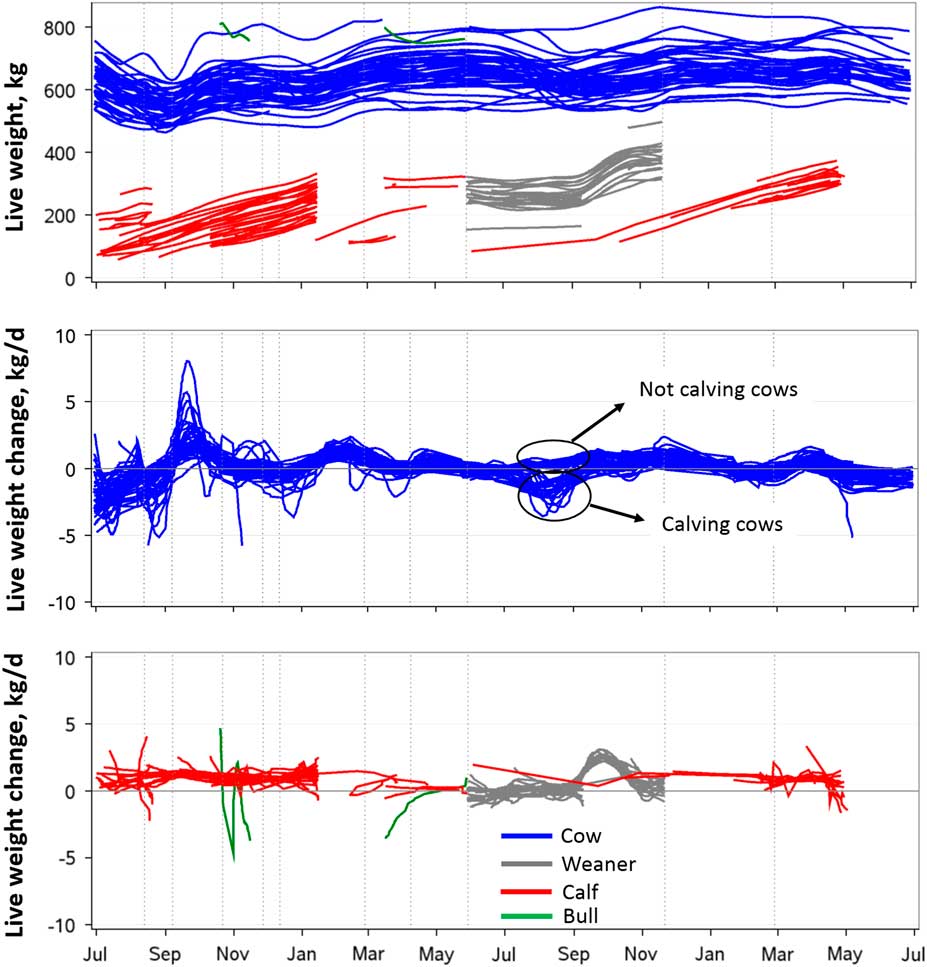
Figure 2 Live weight and growth rate of a Charolaise beef cattle herd with cows and calves at foot, calves after weaning (weaners) and bulls automatically measured using an in-paddock weighing system (González et al., unpublished data). Winter: June, July and August; Spring: September, October and November, Summer: December, January and February. Gray vertical lines indicate paddock change.
Body composition
The effects of nutrition on animals are often evaluated regarding BW and composition (and its changes) such as the amount of muscle, fat and bone mineral contents. These measures indicate the amount of nutrients retained or mobilised (energy, protein and minerals such as Ca and P) and are thus linked to reproduction, health and welfare, and the value of meat in carcasses. New technologies providing timely and accurate information on body composition will allow monitoring one of the final processes in the flow of nutrients in the body of animals, and the effects of physiological status, stage of development (age), nutrient utilisation efficiency and the biological processes involved during under- and over-nutrition. This information can improve nutritional management to optimise performance, reproduction, survival (reduce mortality), breeding, marketing strategies and profitability. For example, most of the current work in feed efficiency, such as for residual feed intake, is based on the efficiency to convert feed into LW or carcass weight. This often ignores the composition of weight gain which is difficult to measure at present although attempts are sometimes made to account for these using proxies such as subcutaneous fat thickness or intramuscular fat. A review of some of the new technologies to measure body composition in farm animals has been published by Scholz et al. (Reference Scholz, Bunger, Kongsro, Baulain and Mitchell2015). Some of these non-invasive technologies are being considered by the livestock industries in some countries for routine evaluation of carcass yield and quality in abattoirs (fat and muscle content, and eating quality). These data can then be used to optimise the nutritional management of individual animals and groups according to their starting body condition and genetic makeup (e.g. frame and maturity) to target specific carcass endpoints that maximise profitability. This is critical because greater body fatness can result in improved meat quality but also reduce feed conversion efficiency and profitability. This approach would be applicable to optimise feeding of animals fatted in the future; however, some of these technologies such as X-ray have been trialled successfully in live animals. A description of the most promising technologies is provided below.
Imaging as means of estimating body volume and composition
Both 2D and 3D imaging from still pictures and video recordings have been researched to calculate indirect measures of the composition of both live animals and carcasses. These systems estimate body dimensions, shape and volume as an indicator of its composition. However, the correct identification and measurement of biometrics remains the bottleneck of such technologies. For example, Bewley et al. (Reference Bewley, Peacock, Lewis, Boyce, Roberts, Coffey, Kenyon and Schutz2008) and Halachmi et al. (Reference Halachmi, Klopcic, Polak, Roberts and Bewley2013) have used 2D RGB and thermal imagery to measure body condition score (BCS) in dairy cattle with high precision. Similarly, Hopkins et al. (Reference Hopkins, Safari, Thompson and Smith2004) used a commercial system in beef and sheep carcasses to predict marbling, rib fat depth, ribeye area, fat coverage of the carcass and carcass lean meat yield, amongst other measures. However, predictions of retail cuts yield and lean meat yield were not precise or accurate (R 2<0.52; Hopkins et al., Reference Hopkins, Safari, Thompson and Smith2004). More recently, McPhee et al. (Reference McPhee, Walmsley, Skinner, Littler, Siddell, Cafe, Wilkins, Oddy and Alempijevic2017) used a consumer 3D sensor (Kinect; Microsoft Corporation, Redmond, WA, USA) to predict muscle score and P8 fat of live animals with 80% correct classification rate. Further developments were done in pigs using the same sensors to predict LW and body dimensions with high accuracy and precision (Pezzuolo et al., Reference Pezzuolo, Guarino, Sartori, González and Marinello2018) and in dairy cows to predict BCS (Song et al., Reference Song, Bokkers, van der Tol, Groot Koerkamp and van Mourik2018). More advanced 3D imagery sensors have also been tested to measure BCS in dairy cattle with high accuracy and reproducibility (Fischer et al., Reference Fischer, Luginbuhl, Delattre, Delouard and Faverdin2015).
Ultrasound to estimate body composition
Ultrasound has been widely used in both live animals and carcasses to estimate fat depth at the rib and rump sites, intramuscular fat and kidney fat depth as a proxy for internal fat accumulation (Ribeiro and Tedeschi, Reference Ribeiro and Tedeschi2012). The goal was to develop systems to predict carcass and internal fat deposition overtime as animals were growing, but the process would slow down animal processing in the chute of commercial systems. Although ultrasound is widely used, the depth of penetration and accuracy of the information pose limitations to its application.
X-ray absorptiometry to estimate body composition
Dual energy X-ray absorptiometry (DEXA) has been the technique most widely used to measure composition of meat animals of live animals, whole carcasses and cuts (Pearce et al., Reference Pearce, Ferguson, Gardner, Smith, Greef and Pethick2009). Dual energy X-ray absorptiometry can measure total soft tissue, fat, muscle and bone content of carcasses (as a percentage of carcass weight and total kg), lean meat yield and mineral content and density of bones as well (Scholz et al., Reference Scholz, Bunger, Kongsro, Baulain and Mitchell2015). Besides the determination of energy and protein retention in animals, DEXA could also be used to monitor calcium and phosphorus metabolism. This technique is based on the differential attenuation of X-rays by bone, fat and non-fat tissues penetrating into the body to accurately estimate body composition. Algorithms developed for humans were successfully adjusted with measurements on live sheep to yield high accuracy and precision in predicting carcass composition (R 2>0.90; Pearce et al., Reference Pearce, Ferguson, Gardner, Smith, Greef and Pethick2009). However, some limitations of DEXA include the need for extensive calibration with the animal species of interest, the loss of precision with tissue depth and the need of adjustments to predict chemical composition (Pomar et al., Reference Pomar, Kipper and Marcoux2017).
Computer tomography
Nowadays, DEXA seems to offer the largest potential to contribute to the precision nutrition of farm animals in the short term because it can provide instant whole-body composition (Scholz et al., Reference Scholz, Bunger, Kongsro, Baulain and Mitchell2015). At present, computer tomography is not used on live animals because of health and ethical concerns, lack of image processing methods to analyse images from moving bodies required for commercial applications, the time required for the computer tomography scans and high cost. However, with technological advances in software and hardware, X-ray computer tomography could become advantageous due to its higher accuracy, high anatomical resolution and delivery of 3D information with the potential to measure the volume and density of internal organs, tissues or body parts. This could include, for example, the volume and composition of the gastrointestinal tract and the liver, as well as muscle, bone and fat depots and distribution. These could have huge potential applications in animal nutrition if, for example, this technology is implemented in abattoirs and the data obtained on individual animals feeds back to livestock producers or managers.
Methane, ammonia and volatile compounds
A large body of research has been done in the last 25 years to quantify and mitigate methane emissions from ruminants particularly using nutritional strategies. In addition, methane emissions have been linked to residual feed intake, and more importantly, it is a heritable trait allowing genetic selection (Hegarty et al., Reference Hegarty, Goopy, Herd and McCorkell2007).
Novel methods to measure methane emissions from ruminants have been researched including open circuit Fourier-Transformed IR technology and micrometeorological techniques for groups of animals (McGinn et al., Reference McGinn2013), breath analysers (sniffers) mounted in an enclosure at the water point or feeders (Hegarty, Reference Hegarty2013) or handheld lasers pointed at 1 m from the mouth and nostrils in housed conditions (Ricci et al., Reference Ricci, Chagunda, Rooke, Houdijk, Duthie, Hyslop, Roehe and Waterhouse2014; Sorg et al., Reference Sorg, Muhlbach, Rosner, Kuhla, Derno, Meese, Schwarm, Kreuzer and Swalve2017). Ricci et al. (Reference Ricci, Chagunda, Rooke, Houdijk, Duthie, Hyslop, Roehe and Waterhouse2014) used a handheld device to measure CH4 concentration of exhaled breath from ewes and steers. The study was able to detect higher concentration of CH4 in steers fed a high-forage diet compared with those fed a high-concentrate diet, and differences between cattle genotypes, time after feeding and feeding level. Some challenges have yet to be overcome to quantify daily methane production from these sensors, which include developing methods to measure the volume of gas exhaled from animals per unit of time, and methods to estimate the mixing ratio of exhaled breath with ambient air (which depends on wind speed) because tracer gas markers are not used. These laser methane detectors are becoming smaller in size and are connected to mobile phones (Sorg et al., Reference Sorg, Muhlbach, Rosner, Kuhla, Derno, Meese, Schwarm, Kreuzer and Swalve2017) and could, therefore, become of benefit to the livestock industries.
The ‘sniffer’ technique implemented at a feed or water point attended by cattle can be used to obtain samples of exhaled air for short periods of time during the day for many animals in both grazing and intensive feeding on farms (Hegarty, Reference Hegarty2013). The GreenFeed instrument (C-Lock Inc., Rapid City, SD, USA) has the ability to measure CH4, CO2, H2, O2 and H2S simultaneously, which has multiple applications in animal nutrition ranging from nutritional responses to diet formulation and feed additives to improve feed efficiency and reduce CH4, or aid genetic selection of animals with lower emissions, O2 consumption to estimate energy expenditure and manage sulphur-induced polioencephalomalacia in cattle. Another advantage of the GreenFeed system is the ability to control the amount of feed supplement each animal consumes. However, the main limitation is the need for multiple short-term measures within a day to obtain reliable estimations of daily emissions (Hegarty, Reference Hegarty2013). This ‘sniffer’ technique can be adapted to the concept of ‘electronic noses’ used in other industries, such as health and implemented with sensors to measure a range of volatile organic compounds from breath (Spinhirne et al., Reference Spinhirne, Koziel and Chirase2004) which could be used as biomarkers of nutritional processes.
Heart rate and energy expenditure
Heart rate can be used to determine metabolic rate, heat production and energy expenditure of physical activities in animals (Brosh, Reference Brosh2007). Heart rate is closely associated with O2 consumption and therefore with energy expenditure or heat production because each heartbeat transfers O2 to the tissues. However, a large variability among individual animals exists for such relationship (O2 consumption per heartbeat) which requires measuring O2 consumption for individuals often for a period of at least 10 to 15 min (Brosh et al., Reference Brosh, Henkin, Ungar, Dolev, Orlov, Yehuda and Aharoni2006). In ruminants, heart rate and energy expenditure (heat production) were found to be closely correlated with metabolic energy intake (Brosh, Reference Brosh2007). Thus, metabolisable energy intake could be estimated from energy expenditure measured using the heart rate method and measuring energy retained in body tissues and milk. The opposite calculation could also be made. It was also suggested that this technology could become a tool to monitor changes in the energy balance and status of animals. Heart rate depends on physical activity and thus the energy cost of each activity can be measured using technologies to measure animal behaviour such as GNSS and accelerometers (Brosh et al., Reference Brosh, Henkin, Ungar, Dolev, Orlov, Yehuda and Aharoni2006). These authors reported that heart rate, grazing time, distance travelled and metabolisable energy intake were greatest in lactating cows during the spring (Brosh, 2007).
With the advancement of sensor technologies, measuring heart rate in many animals at low cost will be possible. For example, technologies have been developed to measure both heart rate and respiration rate in humans from image analysis in smartphones (Nam et al., Reference Nam, Kong, Reyes, Reljin and Chon2016) and using subcutaneously implantable heart rate monitors or face masks in cattle (Brosh, Reference Brosh2007).
Simulation modelling: the role of ruminant nutrition models
For about 80 years, decision support systems have been evolving alongside advances in computer processing and, concomitantly, simulation models have developed as scientific research progresses and data acquisition increases. This combination of technologies requires increased processing capacity and numerical integrations as well as changes in paradigms, so new concepts and ideas are formed. Despite the tremendous potential of using decision support systems in agriculture, Tedeschi and Fox (Reference Tedeschi and Fox2018) suggest that simulation modelling is underutilised, likely due to the lack of awareness by the users, their familiarity with the technology, lack of reliability, the divorce batten research and practice in decision support systems development or their combinations. However, most of these limitations are likely to disappear if the use of decision support systems can be automatised with the use of data from sensor technologies.
Although producers have struggled with the adoption of simulation models, the science of data acquisition and computer modelling have advanced in many aspects. In the cattle feedlot industry, for instance, growth models have been used to predict feed intake and days on feed, that is the number of days that take an animal to reach the desired carcass endpoint regarding weight, meat yield and quality (Tedeschi et al., Reference Tedeschi, Fox and Guiroy2004). With the advancements in the identification of single nucleotide polymorphism panels, specific molecular breeding values have been computed for relevant traits for the beef cattle industry. The integration of nutrition models and genomics has been conceptualised and reported to improve the predictability of deposition of carcass fat and protein in growing cattle (Tedeschi, Reference Tedeschi2015). In addition, new sensor technologies show great potential to inform both animal nutrition models and genetic predictions, as these can facilitate the collection of phenotypic data (Greenwood et al., Reference Greenwood, Bishop-Hurley, Gonzalez and Ingham2016), and increase their accuracy such as in the case of X-ray body scanners for automated measurements of carcass composition and yield (Scholz et al., Reference Scholz, Bunger, Kongsro, Baulain and Mitchell2015). Thus, data from sensor technologies could be integrated with both animal nutrition models and genetic information for optimised animal feeding and improve the management of genetic×environment (feeding management) interactions.
However, there is a chronic lack of integration, and many models are viewed as poorly coupled and difficult to incorporate (Janssen et al., Reference Janssen, Porter, Moore, Athanasiadis, Foster, Jones and Antle2017). Nonetheless, a holistic approach to integrating animal-pasture-soil-climate mathematical models has been proposed (Snow et al., Reference Snow, Rotz, Moore, Martin-Clouaire, Johnson, Hutchings and Eckard2014) alongside the advancements in data collection using NIRS, GNSS, accelerometers, 3D cameras, LiDAR, satellite and unmanned vehicles (i.e. drones) to name a few. An additional challenge to crop and pasture growth models arises from the inclusion of ruminant animals because they represent an additional trophic level, adding a considerable complexity of nutrients flow across the compartments (Snow et al., Reference Snow, Rotz, Moore, Martin-Clouaire, Johnson, Hutchings and Eckard2014). However, simulation models may become increasingly important in forecasting the production of alternative scenarios and to support the ‘smart farming technology’ of the future.
Data fusion and model-data fusion
Data fusion is an approach where data coming from multiple sources (e.g. multiple sensors) are ‘fused’ or integrated to produce new data which improve the usefulness and accuracy of the information above that from the individual sources. This approach usually uses ‘data-driven statistical’ methods such as machine learning techniques for predictive modelling, which do not necessarily consider biological mechanisms as it is the case with mechanistic models. An example of data fusion applied to livestock production was recently presented by Deng et al. (Reference Deng, Gibson and Wang2017), who assessed factors affecting the interaction between net primary productivity of grasslands from satellite imagery and livestock production with predictors being livestock density, weather and the effect of nature reserves. The authors reported that grassland net primary productivity and livestock production have a positive effect on each other and quantified the effect of weather and nature reserves on both. A simple example of data fusion would be using feed intake, LW and growth rate data to calculate feed efficiency.
Model-data fusion is an approach to combine multiple data streams with mathematical prediction models to constrain model predictions (outcomes), model parameters (e.g. rate constants) and sensitivity of the drivers of processes in the models (Wang et al., Reference Wang, Trudinger and Enting2009). The model-data approach has been used to estimate ecosystem-level carbon fluxes constraining parameters and projections of mechanistic models to match observed data (Wang et al., 2009; Keenan et al., Reference Keenan, Davidson, Moffat, Munger and Richardson2012). In the context of precision nutrition of herbivores, sensor technologies can provide data in real-time to nutrition simulation models describing particular nutritional mechanisms. Mechanistic nutrition models are suitable for this approach because numerous nutritional mechanisms or biological processes where sensor data can fit in can be described. However, empirical models can also be of value as these can estimate the optimal animal response with changing nutrition levels.
The advantage of simulation models running with input data provided by sensor technologies is the potential to improve the accuracy and precision of predictions with reduced uncertainty based on past and present information which should also improve predictions into the future. Real-time predictions of outcomes that are not measured and forecasting future outcomes are of interest because these allow timely and accurate decisions to improve animal nutrition. Both real-time predictions (now-casting) and forecasting could be of value for precision nutrition of herbivores and livestock production in this context.
Another advantage of model-data fusion is that predictions can be based on measured current conditions of individual animals, feed, paddocks and climate using real-time data provided by sensors. Therefore, model predictions or model parameters can be constantly adjusted with objective data (Wang et al., 2009). Nevertheless, little research exists to support the view that this approach may improve accuracy and precision of predictions. A challenge of this approach is that most of the research used to develop existing nutrition simulation models collected data using different means and, thus, are often at lower temporal and spatial scales. Thus, these models may not be accurate using sensor-derived data as input and must eventually go through re-evaluation and re-engineering. For instance, LW and ADG data collected at high frequency using in-paddock weighing systems show high variability within and between days due to several factors including fill of the gastrointestinal tract due to feed and water intake, defecation and urination (González et al., Reference González, Bishop-Hurley, Henry and Charmley2014a). However, most nutrition simulation models were developed with LW and growth rate data from animals being weighed less frequent and do not account for those factors affecting LW and ADG at finer temporal scales. Therefore, the model-data fusion approach may require new mathematical prediction models to be developed from (new) empirical research data collected in the conditions to which they will be applied.
Examples of model-data fusion
González et al. (2014b) used LW and ADG data collected at high frequency from individual animals using in-paddock weighing systems and DM digestibility through fNIRS to inform mathematical models that predicted feed intake and methane emissions on a daily basis (Figure 3). This approach could take advantage of the synergy between remotely-collected data and prediction models, and has the potential to improve the accuracy of model predictions. None of the measured variables followed a linear trend over time and therefore predicted DM intake and methane emissions using daily LW information are likely to be more accurate compared with using less frequent information. In addition, the ability to capture the growth path of individual animals over time could yield more accurate predictions of feed intake and methane emissions (González et al., 2014b). Automatic weighing of animals has also been used along mathematical models to estimate energy balance and body composition of dairy cows using real-time data as input of prediction models (Thorup et al., Reference Thorup, Hojsgaard, Weisbjerg and Friggens2013).
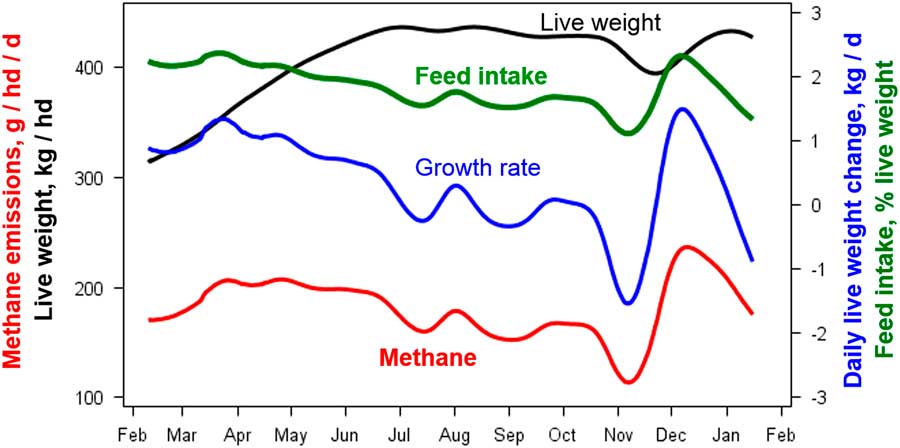
Figure 3 Model-predicted feed intake and methane emissions from measured live weight and growth rate data collected by in-paddock automatic weighing systems, and diet quality (dry matter digestibility and CP) measured using faecal NIRS in beef cattle. Adapted from González et al. (2014b).
Another good example of the potential of model-data fusion can be built on the approach presented by Brosh (Reference Brosh2007) who quantified the components of the energy balance equation (metabolisable energy intake=energy expenditure + retained energy) using GNSS and accelerometers, heart rate monitors and breath analysers. The authors proposed calculating fasting energy expenditure, heat increment due to physical activity and retained energy, energy efficiency and metabolisable energy for maintenance (Brosh, Reference Brosh, Henkin, Ungar, Dolev, Orlov, Yehuda and Aharoni2007). The authors also suggested that feed efficiency could be calculated from energy expenditure measured using the heart rate method and energy retained body tissues and excreted in milk without measuring intake. However, this approach may not properly account for differences in feed digestibility and methane emissions that characterise efficient animals (Hegarty, Reference Hegarty2013), diet selection or sorting and the composition of weight gain which affect feed conversion efficiency although these can be modelled and measured nowadays.
Precision animal nutrition: potential gains with automatic control of animal nutrition
The greatest gains from the application of precision animal nutrition are likely to come from management actions targeted to reduce variability over time and between animals in a group, and optimising these for individuals and groups for specific objectives. In addition to improving animal nutrition, technologies can optimise the management of animals such as the timely sale of animals at their optimum nutritional status (product yield and quality) or before the negative consequences of undernutrition occur, due for example to decline in forage availability. In the example in Figure 3, adapted from González et al. (2014b), selling the animals at the start of the dry season in July, as soon as they lost weight for their first time, would have resulted in similar kg of LW sales, reduced feed intake by 122% and reduced methane emissions by 105% compared with selling them in January of the following year. However, forecasting the results would require the incorporation of weather forecasts or different climate scenarios with their respective probabilities to predict pasture growth because this will affect the future nutritional status of animals.
An example of the application of precision nutrition to manage temporal variability in nutrient intake with timely and accurate nutritional interventions in grazing animals is shown in Figure 4, using data from González et al. (2014b). Temporal variability in the nutritional status appears when the dry season sets in July (climate variability), leading to reduced nutrient intake and eventually weight loss. The amount of hay required (70% DM digestibility and 20% CP) to avoid LW loss was estimated using the simulation nutrition model published by CSIRO (2007). Live weight and ADG were used as input of the model to predict energy balance using the model-data fusion approach. The amount of supplementary feed required to maintain LW changes from day to day depending on the amount of weight loss reflecting the quality and quantity of grass available in the paddock (Figure 4). This real-time information can be used to better define the start and finish times of feed supplementation of grazing animals in a timely fashion and to deliver with more precision the amount of feed required for a target production level on a daily basis according to observed trends in LW. This could reduce the cost of feeding and environmental footprint, and improve animal health and welfare.
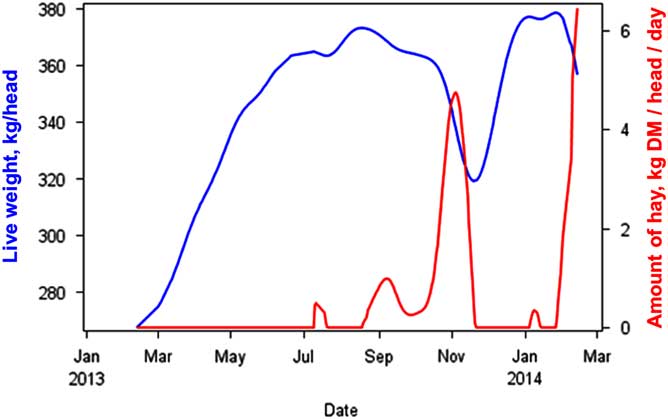
Figure 4 Model-predicted amount of hay (70% digestibility; 20% CP) required per day to maintain live weight of grazing steers (González et al., Reference González, Bishop-Hurley, Handcock and Crossman2014a,b, unpublished data). Live weight and growth rate were measured with an in-paddock remote weighing system and used by a mathematical prediction model to estimate energy balance on a daily basis.
Precision animal nutrition in the last few years has focussed on managing the nutrition of individual animals within a group and reducing the variability of nutrient intake between animals for a target production level. The trajectory of LW and growth rate of individual animals in a group shown in Figure 2 indicate that individual animals respond in different ways over time to prevailing nutritional scenarios. Not only some animals grew faster than others, but there were periods when some animals were gaining whereas others were losing weight whilst on the same nutritional regime. An auto-drafter coupled with the weighing station may allow drafting animals just after weighing into different groups which could be fed different types and amounts of feeds according to their nutritional status (growth rate and body condition), physiological status (stage of lactation and gestation), target production level and production potential. Auto-drafters could improve the nutritional management of subgroups of animals within a group controlling the access of individual animals to different feed types. However, further gains could be realised with automatic control of nutrient intake of individual animals using electronic feeders that control the amount fed to each animal.
However, research on individualised feeding in dairy cattle has yielded inconclusive results (Hills et al., Reference Hills, Wales, Dunshea, Garcia and Roche2015) and little research exists on the topic for other ruminant production systems, including beef cattle and sheep. Several reasons could explain the discrepancy between previous studies with individualised feeding which renders the practice uncertain. Key to its success is to consider the key nutritional processes and flow of nutrients in individual animals (Figure 1) in addition to their production potential. For example, nutrient requirements of individual animals and responses to individualised feeding in dairy cattle should not only consider current nutrient intake, production potential and stage of lactation, but also LW and growth rate, and previous feeding and growth. A response in milk production with increased feed supplementation may not be observed if the nutrients are re-directed to recover body condition and reproductive function. Furthermore, individualised feeding may also need to consider the composition of body growth (fat and muscle percentage of gain), because this will affect nutrient requirements and responses. Luckily, several of these key factors can be measured or predicted for individual animals in real-time using mechanistic models (Tedeschi et al., Reference Tedeschi, Fox and Guiroy2004) and new technologies such as milk metres, auto-weighing systems and emerging body scanners for body composition are being or have been developed. Individualised feeding should also consider the genetic potential of animals for production incorporating simple to more complex quantitative or molecular genetic information. Simple genetic information to consider include, for example, breed type and percentage of each breed in crossbreeds, as well as breeding values for weight at maturity and weaning weight, milk production and mothering ability, amongst others. These factors influence the production potential and composition of the products such as fat content of milk or body growth and, inevitable, affect nutrient requirements and retained. This has often been the missing link in previous research with individualised feeding.
Other complex genetic traits could be considered for precise nutrition of individuals such residual feed intake and genetics × environment (e.g. robustness) interactions which could affect individual’s responses to the same nutritional intervention. These could be a result of large differences between animals in intake, absorption, metabolisability, utilisation and retention of nutrients. Some of these processes may be difficult to monitor and predict with nutrition models. Therefore, accounting for these and other factors in which lead to varying nutritional status between animals in a group may not be possible. Different approaches may be required in these circumstances, and those which do not rely on the biological mechanisms involved in the response may be of value. These include data fusion, machine learning and optimisation techniques that are purely data-driven focussing on the pattern of input data and responses within an animal under different conditions, although it could also consider the rest of the animals under the same conditions. For example, the growth response of an animal to a particular type and amount of feed provided during a period of undernutrition (as shown in Figure 2) could differ markedly from others. Statistical techniques could learn from the data collected by auto-weighing systems (response) and electronic feeders (input) to tailor the nutritional management to that animal at different stages of production, physiological status and seasons. Furthermore, this approach could also consider changing prices of inputs and value of products, or even other responses such as greenhouse emissions to find optimal solutions.
Conclusions
The wide range of sensor technologies and analytical techniques presently available and currently being developed allow the gathering of the large amount and valuable information to improve the precision of the nutritional management of herbivores. Multiple nutritional aspects and processes involved in the flow of nutrients in the animal body can be monitored in near real-time using sensor technologies including factors affecting nutrient intake, requirements, availability, utilisation, retention and excretion. These technologies can remotely measure available feed, animal behaviour, feed digestion processes, milk yield and composition, LW and growth rate, body composition, nutrient excretion and physiological state. Thus, a comprehensive understanding can be obtained on the current nutritional status and trends of individual animals in real-time and into the future.
However, only a handful of technologies are most often integrated to measure specific products or processes to answer specific questions or for particular applications. Simulation models can complement and enhance the data collected by sensors and vice versa. Such models could be particularly important to predict hard-to-measure nutritional factors and processes such as feed intake of grazing animals, and to fill in gaps of data collected by sensors. There is a need to better exploit the synergies between sensor technologies and nutrition simulation models. This will also require evaluating the accuracy of the data provided by sensor technologies and of mathematical nutrition models intended for this application. Furthermore, such integration of sensor data and models will require more research to determine the most accurate and efficient integration approach, and perhaps a re-evaluation of traditional simulation models and empirical data of nutritional processes to suit the model-data fusion approach. This approach has the potential to improve the precision of nutritional management of herbivores to improve productivity, profitability, the efficiency of resource utilisation, animal health and welfare and reduce the environmental footprint and uncertainty of decision making.
Acknowledgements
The authors acknowledge the assistance of Paul and Jeannette Lipscombe for their efforts with animal and farm management, and the authors and co-authors of previous publications and research projects used in the present review.
Declaration of interest
The authors declare no conflict of interest.
Ethics statement
Previously unpublished data of the present review were collected under the Institutional Animal Ethics Committee of the University of Sydney approval # 615.
Software and data repository resources
No software or data are published.


