


Introduction
Epidemiological evidence suggests that sleep disorders are associated with adverse health conditions(Reference Castro-Diehl, Wood and Redline1). According to the National Sleep Foundation, a duration of 7–9 h of sleep are necessary for optimal health in adults (26–64 years of age)(Reference Hirshkowitz, Whiton and Albert2). Less than 6 h is insufficient and has been associated with obesity(Reference Wu, Zhai and Zhang3), hypertension(Reference Stranges, Dorn and Cappuccio4), type 2 diabetes(Reference Chaput, Després and Bouchard5), cardiovascular disease (CVD)(Reference Cappuccio, Cooper and D'elia6) and all-cause mortality(Reference Cappuccio, D'Elia and Strazzullo7).
Insomnia is one of the most common sleep disorders. It is characterised by difficulty initiating or maintaining sleep, premature awakening and non-restorative sleep(Reference Roth8), accompanied by negative daytime consequences in social, occupational and behavioural performance as well as in other important life functions. These symptoms have been associated with mortality(Reference Parthasarathy, Vasquez and Halonen9,Reference Lallukka, Podlipskytė and Sivertsen10) , CVD(Reference Sofi, Cesari and Casini11) and injury(Reference Laugsand, Strand and Vatten12).
Obstructive sleep apnoea (OSA), another prevalent sleep disorder, is defined by repetitive episodes of apnoea (cessation of inspiratory airflow during sleep which lasts ≥10 s) or hypopnoea (a reduction of ≥30 % in inspiratory airflow lasting ≥10 s, with an associated drop in oxygen saturation or arousal from sleep)(Reference Tietjens, Claman and Kezirian13). This condition has been associated with many different forms of CVD including hypertension, stroke, heart failure, coronary artery disease and atrial fibrillation. Adults with OSA face not only an increased risk of developing comorbid CVD but also worse CVD-related outcomes(Reference Shahar, Whitney and Redline14).
One of the primary symptoms associated with sleep disorders is excessive daytime sleepiness (EDS)(Reference Slater and Steier15). This condition reduces performance in school(Reference Gaultney16) or at work(Reference Haavisto, Porkka-Heiskanen and Hublin17,Reference Uehli, Mehta and Miedinger18) due to concentration, memory and mood problems(Reference Guilleminault19).
Given their role in adverse health outcomes, the causes of sleep disorders have been studied from various perspectives, including through diet. It has been reported that adequate sleep is positively associated with a healthy diet in children(Reference Moreira, Santos and Padrão20), adolescents(Reference Chen, Wang and Jeng21–Reference Westerlund, Ray and Roos23) and adults(Reference Imaki, Hatanaka and Ogawa24–Reference Shi, McEvoy and Luu26). Conversely, individuals with insufficient sleep duration are more likely to have lower-quality diets and adopt irregular meal patterns. They tend to consume more energy-rich foods, calories, fats, refined carbohydrates and snacks, and fewer proteins, fruits and vegetables(Reference Peuhkuri, Sihvola and Korpela27,Reference Yu, Shi and Lv28) .
A study of Japanese workers found that a healthy dietary pattern (characterised by vegetables, mushrooms, potatoes, seaweed, soya products and eggs) was associated with a decreased risk of difficulty initiating sleep(Reference Kurotani, Kochi and Nanri29). By contrast, a high intake of processed meat, red meat, snacks and take-out food was positively associated with the apnoea–hypopnoea index score after adjusting for demographic and lifestyle factors. Another study in Australia found that those who slept less time exhibited higher energy intake, especially from snacks and foods containing fat(Reference Cao, Taylor and Wittert30).
Among middle-aged female Japanese workers, low protein intake was shown to be associated with difficulty initiating sleep, while high protein and low carbohydrate intake were associated with difficulty maintaining sleep(Reference Tanaka, Yatsuya and Uemura31), and high carbohydrate intake with poor sleep quality(Reference Katagiri, Asakura and Kobayashi32).
Few reports exist which document sleep disorders in Mexico, and those published only take place in Mexico City(Reference Bouscoulet, Vázquez-García and Muiño33,Reference Jiménez-Genchi and Caraveo-Anduaga34) or with elderly participants(Reference Moreno-Tamayo, Manrique-Espinoza and Ortiz-Barrios35). The 2016 National Health and Nutrition Survey was the first study to reveal a high prevalence of multiple sleep disorders in the Mexican adult population: 28⋅4 % reported short sleep duration (<7 h), 18⋅8 % reported insomnia and 27⋅3 % showed high risk for OSA(Reference Guerrero-Zúñiga, Gaona-Pineda and Cuevas-Nasu36). Furthermore, few studies have related diet with sleep disorders in Mexican adults. In one adolescent cohort, consumption of a healthy plant-based and lean protein dietary pattern was associated with an earlier bedtime, as assessed 2 years later(Reference Jansen, Baylin and Cantoral37). In one cohort of female teachers, a fruit and vegetable-based dietary pattern was associated with greater sleep quality(Reference Jansen, Stern and Monge38). Given the documented relationship between sleep alterations and adverse health outcomes, the aim of the present study was to analyse the association between dietary patterns and sleep disorders in Mexican adults (age 20–59) based on data from a nationally representative survey.
Methods
The 2016 National Health and Nutrition Survey (in Spanish, ENSANUT-2016) is a cross-sectional survey with a probabilistic and multistage sampling design. The data collected allows statistical inferences regarding health and nutrition in the Mexican population at the national, geographical region and urban/rural area levels(Reference Romero-Martínez, Shamah-Levy and Cuevas-Nasu39). We analysed a sample of adults aged 20–59 through information regarding sleep and dietary habits.
Sleep disorders
The ENSANUT-2016 surveyed a sample of the Mexican adult population aged ≥20 using the Berlin questionnaire on OSA risk, sleep duration, insomnia and EDS(Reference Guerrero-Zúñiga, Gaona-Pineda and Cuevas-Nasu36). Average sleep duration over the 6 months before interview date was categorised as: <7 h, 7–9 h and >9 h(Reference Watson, Badr and Belenky40). Insomnia was defined as waking up prematurely or experiencing difficulty initiating or maintaining sleep ≥3–4 times per week within the last 3 weeks(41). Daytime symptoms were defined as the perception of not feeling rested or feeling sleepy/tired during the day ≥3 d/week.
Participants with affirmative scores in two or more of the following symptom categories were classified as high-risk for OSA:(Reference Netzer, Stoohs and Netzer42)
-
Category 1. Nighttime symptoms were explored through five questions, with responses assigned the following values: snoring = 1 point; snoring loud or very loud = 1 point; snoring ≥3 d/week = 1 point; snoring in a way that has annoyed others = 1 point; and another person noticing the cessation of the respondent's breathing during sleep ≥3 d/week = 2 points. An affirmative result in this category was a score of ≥2 points.
-
Category 2. Daytime sleepiness was explored through three questions, with responses assigned the following values: the perception of non-restorative sleep ≥3 d/week = 1 point, daytime tiredness ≥3 d/week = 1 point and somnolence while driving = 1 point. An affirmative result in this category was a score of 2 points.
-
Category 3. An affirmative result in this category was considered as suffering from obesity or hypertension.
Dietary intake data and dietary patterns
Dietary information was obtained from 6511 adults through a semi-quantitative food frequency questionnaire (SFFQ) on consumption during the 7 d before the survey. The SFFQ included a list of 140 foods and beverages. Consumption was estimated in grams based on the following parameters: number of days, times per day, portion size, number of portions consumed, edible portions (for meat, poultry, fruits and vegetables) and density (for beverages). Consumption data >4 sd from the mean by food or beverage item were considered implausible and those values were imputed with the average consumption by sex, urban/rural area and region (North, Centre, Mexico City and South). Participants with >7 food and beverage items with consumption imputations were excluded from analysis (n 8). Energy intake was estimated according to the nutrient database compiled by the National Institute of Public Health of Mexico (unpublished material). Energy intake requirements were estimated based on equations from the Institute of Medicine, considering sex, age, height and weight(43) and the Mifflin-St Jeor equation was used to estimate resting metabolic rate(Reference Frankenfield, Roth-Yousey and Compher44). Results showing the ratios of energy intake/energy requirement >3 sd from the average, by sex, were excluded from analysis, as were those which indicated an energy intake of less than half of the resting metabolic rate (n 161).
Foods and beverages were classified into twenty-six food groups according to their nutritional content. In addition, a separate food group included alcoholic and caffeinated beverages such as coffee and tea, due to their demonstrated relationship with sleep disorders(Reference Thakkar, Sharma and Sahota45,Reference Weibel, Lin and Landolt46) (Table 1). Dietary patterns were determined through k-means cluster analysis using the standardised percentage of contribution to energy intake of each food group(Reference Bailey, Gutschall and Mitchell47). Two to five clusters were specified within the k-means analysis in order to evaluate which set of clusters discriminated better across groups, while still maintaining an adequate sample size within each cluster.
Table 1. Food group classifications

Covariables
The following variables were drawn from a health items questionnaire: lifetime tobacco use (>100, ≤100 or 0 cigarettes)(48) and previous diagnosis of hypertension. The variables of age, sex and well-being index (WBI) were drawn from a socio-demographic questionnaire. WBI was estimated through principal component analysis based on housing characteristics (roof, wall and flooring materials; drainage; water provision) and material possessions (television, computer, radio, telephone, cable television, refrigerator, microwave, stove, boiler, washing machine). The percentage of variance explained by the first component was 40 %. WBI was categorised into tertiles, with tertile 1 being low and 3 being high.
Overweight and obesity were determined by body mass index (BMI) (weight in kilograms/height in meters2). BMI was categorised according to the cut-off points established by the World Health Organization (WHO)(49). Also in line with WHO recommendations, physical activity was estimated using the International Physical Activity Questionnaire (IPAQ) validated in the Mexican adult population(Reference Medina, Barquera and Janssen50).
Statistical analysis
We estimated proportions and means of the categorical and continuous variables, respectively, with 95 % confidence intervals (95 % CIs). Comparison among groups was performed through linear, logit or quantile regression, depending on the variable type. The Bonferroni method was applied to adjust P-value(Reference Bland and Altman51). Logistic regression models were used to assess the association between dietary patterns and each sleep disorder, and models were adjusted by age, sex, WBI, rural/urban area, geographical region, tobacco use, physical activity level, total energy intake and BMI (with the exception of the OSA logistic regression model, since obesity defined as BMI ≥30 kg/m2 is included in the classification criteria for high-risk OSA). All logistic regression models were stratified by sex. Sensitivity analyses were performed accounting for use of sedative medications. All statistical analyses were performed using STATA 14.0 with survey commands (SVY).
Results
We analysed data from 5076 adults who answered the sleep questionnaire described earlier and who indicated biologically plausible dietary intakes. The sample represented 59 251 709 Mexican adults 20–59 years old, of whom 57⋅13 % were in the 20–39 age group. A higher proportion of men had smoked >100 cigarettes in their lifetime, as compared with women (48⋅76 %; 95 % CI 45⋅06, 52⋅48 vs. 14⋅87 %; 95 % CI 12⋅50, 17⋅59). Conversely, women showed a greater prevalence of obesity, as well as hypertension, insomnia and daytime symptoms. Insomnia was reported by 16⋅57 % of the study population, and daytime symptoms by 19⋅48 %. OSA risk was identified in 26⋅22 % of the population (Table 2).
Table 2. Descriptive characteristics of Mexican adult study participants, by sex

a N (thousands) = Expansion of the sample expressed per 1000 individuals, considering survey sample weights.
b Mean and 95 % CI.
Dietary patterns
We identified three dietary patterns: traditional, industrialised and mixed. The traditional pattern yielded the highest mean intake of tortilla (42⋅75 %) and legumes (4⋅42 %). The industrialised pattern yielded the highest intake of sugar-sweetened non-dairy beverages (11⋅01 %), alcoholic beverages, coffee or tea (8⋅45 %), bakery products and cookies (7⋅37 %), fast foods (5⋅79 %), breads (5⋅58 %) and candies (1⋅32 %). The mixed pattern yielded the highest intakes of fruits (9⋅48 %), meat and poultry (8⋅51 %), vegetables (6⋅19 %), non-sugar-sweetened dairy beverages (4⋅00 %), sugar-sweetened dairy beverages (3⋅71 %) and cereal-based salty recipes (3⋅34 %) (Table 3).
Table 3. Percentage of energy intake contribution of each food group, by dietary pattern

a The corn tortilla is a staple food in traditional Mexican cooking; it is a thin, circular unleavened flatbread made of corn flour.
* Significant difference between the traditional and industrialised patterns (P < 0⋅017).
** Significant difference between the traditional and mixed patterns (P < 0⋅017).
*** Significant difference between the industrialised and mixed patterns (P < 0⋅017).
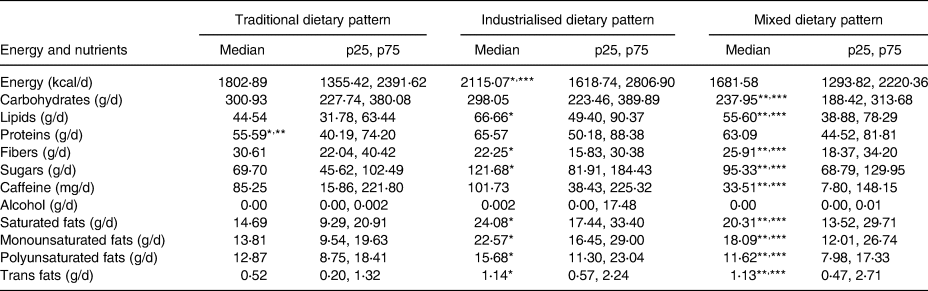
Table 4 shows that the traditional pattern had the lowest median protein intake. The industrialised pattern had the highest median intake of lipids, as well as of all specific varieties of fats and sugars, and the lowest median fibre intake. The mixed pattern showed the lowest median caffeine intake.
Table 4. Nutritional characteristics, by dietary pattern
* Significant difference between the traditional and industrialised patterns (P < 0⋅017).
** Significant difference between the traditional and mixed patterns (P < 0⋅017).
*** Significant difference between the industrialised and mixed patterns (P < 0⋅017).
Table 5 shows the distribution of participant characteristics by dietary pattern. Adults with the industrialised dietary pattern exhibited the highest energy intake and included the highest proportion of younger adults (aged 20–39), smokers (>100 cigarettes) and individuals at high risk for OSA, while showing the lowest proportion of ‘active’ individuals by physical activity level. Adults with the traditional pattern included the highest proportion of individuals living in rural areas and in southern Mexico, and of individuals in WBI tertile 1 (low). A higher proportion of adults with the traditional pattern reported sleeping 7–9 h/d and suffering less daytime symptoms, compared with the industrialised pattern.
Table 5. Descriptive characteristics of Mexican adult study participants, by dietary pattern

a Mean and 95 % CI.
* Significant difference between the traditional and industrialised patterns (P < 0⋅017).
** Significant difference between the traditional and mixed patterns (P < 0⋅017).
*** Significant difference between the industrialised and mixed patterns (P < 0⋅017).
Associations between dietary patterns and sleep disorders
Table 6 describes the associations between dietary patterns and insomnia, daytime symptoms, <7 h sleep duration and high risk for OSA (all at the national level and stratified by sex). Adults with the industrialised dietary pattern had higher odds of experiencing daytime symptoms than those with the traditional pattern (OR 1⋅49; P = 0⋅007), mainly due to an outsized effect in women. Furthermore, adults with the industrialised dietary pattern showed significantly higher odds of being at high risk for OSA (OR 1⋅63; P = 0⋅001) than those with the traditional dietary pattern, driven by a significant association in men. For women, the industrialised dietary pattern increased odds for sleep duration <7 h (OR 1⋅63; P = 0⋅04). Insomnia was not associated with any dietary pattern in this sample. Complete logistic regression models are given in Supplementary Table S1 of Supplementary material.
Table 6. Associations among dietary patterns and sleep disorders in Mexican adult study participants (Odds ratio and 95 % confidence interval)

a Adjusted by age, sex, body mass index, rural/urban area type, geographical region, physical activity level, lifetime tobacco use, tertiles of well-being index and total energy intake (kcal).
b Adjusted by age, sex, rural/urban area type, geographical region, physical activity level, lifetime tobacco use, tertiles of well-being index and total energy intake (kcal).
In the present study sample, 131 subjects reported the use of sedative medications (2⋅62 %; 95 %CI 1⋅98, 3⋅44); logistic regression models were run excluding these participants and subsequent estimations remained unchanged (data not shown).
Discussion
We identified three dietary patterns in our study population: industrialised, traditional and mixed. The industrialised pattern was defined by a high intake of food groups containing refined sugars, saturated fats and stimulant components such as caffeine and alcohol. The present results show that Mexican adults with an industrialised dietary pattern are significantly more likely to experience daytime symptoms and OSA than those with a traditional dietary pattern.
Although these associations differed in their level of significance by sex, it is important to note that the direction of the association is the same for each sex. This could be explained knowing that the most frequent sleep disorders in women are mainly daytime sleepiness(Reference Kim and Young52) and insufficient sleep time, while in men, OSA is more frequent(Reference Krishnan and Collop53). The lack of statistical significance for daytime symptoms and sleep duration (P < 0⋅05) in men could be due in part to our sample size. Notably, the industrialised pattern remained the pattern most associated with sleep disorders in both sexes.
Similar results have been obtained in other contexts. For example, a study in China revealed that the traditional dietary pattern – characterised by high intakes of wheat and other staple foods – was associated with a decreased prevalence of daytime symptoms (OR 0⋅94; 95 % CI 0⋅89, 0⋅99; P = 0⋅004) and sleep disorders(Reference Yu, Shi and Lv28). Likewise, when analysing the association between the Mediterranean diet and sleep quality, St-Onge et al. found that increased caloric intake was linked to daytime sleepiness. The high caloric intake observed by these authors may have been related to the consumption of more industrialised foods, in contrast with the Mediterranean diet(Reference St-Onge, Mikic and Pietrolungo54). Although the so-called traditional dietary patterns in these studies are not comparable in cultural terms, they share certain characteristics such as lower meat consumption and higher cereal consumption, as well as lower energy intake as compared with their counterparts.
A study in peri-menopausal Mexican women showed that those in the least-healthy dietary pattern quartile of fruit and vegetable intake, as compared with the healthiest, were 21 % more likely to report poor sleep quality at follow-up (95 % CI 1⋅06, 1⋅42). Those within the highest quartiles of the ‘modern Mexican’ pattern (tortillas and sodas, low in fibre and dairy) were 23 % more likely to report poor sleep quality as compared with the lowest quartiles (95 % CI 1⋅06, 1⋅43)(Reference Jansen, Stern and Monge38).
Finally, a study of female Japanese workers indicated that an increased intake of candies and noodles – as opposed to fish and vegetables – was associated with poor sleep quality. This may have been linked to a high carbohydrate intake(Reference Katagiri, Asakura and Kobayashi32).
A relationship between high alcohol intake and daytime symptoms was reported by Lohsoonthorn et al., who found that college students consuming ≥20 drinks/month had an OR of 3⋅10 (95 % CI 1⋅72, 5⋅59) for daytime symptoms(Reference Lohsoonthorn, Khidir and Casillas55). Furthermore, when analysing the effect of alcohol on sleep physiology in non-alcoholic adults, Roehrs and Roth observed that alcohol consumption altered sleep stages and reduced rapid eye movement sleep time(Reference Roehrs and Roth56). This may be explained by the effects of alcohol on hormonal functions related to the circadian rhythm; for instance, alcohol intake reduces the number of growth hormones. It has been documented that alcohol consumption affects specific neurotransmitters – e.g., gamma-aminobutyric acid (GABA) and acetylcholine – involved in the sleep–wake cycle. Reduced sleep quality hampers daytime alertness. A similar mechanism has been reported regarding the effect of caffeine on sleep disruption and perceived sleep quality, affecting the function of the hormone adenosine in the regulation of sleep–wake cycles(Reference Clark and Landolt57).
One study in young Mexican-American adults suggested that alcohol-use disorders are significantly associated with poorer sleep quality and that substance-use disorders may affect different aspects of sleep than do anxiety and depressive disorders(Reference Ehlers, Gilder and Criado58). In addition, a study on Mexican adolescents documented that males with a relatively older age, non-students, with more screen time, and having smoked cigarettes at any point, were associated with a later weekday sleep midpoint(Reference Jansen, Baylin and Cantoral37).
In regards to the association between dietary intake and OSA, the present results are compatible with those of Vasquez et al., where patients with OSA and a severe respiratory disturbance index score (RDI ≥ 50) showed higher intakes of cholesterol, saturated fats and trans fats(Reference Vasquez59). These types of nutrients are key components of the food groups characterising the industrialised dietary pattern. Similar results were reported in Multi-Ethnic Study of Atherosclerosis, which found that adults with moderate to severe OSA had higher dietary quality scores. This association was also found with red/processed meats and whole-grain components scores(Reference Reid, Maras and Shea60), and 6–9 % of this relationship was explained by a reduction in N3 sleep (slow-wave sleep) duration in individuals with OSA. In the present study, the industrialised pattern was characterised by a higher consumption of processed meats in contrast with the traditional and mixed patterns, as well as showing lower tortilla consumption than the traditional pattern.
Limited information is available on the biological mechanism driving the association between dietary patterns and OSA. Barceló et al. proposed a biological explanation, with the results of their study indicating higher levels of neuropeptide Y and leptin in OSA patients. Neuropeptide Y is an appetite-stimulating peptide, and the role of leptin in regulating energy balance is well-established(Reference Barceló, Barbé and Llompart61). In a laboratory-based randomised crossover study of adults aged 30–45, Shechter reported that subjects with lower N3 sleep increased fat and carbohydrate intake(Reference Shechter, O'Keeffe and Roberts62). Frank et al. proposed a relationship between sleep quality and sleep disorders, and poor dietary quality(Reference Frank, Gonzalez and Lee-Ang63). In addition, a meta-analysis of randomised clinical trials showed that sleep apnoea was improved with low-energy-intake diets, both as a unique intervention and accompanied by exercise(Reference Araghi, Chen and Jagielski64). On the other hand, it should be noted that high energy intake, as well as energy-dense or nutrient-dense foods (low in fibre and high in saturated fats and sugars) and poor dietary quality are part of unhealthy routines with multiple components which may impact sleep quality such as sleep hygiene, exercise, obesity, and smoking.
As shown in Table 4, the industrialised pattern had higher intakes of the energy, sugar and fats mentioned earlier, which reinforces the associations previously documented between these consumption habits and sleep disorders.
The present study had some limitations, among them, the cross-sectional design which did not allow the establishment of causality. Furthermore, the obtention of information through self-reporting may have led to over- or underestimation of sleep disorder prevalence, and biased results within certain food group intakes by characteristics such as BMI and sex, given that certain answers may have been perceived as socially desirable(Reference Miller, Abdel-Maksoud and Crane65). In addition, although statistical regression models were adjusted by rural/urban area type, geographical region and physical activity level, residual confusion is possible, and the effects attributed to the industrialised dietary pattern may be further linked to factors such as urban lifestyles in more developed regions, depression or stress.
On the other hand, strengths of the present study include that our sample is nationally representative, and dietary assessment was performed using a food frequency questionnaire validated in both the adolescent and adult Mexican populations which shows an acceptable correlation between consumption, energy and macronutrients intakes estimated by 24 h recalls and food frequency questionnaire(Reference Denova-Gutiérrez, Ramírez-Silva and Rodríguez-Ramírez66). In addition, the dietary pattern approach encompasses the effects of the overall diet, representing a broad picture of food and nutrient consumption and offering a more accurate way of assessing disease risk than do individual food or nutrient intakes(Reference Cespedes and Hu67,Reference Hu68) . Furthermore, the association between dietary intake and sleep disorders in the Mexican population serves to generate new hypotheses which demand further research, with the final goal of improving the diet and health of Mexican adults.
Conclusions
In conclusion, a diet high in sugar-sweetened beverages, fast foods, breads, pastries and cookies, and alcohol, coffee or tea is associated with higher odds for suffering from OSA and daytime symptoms in Mexican adults aged 20–59. It is essential to raise public awareness of the role of diet on sleep quality and health and perform further research, in order to promote evidence-based interventions aimed at achieving healthier diets in the population and preventing the negative effects, including sleep disorders, of unhealthy diets on health.
Supplementary material
The supplementary material for this article can be found at https://doi.org/10.1017/jns.2021.24.
Acknowledgements
This work was supported by the Mexican Ministry of Health. The funding body had no role in the design, analysis or drafting of this article.
E. B. G. P. contributed to conceptualisation, formal analysis and drafting. B. M. T. contributed to data cleaning and drafting. S. R. R. contributed to conceptualisation and drafting: reviewing and editing. S. G. Z. contributed to conceptualisation and formal analysis. R. P. P. contributed to data interpretation and drafting. T. S. L. contributed to securing funds and drafting: reviewing and editing.
This study was conducted according to the guidelines set by the Declaration of Helsinki, and all procedures involving human subjects were approved by the Bioethics Board of the National Institute of Public Health of Mexico. Written informed consent was obtained from all participants.
The authors declare that they have no conflicts of interest.


 Open access