


1. Introduction
The glaciers of Alaska, USA, and Yukon and northwestern British Columbia, Canada, were first estimated by Reference MeierMeier (1984) to be making the largest contribution to rising mean sea level of any glacierized region worldwide, excluding the Greenland and Antarctic ice sheets. The measurements of Reference Arendt, Echelmeyer, Harrison, Lingle and ValentineArendt and others (2002) confirmed this, and showed that this contribution is larger than previously thought. During the mid-1990s to 2000/01 these glaciers contributed 96±35 km3 a–1w.e., accounting for approximately 6–12% of observed mean sea-level rise during this period of accelerating rise. This rapid ice loss is likely attributable to the strongest land warming in the past 400 years in northern high latitudes (e.g. NRC, 2006). If global warming continues as projected by the most recent Intergovernmental Panel on Climate Change (IPCC) AR4 climate model simulations (Reference SolomonSolomon and others, in press), thinning and retreat of these glaciers, as well as of other mountain glaciers worldwide, is likely to accelerate. Thus, there is strong motivation for quantitative estimation of the probable changes in mass balance that will be caused by continued climate change.
Modeling of glacier mass balances based on meteorological data has been widely reported (e.g. Reference TangbornTangborn, 1999; Reference Schneeberger, Albrecht, Blatter, Wild and HockSchneeberger and others, 2001). Use of observational data is, of course, necessary for evaluating model performance. Model results have also been widely used. Reference Reichert, Bengtsson and OerlemansReichert and others (2001) and Reference Radić and HockRadić and Hock (2006) used general circulation model (GCM) outputs, and Reference Raper and BraithwaiteRaper and Braithwaite (2006) used both climate data and GCM outputs in their mass-balance modeling. Most of these models require temperature and precipitation data near the glacier of interest as the forcing inputs.
In the case of climate data or GCM outputs, the question of whether the global data apply on a local scale is of concern because of the coarse resolution of these data. Reference Hock, Radić and de WoulHock and others (2007) also suggested that careful calibrations of global data are needed for use in glacier mass-balance modeling. This is especially true for precipitation, which is highly dependent on local topography. Reference Serreze and HurstSerreze and Hurst (2000) found that both the National Center for Environmental Prediction/US National Centers for Atmospheric Research (NCEP/NCAR) and the European Centre for Medium-Range Weather Forecasts re-analysis data have notable errors in their precipitation fields. The glacierized regions of northwest North America and elsewhere are generally characterized by complex topography; thus the representation of complex terrain in high-resolution models is needed to accurately simulate precipitation as well as surface temperatures. A high-resolution regional model therefore seems likely to be a better choice for providing temperature and precipitation forcing for modeling glacier mass balances.
We employ a relatively high-resolution Arctic MM5 regional model for dynamical downscaling of global climate simulations to provide temperature and precipitation inputs to a precipitation–temperature–area–altitude (PTAA) glacier mass-balance model (Reference TangbornTangborn, 1999), for estimation of mass balances in a future CO2-enhanced climate. The Arctic MM5 is based on the fifth-generation Pennsylvania State University (PSU)/NCAR Mesoscale Model (MM5) (Reference Grell, Dudhia and StaufferGrell and others, 1995). It couples a thermodynamic sea-ice model (Reference Zhang and ZhangZhang and Zhang, 2001) and a mixed-layer ocean model (Reference Kantha and ClaysonKantha and Clayson, 1994). The global climate simulations used as inputs to the Arctic MM5 include NCEP/NCAR reanalysis data (Reference KistlerKistler and others, 2001) for hindcast simulations, and NCAR Community Climate System Model (CCSM3) outputs (T85) (Reference CollinsCollins and others, 2006) for forecast simulations.
The PTAA glacier mass-balance model uses the MM5-downscaled daily maximum and minimum temperatures and precipitation near the glacier of interest, in combination with the area–altitude (AA) distribution of the glacier, as input for estimation of glacier mass-balance variables. Note that glacier mass balances are also influenced by changes in glacier geometry caused by flow, in part due to the ongoing response to changes in climate prior to the period of interest (Reference Elsberg, Harrison, Echelmeyer and KrimmelElsberg and others, 2001). Such changes in geometry translate to changes in the AA profile of the glacier. The method employed in this study is analogous to the ‘reference surface’ method of mass-balance measurement described by Reference Elsberg, Harrison, Echelmeyer and KrimmelElsberg and others (2001). The mass-balance variables simulated by the PTAA model include the daily and annual accumulation and ablation balances within each altitude element of the glacier, and the net mass balance of the entire glacier for each year throughout the period of the simulation.
This atmosphere/glacier hierarchical modeling system exploits the strength of each model. In this study, we test and demonstrate the performance of this system by simulating the past and estimating the future mass balances of two distinct types of glaciers that have traditionally been considered difficult to assess for mass balance: a large tidewater glacier (Hubbard) and a large surge-type glacier (Bering). Both are located in the high St Elias and eastern Chugach Mountains of coastal south-central Alaska, USA, and adjacent Yukon, Canada.
2. Hubbard and Bering Glaciers
Hubbard Glacier is selected for this modeling study because it is one of the few advancing tidewater glaciers in Alaska. Its advance has dammed Russell Fiord, near the community of Yakutat, twice during recent decades (e.g. Reference MayoMayo, 1989; Reference Trabant, Krimmel, Echelmeyer, Zirnheld and ElsbergTrabant and others, 2003). On each of these occasions the ice dam burst, releasing the backed-up waters of Russell Fjord into Disenchantment Bay without harm to human life or property. Re-formation of this ice dam, if it were longterm, could redirect the drainage of Russell Fjord southward into the Situk River drainage, with potentially damaging consequences to Yakutat’s fisheries-based economy.
From its source regions on, and northeast of, Mount Logan (5959 m), in Yukon, Hubbard Glacier descends 122km to the sea where it calves icebergs into Disenchantment Bay. Its main trunk ranges from about 3 to 7km in width; its total area, including tributaries, is 2460 km2. It has been in the advance phase of its tidewater glacier cycle (see, e.g., Reference Meier and PostMeier and Post, 1987) since it was first mapped by the International Boundary Commission in 1895 (Reference DavidsonDavidson, 1903); that is, during the post-Little Ice Age period when most glaciers throughout northwest North America and the world have been in retreat.
Elevation profile measurements along Hubbard Glacier’s central flowline were carried out in May 2000 (Reference Arendt, Echelmeyer, Harrison, Lingle and ValentineArendt and others, 2002, supporting online material), in August 2003 and in August 2005 (Reference RitchieRitchie and others, 2006) with airborne laser altimetry. Extensive, repeated two-dimensional mappings of the lower glacier, as well as repeated profiling along the central flowline, were carried out by W. Krabill’s NASA airborne scanning laser-altimetry group in August 2005, under contract to the US Army Corps of Engineers via the Cold Regions Research and Engineering Laboratory (CRREL). This work, supervised by D. Lawson (of CRREL), will provide a basis for more accurate assessments of mass balance, as well as the first accurate measurements of terminus-wide calving velocities and the forward components of the ice velocities at the terminus, as well as along the central flowline.
The surge-type Bering Glacier system, including its Bagley Ice Valley accumulation area, is located in the St Elias and eastern Chugach Mountains of south-central Alaska. Its total area, including tributaries, of about 5200 km2 slightly exceeds the almost equally large area of the Seward–Malaspina Glacier system to its east. Bering Glacier descends 100km westward from its ice divide with Seward Glacier in Yukon, incorporating ice from the summit plateau of Mount Logan (5959 m) via Quintino Sella tributary, then turns and descends an additional 80 km southwest to the Gulf of Alaska coast. Warming climate has thinned the lower Bering Glacier substantially during recent decades, and the terminus has retreated by as much as 12km since 1900 (Reference Molnia and PostMolnia and Post, 1995). Major surges in 1958–60, 1965–67 and 1993–95 (e.g. Reference Lingle, Post, Herzfeld, Molnia, Krimmel and RoushLingle and others, 1993) occurred during this period of thinning and retreat. Thickening of the Bagley Ice Valley accumulation area, measured since 1972 by Reference Muskett, Lingle, Tangborn and RabusMuskett and others (2003), is thought to reflect surge dynamics. Throughout its ablation area, however, surface lowering on Bering Glacier appears consistent with the patterns estimated by Reference Arendt, Echelmeyer, Harrison, Lingle and ValentineArendt and others (2002) for glaciers throughout Alaska, Yukon and northwest British Columbia.
In order to perform mass-balance modeling for Hubbard and Bering Glaciers with the hierarchical modeling system described here, the Arctic MM5 regional model domain is defined over northwest North America as shown in Figure 1. There are two nested domains: the mother domain has a resolution of 54 km, covering Alaska along with parts of northwestern Canada and northeastern Russia, while the nested domain has a resolution of 18km and is located over the heavily glacierized regions of Alaska and northwest Canada. This domain configuration should allow for the adequate representation of the overall synoptic environment which impacts south-central Alaska (such as low-pressure systems originating from the north Pacific and high-pressure systems from the East Siberian and Beaufort Seas), while at the same time allowing for a finer and more detailed representation of the more immediate environs of the glacierized area. A 10 year hindcast simulation was first conducted with the Arctic MM5 for the period October 1994–September 2004, forced by the NCEP/NCAR re-analysis data. For the future climate, the A1B scenario of the CCSM3 GCM simulation, a ‘middle-of-the-road’ scenario in which there is a balanced mix of fossil and non-fossil fuels, is employed to force the Arctic MM5 for a forecast simulation extending from October 2010 to September 2018.

Fig. 1. Arctic MM5 model domain configuration consisting of a mother domain at 54 km resolution and a nested domain at 18 km over the heavily glacierized regions of Alaska (top panel). The lower panel displays land-cover types in the nested child domain with land ice shown in white. The locations of Hubbard and Bering Glaciers and the Yakutat meteorological station are marked with grey dots.
3. Results
3.1. MM5 downscalings
The MM5-downscaled daily maximum and minimum temperatures and precipitation were first verified against surface observations. The PTAA model was developed to use daily temperatures and precipitation at low-altitude weather stations near the glacier of interest as inputs. In this study, observations from the weather stations at Yakutat, Cordova, Juneau and Sitka were used to model Hubbard and Bering Glaciers. The MM5-downscaled temperatures and precipitation at the 18 km fine-scale model resolution were interpolated to the locations of these stations with the Cressman interpolation technique (Reference CressmanCressman, 1959 mo), taking the land type and elevation information into account. The weather stations are located on land, so water and land-ice gridpoints were excluded from the interpolation. The elevation limits were set to exclude gridpoints with elevations higher or lower than the station elevation by 100 m from the interpolation, since interpolated values show much more sensitivity to elevation than to horizontal distance.
The interpolated MM5-downscaled data and the observed station data refer to different local conditions and elevations, so the differences between them for the Yakutat, Cordova, Juneau and Sitka stations over the 10 year simulation period were analyzed in order to estimate the model bias and adjust the MM5-downscaled results accordingly. Systematic biases exist in the MM5-downscaled temperatures for all stations.
There is a warm bias in daily minimum temperatures and a cold bias in daily maximum temperatures. This is probably due to too-high elevation (80–90 m) in the interpolated data relative to the actual station elevations at Yakutat (9 m), Cordova (9 m), Juneau (4 m) and Sitka (5 m), as well as the land surface treatment in the MM5 model. The MM5 overestimates the precipitation at Cordova, Juneau and Sitka and underestimates the precipitation at Yakutat for nearly all seasons. The model biases have an evident seasonal cycle, so mean monthly biases for minimum and maximum temperatures and precipitation were calculated by taking the difference between the monthly averages of station data and MM5 downscalings over the entire simulation period (October 1994–September 2004). The MM5-downscaled daily minimum and maximum temperatures and daily precipitation were then corrected using:
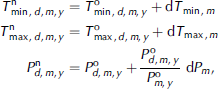
where subscripts d, m and y refer to the dth day of the mth month in the yth year, superscripts n and o represent corrected and uncorrected variables, respectively, ![]() and
and ![]() are daily minimum temperature,
are daily minimum temperature, ![]() and
and ![]() are daily maximum temperature,
are daily maximum temperature, ![]() and
and ![]() refer to daily precipitation,
refer to daily precipitation, ![]() is monthly precipitation, and
is monthly precipitation, and ![]() are 10 year averaged monthly biases of minimum temperature, maximum temperatures and precipitation for the mth month, respectively.
are 10 year averaged monthly biases of minimum temperature, maximum temperatures and precipitation for the mth month, respectively.
Note that the mean monthly precipitation bias dPm
was distributed over the daily precipitation ![]() with the weighting function
with the weighting function ![]() , the ratio of daily to monthly precipitation. Therefore, if there is little (much) rain on a given day, a smaller (larger) correction will be applied.
, the ratio of daily to monthly precipitation. Therefore, if there is little (much) rain on a given day, a smaller (larger) correction will be applied.
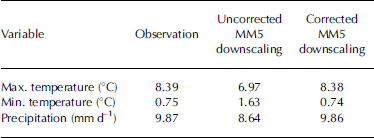
As an example, the corrected 10 year averaged daily temperature and precipitation (Equations (1)) for Yakutat and comparisons with the observations are shown in Figure 2. The corrected Arctic MM5 temperatures match the observations very well in both their seasonal cycle and seasonal variability. The corrected MM5 precipitation also shows reasonable agreement with the observations. A quantitative comparison of 10 year averaged temperature and precipitation at Yakutat for observed station data, uncorrected MM5 downscalings and corrected MM5 downscalings (Table 1) shows that the biases between the observed station data and MM5 downscalings have been significantly reduced by this correction method.

Fig. 2. Observed (dots) and MM5-downscaled (solid line) daily mean temperature (a) and daily precipitation (b) at Yakutat, averaged from October 1994 to September 2004.
Table 1. 10 year average of daily maximum and minimum temperatures and precipitation at Yakutat, south-central Alaska coast
3.2. Simulation of Hubbard and Bering Glacier mass balances: 1994–2004
3.2.1. Hubbard Glacier
The PTAA model, unlike other mass-balance models, computes the mass-balance variables within each element of altitude in the AA profile of the glacier for each day of the year. This model has been tested with observed forcing inputs on several well-measured glaciers in northwest North America and the Himalaya, and has produced mass-balance hindcasts which compare favorably with the observed mass balances (Reference TangbornTangborn, 1997, Reference Tangborn1999; Reference Tangborn and RanaTangborn and Rana, 2000). Comparisons of the 10 year averaged mass balances vs elevation, simulated by the PTAA model for Hubbard Glacier using the MM5-downscaled and observed daily temperatures and precipitation from October 1994 to September 2004, are shown in Figure 3. The PTAA-simulated accumulation vs elevation (Fig. 3a), forced by both the MM5 downscalings and the observations, match very well. From near sea level (38 m) to about 1800 m, the accumulation on Hubbard Glacier increases almost linearly from 0.3 mw.e. to about 4mw.e. Above 1800 m, there is little change in accumulation. The ablation forced by the MM5 downscalings is somewhat less negative (less melting) than that forced by the observations (Fig. 3b), especially on the lower glacier. Above 800 m, the differences in ablation are relatively small. At the calving terminus of Hubbard Glacier (38 m), the MM5-downscaling forced ablation is around –4ma–1w.e, while the observation-forced ablation is around –5ma–1w.e. The differences are roughly 1.0mw.e. below 500 m, which is within an acceptable range considering the model uncertainties. Reference TangbornTangborn (1999) calibrated the PTAA model (forced by the observations) with measurements for South Cascade Glacier and demonstrated that PTAA-simulated accumulation generally agreed with the distribution and amount measured on the glacier, but simulated ablation was 0.35 mw.e. more negative than the measurements for the whole glacier. When calibrating the PTAA model for Gulkana Glacier, the simulated ablation was 0.33 mw.e. more positive than the measurements for the whole glacier and about 1 m different from the measurements at the terminus. The PTAA-simulated ablation on Hubbard Glacier is very small (less negative than –0.5mw.e.) above 2000 m. The net balance is the sum of accumulation and ablation. As a result, the PTAA-simulated net balances (Fig. 3c) forced by the MM5 downscalings and the observations are very similar on the upper glacier, while the differences on the lower glacier are primarily attributed to the differences in ablation.

Fig. 3. Hubbard Glacier mass-balance profiles ((a) accumulation; (b) ablation; and (c) net balance) simulated by the PTAA mass-balance model using MM5-downscaled (solid lines) and observed (dashed lines) temperatures and precipitation over the period 1 October 1994 to 30 September 2004.
The total mean-annual accumulation is larger than the total mean-annual ablation over the whole glacier, so the mean-annual net mass balance for the entire Hubbard Glacier, which has an accumulation-area ratio (AAR) of about 0.95, is positive. The average PTAA-simulated net balance forced by the MM5 downscalings from October 1994 to September 2004 is 2.8±2.9ma–1w.e., which compares favorably with the PTAA observation-forced net balance of 2.7 ±2.8 ma–1w.e. (The plus/minus ranges represent the standard deviations of the annual values.) The comparisons of PTAA annual net balances for the entire Hubbard Glacier, for water years (1 October–30 September) 1995–2004, forced by the MM5 downscalings and the observations, are also in reasonably good agreement (Fig. 4). Beginning in 2000, there is a notable trend toward less positive net balances; they are about 4mw.e. in 2000 and below 2 mw.e. in 2004.

Fig. 4. Hubbard Glacier: PTAA-simulated annual mass balances, not adjusted for iceberg calving, using MM5-downscaled (solid line) and observed (dashed line) temperatures and precipitation during water years (1 October–30 September) 1995–2004.
Note that mass loss from iceberg calving has not yet been included in this Hubbard Glacier simulation, so the positive PTAA mass balances (2.7ma–1 with observational data for forcing and 2.8 ma–1 with Arctic MM5 downscaled data for forcing) would be significantly reduced if calving were taken into account. Reference Trabant, Krimmel and PostTrabant and others (1991) estimated the calving flux for Hubbard Glacier at about 6.5 km3 a–1. Considering that Hubbard Glacier has an area of 2460 km2 (Reference Arendt, Echelmeyer, Harrison, Lingle and ValentineArendt and others, 2002, supporting online material), the total mass loss due to calving is about [(6.5km3 a–1/2460km2)×0.91]× 1000mkm–1 = 2.4ma–1w.e. Thus, the PTAA-simulated net mass balances with an iceberg calving flux of about 6.5 km3 a–1 taken into account become 2.7 – 2.4 = 0.3ma–1w.e with the observational data for forcing, and 2.8 – 2.4 = 0.4ma–1w.e. with the MM5-downscaled data for forcing. This is similar to the mean annual net balance of 0.10±0.13ma–1w.e. estimated for Hubbard Glacier by Reference Arendt, Echelmeyer, Harrison, Lingle and ValentineArendt and others (2002, supporting online material) from airborne laser altimetry, for the period 1959–2000.
3.2.2 Bering Glacier
The 10 year averaged mass balances vs elevation, simulated by the PTAA model using (i) the Arctic MM5 downscalings, and (ii) the observations, from 1 October 1994 to 30 September 2004, are compared in Figure 5. As in the case of Hubbard Glacier, the accumulations forced by the MM5 downscalings and the observations compare favorably (Fig. 5a). From near sea level (232 m) to about 2000 m, the accumulation on Bering Glacier increases almost linearly from 0.1 mw.e. to about 2.5 mw.e. Above 2000 m, there is little change in accumulation. Also, as in the case of Hubbard Glacier, the PTAA-simulated ablation forced by the MM5 downscalings is less negative (less melting) than that forced by the observations, especially at lower elevations (Fig. 5b). At the terminus of Bering Glacier (232 m), the MM5 downscaling-forced ablation is around –9mw.e, while the observation-forced ablation is around –10mw.e. Above 2500 m, there is almost no ablation on Bering Glacier. As a result, the PTAA-simulated net balances forced by the MM5 downscalings and the observations are very close on the upper glacier, while the differences on the lower glacier are mainly due to the differences in ablation (Fig. 5c).

Fig. 5. Same as Figure 3, but for Bering Glacier.
In contrast to Hubbard Glacier, there is strong ablation relative to accumulation over Bering Glacier as a whole, because Bering does not share Hubbard’s anomalously high AAR. Figure 6 shows that the PTAA-simulated mean annual accumulation and ablation balances on Bering Glacier, for 1 October 1994 to 30 September 2004, forced by the MM5 downscalings, compare favorably with the same PTAA-simulated mean-annual mass balances forced by the observations. The accumulation balances change little during the 10 year period, but ablation increases, particularly during the most recent 3 years. This contributes significantly to the negative net mass balance of Bering Glacier. The PTAA-simulated 10 year average net balances for the entire glacier are –1.3±2.0ma–1w.e. when forced by the Arctic MM5 downscalings and –1.7±2.2ma–1w.e. when forced by the observations. This can be compared to the –2.8±0.04ma–1w.e. mean annual net balance between 10 June 1995 and 26 August 2000 estimated by Reference Arendt, Echelmeyer, Harrison, Lingle and ValentineArendt and others (2002, supporting online material) using airborne laser altimetry. (Two profile sets were flown on Bering Glacier in 2000: the first on 19, 22 and 23 June, the second on 26 August. The 19, 22, 23 June 2000 profile set was used for comparison with the 10 June 1995 profile; that is, the –2.8ma–1w.e. mean annual mass balance was determined on a same-season basis. The 26 August 2000 profile date listed in Reference Arendt, Echelmeyer, Harrison, Lingle and ValentineArendt and others (2002, supporting online material) is an error.)

Fig. 6. Bering Glacier: PTAA-simulated annual accumulation and ablation balances using MM5-downscaled (solid lines) and observed (dashed lines) temperatures and precipitation during water years 1995–2004.
3.3. Projection of Hubbard and Bering Glacier mass balances: 2010–2018
The Arctic MM5-downscaled daily temperatures and precipitation forced by the A1B future scenario of the CCSM3 simulation were used to provide inputs to the PTAA glacier mass-balance model for projecting mass-balance changes on Hubbard and Bering Glaciers during 1 October 2010 to 30 September 2018. Biases also exist between the 20th-century CCSM3 simulations and the observed climate during the same period. Ideally, a comparison between downscaled CCSM 20th-century simulations and the observations would provide the best estimate of CCSM biases. Due to the high cost of performing additional downscaling integrations, we are currently employing an ad hoc method of correcting for CCSM biases based on the premise that the re-analysis represents the observations, until we are able to perform the needed simulations. Therefore, the 50 year (1950–99) monthly mean differences of daily maximum and minimum temperatures and daily precipitation between the CCSM3 simulations and the NCEP/NCAR re-analysis data were calculated along each latitude band in the Alaska region. Both the bias corrections derived in section 3.1 and the corrections resulting from the differences between the 20th-century CCSM3 simulations and the NCEP/NCAR re-analysis data were applied to the future CCSM3-forced MM5 downscalings. That is, the biases and bias corrections identified and applied during the past simulations were assumed to be characteristic of, and to apply during, the future time period.
The projected mass balances vs elevation for Hubbard and Bering Glaciers during 1 October 2010 to 30 September 2018 are compared with the hindcast balances (forced by the MM5 downscalings) (Fig. 7), which show that accumulation is projected to increase markedly on the higher reaches of both Hubbard and Bering Glaciers (about 1 mw.e.). This is due to increased precipitation, especially during winter under the CCSM3 A1B future climate scenario. A recent study by Reference Kattsov, Walsh, Chapman, Govorkova, Pavlova and ZhangKattsov and others (in press) compared precipitation in all the IPCC models for the entire Arctic cap, in which all the IPCC models project an increase in precipitation. The CCSM3 represents this increase well, and its projected precipitation change is within the ranges of the group of models. At low altitudes, ablation during 2010– 2018 is projected to be around –5ma–1w.e. at the terminus of Hubbard Glacier and –10.5ma–1w.e. at the terminus of Bering Glacier, decreasing slowly to almost zero on the uppermost Hubbard Glacier and at 4000m on Bering Glacier. Comparing to the hindcast results, it can be seen that increased ablation is projected, particularly on the lower Hubbard and Bering Glaciers, due primarily to increased air temperatures, especially during summer under the CCSM A1B future climate scenario.

Fig. 7. Projected (black) and hindcast (grey) mass-balance profiles (accumulation in solid lines and ablation in dashed lines) of Hubbard (a) and Bering (b) Glaciers for 1 October 2010 to 30 September 2018.
Consequently, the changes in the net balances on Hubbard and Bering Glaciers between the future projections (2010–18) and the hindcast simulations (1994–2004) have opposite signs above and below 2000 m on Hubbard Glacier and 2500 m on Bering Glacier (Fig. 8). That is, the projected balances increase above (more accumulation) but decrease below (more ablation) these altitudes. The projected mean annual net mass balances are –2.0±3.6ma–1w.e. for Bering Glacier and 2.7±3.2ma–1w.e. for Hubbard Glacier, assuming no contribution from calving for the latter. If a calving flux of about 6.5 km3 a–1 (Reference Trabant, Krimmel and PostTrabant and others, 1991) is taken into account, the projected mean annual net mass balance of Hubbard Glacier during 2010–18 becomes about 2.7 – 2.4 = 0.3 ma–1 (see section 3.2 above, regarding estimation of the calving flux contribution) (see Table 2).
Table 2. PTAA-projected mean annual net mass balances for Bering and Hubbard Glaciers (October 2010–September 2018) and their comparisons with the hindcast net balances (October 1994– September 2004). The ± ranges represent the standard deviations of the projected annual values
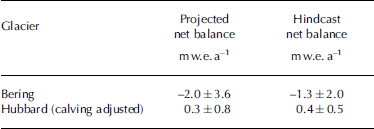

Fig. 8. Profiles of net balance differences between PTAA projections (2010–18) and PTAA hindcasts (1994–2004) with MM5 downscalings for Hubbard (a) and Bering (b) Glaciers.
3.4. Interpretation
Bering Glacier, then, is projected to thin at a significantly faster area-average rate, –2.0ma–1w.e., during 2010–18 than during 1994–2004, when the PTAA-simulated mean-annual net mass balance was –1.3ma–1w.e, while the positive mass balance of Hubbard Glacier is projected to be reduced during 2010–18 (0.3ma–1w.e. compared to 0.4 ma–1w.e. during 1994–2004) if the calving flux remains constant (Table 2). Whether the calving flux will remain constant is, of course, a significant glaciological problem in its own right, and is beyond the scope of this paper. However, the calving flux might decrease if stronger ablation occurs on the lower glacier. The differing mass-balance responses of Bering and Hubbard Glaciers, which are located in more-or-less the same climatic regime, can be attributed to their differing AARs, which, in turn, are attributable to their differing area–altitude distributions.
Bering Glacier does not share the anomalously high 0.95 AAR of Hubbard Glacier. Thus, the large future increase in ablation projected for Hubbard Glacier acts only over a relatively small ablation area. This enables Hubbard Glacier to maintain a projected positive mean-annual net mass balance during 1 Ocotber 2010 to 30 September 2018 if iceberg calving is assumed to remain constant. Note, however, that the net mass balance of Hubbard Glacier is a strong function of the iceberg calving rate at the terminus. Even a small increase in the calving rate, relative to the forward component of the ice velocity at the terminus, if sustained, appears to have potential for stopping or even reversing the present advance of Hubbard Glacier. This is because the advance rate (a small number, several tens of metres per year) is the forward ice velocity at the terminus minus the calving velocity (Reference Meier and PostMeier and Post, 1987), which are both on the order of 3–4km a–1 and very similar in magnitude.
4. Summary
The atmosphere/glacier hierarchical modeling approach described here, which exploits the strength of each model, has been developed for projection of climate-forced changes in glacier mass balances. We have verified this modeling system with 10 year hindcast simulations of the Hubbard and Bering Glacier mass balances, which have been independently estimated with airborne laser altimetry (Reference Arendt, Echelmeyer, Harrison, Lingle and ValentineArendt and others, 2002, supporting online material), by establishing a regional atmospheric modeling domain over Alaska/northwest Canada/northeast Russia that includes a nested high-resolution domain over the heavily glacierized regions of Alaska, Yukon and northwest British Columbia. The Arctic MM5 regional atmospheric model was integrated for 10 years from 1 October 1994 to 30 September 2004, forced by NCEP/NCAR re-analysis data. The MM5-downscaled daily maximum and minimum temperatures and precipitation were then interpolated to the locations of the weather stations near the glaciers. Comparisons between the MM5-downscaled daily temperatures and precipitation and the observations at the weather stations over the entire 10 year simulation period showed that the MM5 downscalings have correctable biases. The bias-reduced MM5 downscalings compare favorably to the observed temperatures and precipitation data.
The bias-reduced MM5 downscalings were then used to force the PTAA glacier mass-balance model to simulate the mass balances of Hubbard and Bering Glaciers in south-central Alaska. The PTAA-simulated mass balances forced by the MM5 downscalings were compared with the PTAA-simulated mass balances forced by the observed temperatures and precipitation. The comparisons show that this atmosphere/glacier hierarchical modeling system captures the accumulation and ablation profiles of these glaciers reasonably well, and realistically simulates their mean annual net mass balances. This evaluation of the atmosphere/glacier hierarchical modeling approach provides the groundwork for estimating future climate-forced changes in glacier mass balances.
The Arctic MM5-downscaled daily maximum and minimum temperatures and precipitation forced by the future A1B scenario of the CCSM3 simulation were then used to provide the inputs to the PTAA glacier mass-balance model for projection of mass-balance changes on Hubbard and Bering Glaciers over the period 1 October 2010 to 30 September 2018. Hubbard and Bering Glaciers are projected to have increased accumulation, particularly on the upper glaciers, and increased ablation, especially on the lower glaciers, mainly because of increased air temperatures during the summers and increased precipitation during the winters under the CO2-enhanced future climate of the CCSM3 A1B scenario. Estimates of glacier mass balance for the decades 2050–59 and 2090–99 using the modeling strategy described here are the next step of our research plan.
The mean annual net mass balance of Bering Glacier is projected to become more negative, about –2.0ma–1w.e. during 2010–18, relative to the –1.3ma–1w.e. mean annual net mass balance simulated during the 1994–2004 hindcast. The mean annual net mass balance of Hubbard Glacier is projected to become somewhat less positive, about 0.3ma–1w.e. during 2010–18, relative to the 0.4ma–1w.e. mean annual net mass balance simulated during the 1994–2004 hindcast, if the iceberg calving rate at the Hubbard ice front in Disenchantment Bay remains approximately constant.
Acknowledgements
We thank the Interdisciplinary Science in the NASA Earth Science Enterprise Program for supporting this work with grant NNG04GH64G (NRA-03-Oes-03, IDS 2003). This work was also supported, in part, by a grant of High Performance Computing (HPC) resources from the Arctic Region Supercomputing Center at the University of Alaska Fairbanks as part of the US Department of Defense HPC Modernization Program. This research uses the NCEP/NCAR re-analysis data provided by NCAR, and the CCSM A1B scenario data provided by the Community Climate System Model project (http://www.ccsm.ucar.edu), supported by the Directorate for Geosciences of the US National Science Foundation and the Office of Biological and Environmental Research of the US Department of Energy. We are grateful to C. Bitz, E. Salathe, J. Walsh and an anonymous reviewer, whose constructive comments and suggestions substantially improved the content and presentation of this paper.


