


Introduction
In recent years, large-scale healthcare systems have contemplated integrating polygenic risk scores (PRS) into clinical practice given their potential to stratify diagnostic and therapeutic strategies in common medical conditions (e.g. diabetes, cancer, obesity) (Khera et al., Reference Khera, Chaffin, Wade, Zahid, Brancale, Xia and Kathiresan2019, Reference Khera, Emdin, Drake, Natarajan, Bick, Cook and Kathiresan2016; Läll, Mägi, Morris, Metspalu, & Fischer, Reference Läll, Mägi, Morris, Metspalu and Fischer2017; Mavaddat et al., Reference Mavaddat, Michailidou, Dennis, Lush, Fachal, Lee and Easton2019; Pashayan et al., Reference Pashayan, Pharoah, Schleutker, Talala, Tammela, Määttänen and Auvinen2015; Sharp et al., Reference Sharp, Rich, Wood, Jones, Beaumont, Harrison and Oram2019) and, more recently, in psychiatric conditions (Murray et al., Reference Murray, Lin, Austin, McGrath, Hickie and Wray2021). For example, the Electronic Medical Records and Genomics (eMERGE) Network is conducting trials evaluating the impact of returning genomic results (‘return of results’ or RoR) in both clinical and research venues (Electronic Medical Records and Genomics (eMERGE) Network, n.d.; Leppig et al., Reference Leppig, Kulchak Rahm, Appelbaum, Aufox, Bland, Buchanan and Wiesner2022; Madden et al., Reference Madden, Brothers, Williams, Myers, Leppig, Clayton and Holm2022; Wiesner et al., Reference Wiesner, Kulchak Rahm, Appelbaum, Aufox, Bland, Blout and Leppig2020). Early evidence suggests that patients are in favor of being informed of their genetic test results and receiving advice about how to interpret and act on the results (Allen et al., Reference Allen, Karlson, Malspeis, Lu, Seidman and Lehmann2014; Karlson, Boutin, Hoffnagle, & Allen, Reference Karlson, Boutin, Hoffnagle and Allen2016; Pet et al., Reference Pet, Holm, Williams, Myers, Novak, Brothers and Clayton2019).
With the prospect of using PRS to guide clinical decision making, optimizing the accuracy of the risk estimates they provide becomes especially important (Polygenic Risk Score Task Force of the International Common Disease Alliance, 2021). In research settings, including biobank-based studies, genetic analyses are usually restricted to individuals who have volunteered to provide biospecimens for research investigations. More specifically, application of PRS in a biobank or other research cohort typically entails a sequence of sampling procedures (see Fig. 1a). First, the cohort is limited to participants who provided consent, and had blood samples drawn and genotyped prior to the time of analysis. Next, this subsample is further restricted to those who have passed a genomic quality control (QC) process. However, restricting analyses without considering the complexity of selection mechanism can change or induce spurious associations between factors directly or indirectly related to selection into the PRS analysis.
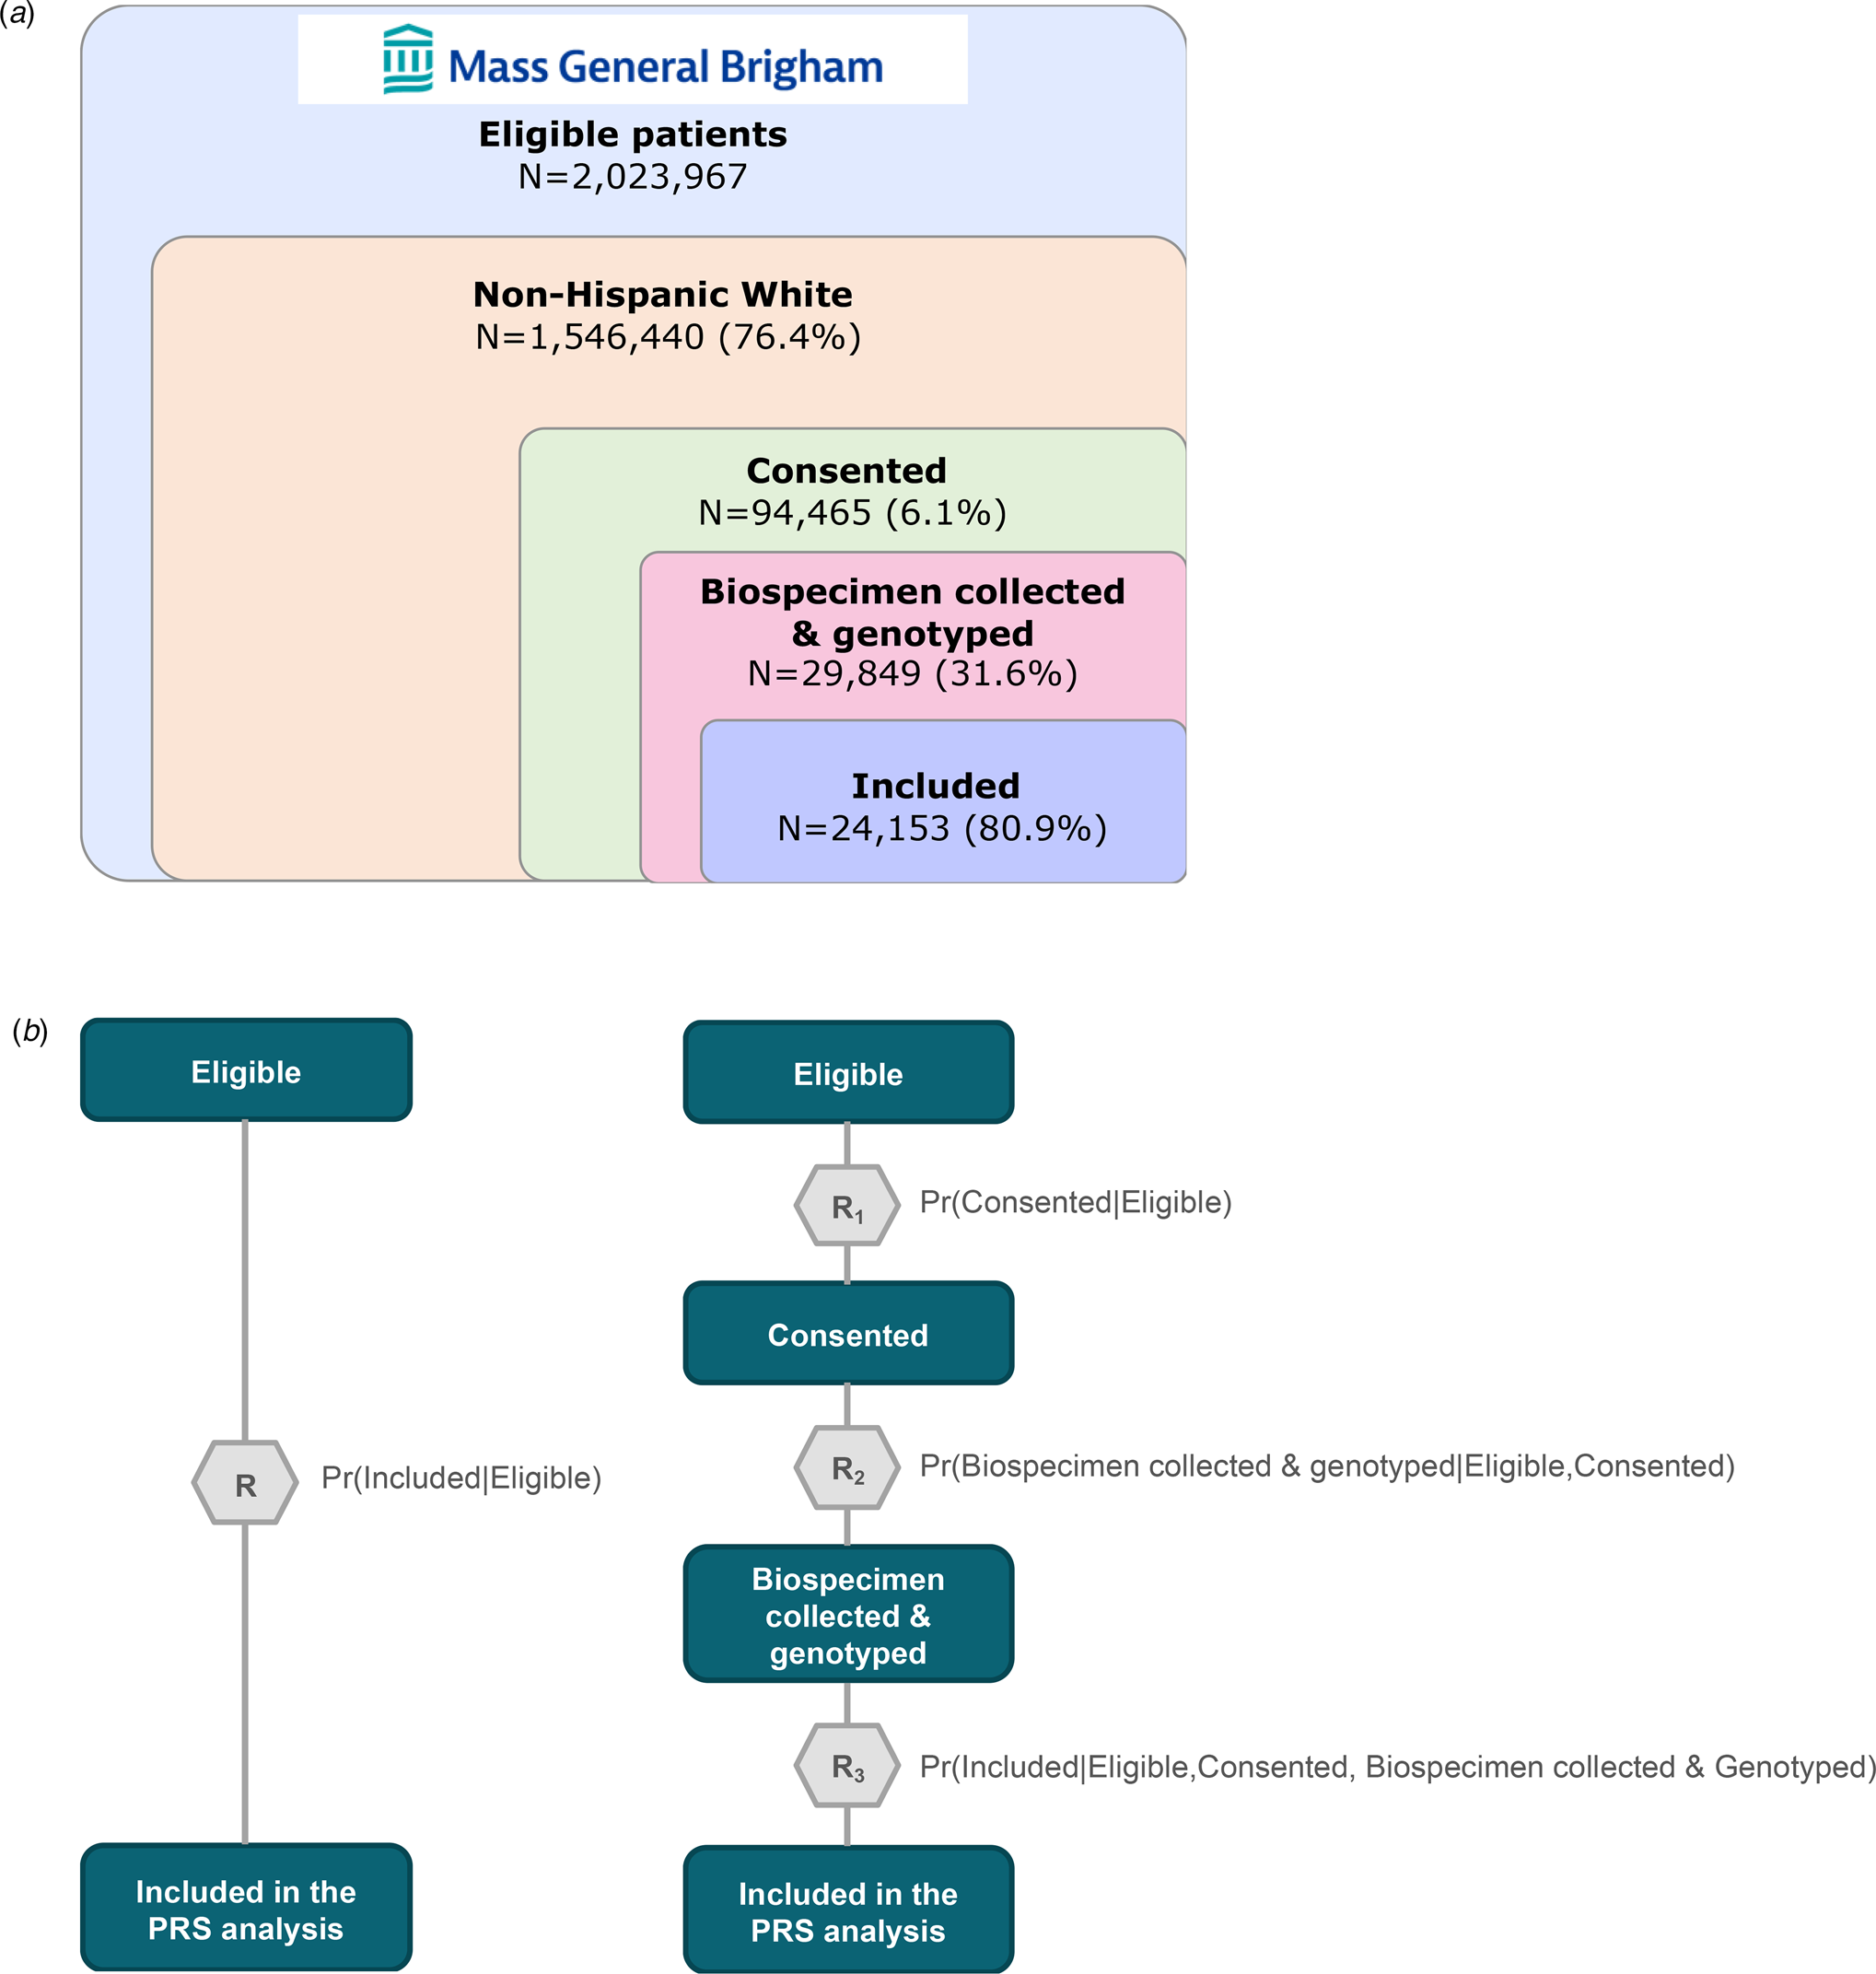
Figure 1. Schematic of sample curation for polygenic risk score analysis using Mass General Brigham (MGB) Biobank and visualization of standard and modular inverse probability (IP) weighting approaches. (a) Sample curation for polygenic risk score analysis using the MGB Biobank sample. (b) Visualization of the standard (left) and modular (right) inverse probability (IP) weighting approach.
Inverse probability (IP) weighting is an established method for correcting such bias in which the contribution of each sampled individual is weighted by the inverse of their probability of being sampled (Seaman & White, Reference Seaman and White2013). In most volunteer-based studies, information about those who were not enrolled is typically limited, precluding in-depth exploration of selection bias that can result from non-random sampling. However, biobanks nested within healthcare systems where demographic and clinical data are available for the full healthcare system population provide a unique opportunity to evaluate factors that may influence the probability of being selected into an analytic sample. In these settings, one can use IP weighting to construct a hypothetical population in which participants are weighted such that they represent the entire population of participants and non-participants with respect to the predictors of selection and conduct analyses that account for non-random sampling.
A key assumption of IP weighting, however, is that one has correctly identified and weighted the predictors of sampling; violation of this assumption may lead to residual or even greater bias (Cole & Hernán, Reference Cole and Hernán2008). Meeting this requirement could be particularly challenging in the case of hospital-based biobanks, since selection may be dynamic and reflect a large number of poorly understood factors – including patient comorbidity profiles and the diversity of clinical settings in which recruitment was conducted. Instead of solely relying on expert knowledge to specify the weight model, Haneuse and Daniels suggest combining clinical knowledge with data-driven strategies for covariate selection (Meier, Van De Geer, & Bühlmann, Reference Meier, Van De Geer and Bühlmann2008; Tibshirani, Reference Tibshirani1997; Zou, Reference Zou2006), especially when working with high-dimensional electronic health records (EHRs) (Haneuse & Daniels, Reference Haneuse and Daniels2016). Accordingly, we use a two-step approach to correct for non-random sampling in PRS analyses. First, we apply a machine learning approach to examine the relative contribution of sociodemographic, clinical, and healthcare utilization characteristics (captured in the longitudinal EHRs) and estimate IP weights for selection into the nested biobank study. Next, we estimate the association between PRS and the target conditions in an IP-weighted sample in which selection into the biobank study occurred at random. Using this two-step approach, we find that standard PRS analyses that do not account for the non-random sampling of biobank samples may lead to biased estimation of polygenic risk in the context of psychiatric conditions.
Finally, we address the fact that selection into biobank-based studies typically involves multiple steps – such as recruitment, consent, biospecimen collection, genotyping, and genomic QC – each of which may be influenced by a unique set of determinants. Haneuse and Daniels proposed a general statistical framework for EHR-based research that explicitly models the chain of interactions and decisions made by patients and healthcare providers which ultimately shape the underlying mechanism for study participation and data availability in a given health system (Haneuse & Daniels, Reference Haneuse and Daniels2016). In practical terms, they recommend modularizing the complex selection mechanism into a series of sub-mechanisms that are relatively easier to characterize and model (Haneuse, Arterburn, & Daniels, Reference Haneuse, Arterburn and Daniels2021). Applying this modular IP weighting framework, we evaluate the discrepancy between PRS effect estimates for psychiatric conditions when using standard v. modular approaches to define selection mechanisms (see Figs 1b and c).
Methods
Study sample
Mass General Brigham (MGB) Research Patient Data Registry (RPDR)
The primary data source was the MGB RPDR, an EHR data warehouse covering 4.6 million patients across the MGB integrated healthcare system (formerly Partners HealthCare) in the USA serving 1.5 million people annually across 11 inpatient hospitals, a rehabilitation network, 20 community health centers, a home-based service network, and hundreds of outpatient clinics. To assemble the cohort for this study, we queried the MGB RPDR for 1 546 440 patients who self-identified as non-Hispanic White (i.e. 76% of the overall MGB patient population) having at least three visits after 2005, more than 30 days apart between the first and last visits, and at least one visit greater than age 10 and less than age 90, as of February 2020 (Bayramli et al., Reference Bayramli, Castro, Barak-Corren, Madsen, Nock, Smoller and Reis2021; Castro et al., Reference Castro, Gainer, Wattanasin, Benoit, Cagan, Ghosh and Murphy2021) (see Fig. 1). The race and ethnicity restriction was applied here because the subsequent PRS analyses were based on samples of European ancestry.
MGB Biobank
The MGB Biobank is a hospital-based research program launched in 2010 to empower genomic and translational research for human health (Boutin et al., Reference Boutin, Schecter, Perez, Tchamitchian, Cerretani, Gainer and Smoller2022; Karlson et al., Reference Karlson, Boutin, Hoffnagle and Allen2016). Participants are patients at MGB-affiliated hospital(s) above age 18 (at the time of the recruitment) who provided informed consent to join the Biobank study. Each consented participant was asked to provide blood samples (e.g. plasma, serum, DNA), which are then linked to their clinical data in the EHRs as well as survey data on lifestyle, behavioral and environmental factors, and family history. Leveraging in-person and electronic recruitment methods, the MGB Biobank has currently enrolled 141 451 participants (85% self-identify as White), collected 95 213 DNA samples, and generated genotyping microarray data for more than 65 081 participants (4919 using the Illumina MEGA, 5332 using the Illumina MEGA EX, 26 135 using the Illumina MEG, and 53 284 using the Illumina GSA) (Castro et al., Reference Castro, Gainer, Wattanasin, Benoit, Cagan, Ghosh and Murphy2021). Further details on the participant recruitment and consent process can be found in eMethods. This research was conducted as part of the PsycheMERGE Consortium (Smoller, Reference Smoller2018), under approval from the MGB Institutional Review Board (2018P002642).
Exposure: polygenic risk scores for three psychiatric conditions
We generated PRS for the 24 153 MGB Biobank participants of European ancestry using their genotype data and weights derived by applying PRS-CS-Auto (Ge, Chen, Ni, Feng, & Smoller, Reference Ge, Chen, Ni, Feng and Smoller2019), a Bayesian polygenic prediction method, to publicly available summary statistics from the largest genome-wide association studies (GWAS) of schizophrenia (The Schizophrenia Working Group of the Psychiatric Genomics Consortium, Ripke, Walters, & O'Donovan, Reference Ripke, Walters and O'Donovan2020), bipolar disorder (Mullins et al., Reference Mullins, Forstner, O'Connell, Coombes, Coleman, Qiao and Andreassen2021), and depression (Howard et al., Reference Howard, Adams, Clarke, Hafferty, Gibson, Shirali and McIntosh2019) on populations of European ancestry (see online Supplementary eMethods for details on genomic data processing and online Supplementary eTable 2 for further information on discovery GWAS). In preparation for the main analysis, we fitted linear regression models with age, sex assigned at birth, top 20 genetic principal components, and genotyping microarray as predictors of each respective psychiatric PRS. We then extracted and standardized the residuals from each regression model and generated a categorical version of the PRS using deciles. In the current study, we primarily focus on disease risk for the top decile of the standardized residuals of PRS, a threshold commonly used to define high genetic risk in the context of clinical translation (Lewis & Vassos, Reference Lewis and Vassos2017).
Outcome: clinical diagnosis of three psychiatric conditions
We identified cases of the three psychiatric traits by mapping the entire longitudinal health records available on all patients at MGB-affiliated hospital(s) to the phecode system using the PheWAS R package (Carroll, Bastarache, & Denny, Reference Carroll, Bastarache and Denny2014; Wei et al., Reference Wei, Bastarache, Carroll, Marlo, Osterman, Gamazon and Denny2017). We identified qualifying ICD-9CM and ICD-10CM codes for schizophrenia (phecode 295.1), bipolar disorder (phecode 296.1), and depression (phecode 296.2), and defined cases as those having at least two phecode for a given outcome occurring on different dates (see the full list of qualifying diagnostic codes in online Supplementary eTable 3).
Statistical approach
We compared effect estimates of the associations between schizophrenia, bipolar disorder, and depression PRS and their respective target diagnoses using three weighting schemes defined by how the IP weight models were specified: (1) unweighted, (2) standard IP-weighted, and (3) modular IP-weighted. In the unweighted approach, PRS effect estimates are calculated without accounting for non-random sampling (i.e. standard PRS analysis). In contrast, the latter two approaches involve a systematic evaluation and adjustment for differential probabilities of being selected into the analytic sample for the PRS analyses, with the modular approach involving additional specification of the intermediate steps of selection (see Figs 1b and c). The application of IP weights allows us to construct a hypothetical population in which we can estimate the effects of PRS in the absence of spurious associations induced by participation-related factors specified in the IP weight model (see the causal diagram in Fig. 2b).

Figure 2. Identification of key features predicting inclusion (e.g. healthcare utilization, income) and a causal diagram illustrating how stratification on healthcare utilization may introduce bias in standard PRS estimation in hospital-based biobanks. (a) A visual demonstration of top 20 features from the standard IP weight model based on mean absolute Shapley values. Features with higher mean absolute Shapley values have a greater impact on the model's decision than those with lower values. The vertical axis shows the features rank-sorted according to the magnitude of the mean absolute Shapley values, from highest (top) to lowest (bottom). (b) A causal diagram (directed acyclic graph or DAG) illustrating how non-random sampling into hospital-based biobanks may introduce bias in a standard PRS estimation. Using the example of a bipolar disorder PRS, the figure depicts two DAGs to illustrate how selection bias could inflate PRS effect estimates in an unweighted PRS analysis. The relationship of interest is denoted by the dotted line connecting PRSBIP (bipolar disorder polygenic risk score) with bipolar disorder diagnosis. Restriction of PRS analysis to biobank participants is represented as a box around biobank enrollment in the causal diagram. Healthcare utilization is a common effect of PRSBIP (through the effect of PRSBIP on depression) and clinical diagnosis of bipolar disorder. In this example, stratification on biobank enrollment, a descendant of healthcare utilization, can induce a spurious association between the PRS and the target trait (represented as a dripping faucet in the figure). Thus, the estimated effect could include not only true causal effects but also the spurious association, resulting in larger estimates in standard PRS analysis when non-random sampling is not addressed. In contrast, when selection bias is accounted for using IP weighting, socioeconomic status (SES) and healthcare utilization are no longer associated with biobank enrollment, and so biobank enrollment is no longer a descendant of a collider. Therefore, stratifying on biobank enrollment would not open the non-causal path blocked by healthcare utilization (represented as a tight faucet in the figure). Thus, IP-weighted PRS estimates would likely represent effects through the causal path only.
We first evaluated the impact of IP-weighting on PRS penetrance, which represents the case prevalence as a function of PRS and provides an estimate of the absolute disease risk (Bigdeli et al., Reference Bigdeli, Voloudakis, Barr, Gorman, Genovese and Peterson2022; Zheutlin et al., Reference Zheutlin, Dennis, Karlsson Linnér, Moscati, Restrepo, Straub and Smoller2019). To assess this impact, we compared the IP-weighted penetrance against the unweighted penetrance. Next, we evaluated the discrimination ability of the PRS using the area under the receiver operator characteristic curve (hereafter, the AUC) (Robin et al., Reference Robin, Turck, Hainard, Tiberti, Lisacek, Sanchez and Müller2011). Under the unweighted approach, we fitted standard logistic regression models adjusting for covariates. Under the IP-weighted approaches, we inputted the standard and modular IP-weights, respectively, and fitted weighted logistic regression models (Lumley, Reference Lumley2021). We then calculated the AUC to compare the discrimination ability of the unweighted and IP-weighted logistic regression models (Mangiafico, Reference Mangiafico2022). Lastly, we explored potential effect modification of the discrimination ability of psychiatric PRS by sex assigned at birth and current age.
Data-driven specification of IP weight models for selection
We utilized a large set of demographic and clinical features extracted from high-dimensional EHRs, including 15 sociodemographic, 1814 diagnostic, and 10 healthcare utilization characteristics to identify the key determinants of non-random sampling of biobank participants and calculate the IP selection weights (refer to online Supplementary eTable 4 for the full list of features and online Supplementary eMethods for how they were curated). To achieve this, we employed a machine learning approach, Extreme Gradient Boosting (XGBoost) classification (Chen & Guestrin, Reference Chen and Guestrin2016), which is an open-source library that provides a computationally efficient and high-performance implementation of gradient-boosted decision trees (https://github.com/dmlc/xgboost).
In the first set of IP-weighted analyses (i.e. standard IP-weighted approach), we fitted an XGBoost model classifying the inclusion into the PRS analysis (N = 24 153) from a pool of 1 546 440 adult patients at MGB-affiliated hospital(s) self-identifying as non-Hispanic White. Considering that a very small proportion of the patient population participated in the Biobank study, we ensured that the training and test sample (with a split ratio of 80:20) had the same proportion of the target outcome in a given selection step (e.g. included v. not included in the PRS analysis). After fitting the model, we derived weights by taking the inverse of the predicted probabilities of being selected into the final PRS analysis. We further stabilized the IP weights by dividing the predicted probabilities by the marginal probability of selection and truncated the top and bottom 1% of the distribution to account for extreme weights.
In the second set of IP-weighted analyses (i.e. modular IP-weighted approach), we fit three separate sets of XGBoost models classifying each of the three selection steps (see Fig. 1c). The three targets for classification were: 1) consent status among eligible participants, 2) biospecimen collection and genotyping status among consented participants, and 3) inclusion in the PRS dataset among participants who are eligible, consented, and had biospecimens collected and genotyped. We extracted predicted probabilities from each of the three models and took the product of these conditional probabilities to calculate the joint probabilities of being included in the final analytic sample given the three sequential steps of selection. We then stabilized and truncated the inverse of the joint probabilities in the same way as we did for the standard IP-weighted approach, and performed weighted PRS analyses.
In addition, we applied a game theory-based algorithm called Shapley Additive Explanations (SHAP) method to further elucidate the complex selection mechanism of the MGB Biobank (Lundberg & Lee, Reference Lundberg and Lee2017). We calculated Shapley values, which are the weighted average of the marginal contribution of each feature value toward the model's decision, to explain how changes in a feature value would shift the models' decision both in terms of absolute magnitude and directionality. This way, we characterized the importance of each feature to the predicted probability of being retained in the study sample at each step of selection (see magnitude and directionality of contribution by the top 20 features in online Supplementary eFigs 1 and 2, respectively).
Results
Descriptive statistics
As shown in Table 1, we first compared participants in the analytic (Biobank) sample (N = 24 153) for the PRS analyses against those who were not included (from the broader pool of eligible patients in the healthcare system). In general, the included individuals were significantly more likely to be male, veterans, and married, have publicly funded insurance, and have markedly greater healthcare utilization compared to those excluded and those in the overall source population. Additionally, we compared the prevalence estimates for common health conditions of those included in the final analytic sample against those of excluded participants (see online Supplementary eTable 1). Consistent with their higher frequency of healthcare interactions, individuals included in the PRS analysis were more likely to have clinical diagnoses of all disease conditions examined, including up to three times higher rates of endocrine, nutritional, and metabolic diseases (e.g. type 1 and 2 diabetes mellitus, obesity), neuropsychiatric conditions (e.g. neurological disorders, major depressive disorder, suicidal behavior), and circulatory conditions (e.g. essential hypertension, myocardial infarction). Of note, the prevalence of rheumatoid arthritis was up to five times greater among those included than those not included in the PRS analyses, likely reflecting recruitment into the MGB Biobank from rheumatology clinics. Lastly, the prevalence estimates of the three target traits in the analytic sample of 24 153 MGB Biobank participants were 1.0% (n case = 236), 4.5% (n case = 1079), and 26.2% (n case = 6329) for schizophrenia, bipolar disorder, and depression, respectively.
Table 1. Comparison of demographic and healthcare utilization characteristics of European ancestry patients in the overall MGB patient population1 against those included in the PRS analysis (shown in number of participants and prevalence of a given condition)

1 The denominator (‘overall MGB patient population’) is defined as adult patients (18 years and older by 2010) of European ancestry having at least three visits after 2005 and more than 40 days apart with at least one clinical note (N = 1 546 440; see Fig. 1).
2 ICD, International Classification of Diseases; CPT, Current Procedural Terminology.
Identification of key determinants of selection
In the XGBoost model under the standard IP-weighted approach, visit count, note count, current age, and clinical encounters at Massachusetts General Hospital (MGH) or Brigham and Women's Hospital (BWH) were the five most important features that differentiated those included and those not included in the PRS analysis, followed by clinical encounters at Northshore Medical Center or Newton-Wellesley Hospital and median neighborhood income in 2010 (see Fig. 2a). The top features indicative of healthcare utilization from the standard IP-weighted approach also appeared in the three XGBoost models under the modular IP-weighted approach. The modular approach identified additional features that contributed to the probability of being retained in each step of selection, such as anxiety, phobic, and dissociative disorders, ischemic heart disease, clinical encounters at Faulkner Hospital, and rheumatoid arthritis and other inflammatory polyarthropathies (see online Supplementary eFigs 1a–c).
In addition to overall feature importance, we further examined the directionality of feature contributions to being retained in each step of selection in the modular IP-weighted approach. This was motivated in part by prior work showing that standard IP weighting may lead to biased estimates when a given feature plays a different role in each step of a sequential selection procedure (Haneuse et al., Reference Haneuse, Arterburn and Daniels2021; Peskoe et al., Reference Peskoe, Arterburn, Coleman, Herrinton, Daniels and Haneuse2021; Thaweethai, Arterburn, Coleman, & Haneuse, Reference Thaweethai, Arterburn, Coleman and Haneuse2021). To address this, we calculated Shapley values at every observed value of each feature across all possible combinations with other features and evaluated whether key features had dynamic contributions across the three selection steps. Interestingly, visit count, which was the most important feature in every step of selection, exhibited different directions of associations with retention probabilities across the three selection steps (see online Supplementary eFigs 2b–d). For example, an increasing number of visits was associated with a higher likelihood of providing consent to participate in the Biobank but a lower likelihood of being retained in the subsequent steps of selection. Although the modularization of the IP weight model did not substantially improve the adjustment of selection bias in the PRS analysis relative to standard IP weighting, our results underscore the importance of considering the possibility that some factors may affect retention probability differently across multiple phases of selection in biobank studies.
Polygenic risk estimation
Case prevalence per deciles of standardized residuals of psychiatric PRS
After standardizing PRS by principal components, sex, age, and genotyping microarray, case prevalence for schizophrenia in the top decile of standardized residuals of schizophrenia PRS was 2.7% (2.1–3.3) in the unweighted analysis, and 2.0% (1.2–2.7) in the standard IP-weighted analysis (see Fig. 3a). The unweighted and IP-weighted estimates differed more substantially in the case of bipolar disorder; case prevalence of bipolar disorder in the top PRS decile was 10.0% (8.8–11.2) in the unweighted analysis, but only 6.2% (5.0–7.5) when selection bias was accounted for using IP weights. Finally, case prevalence of depression in the top decile of standardized residuals of depression PRS was 33.5% (31.7–35.4) in the unweighted analysis but was reduced to 28.9% (25.8–31.9) after standard IP weighting. Results using modular IP weighting based on intermediate selection steps were similar to those observed with standard IP weighting (see online Supplementary eTables 5–7).

Figure 3. Evaluation of the impact of the modular inverse probability (IP) weighting approach on the polygenic risk estimation of schizophrenia, bipolar disorder, and depression. (a) Case prevalence by polygenic risk score (PRS) decile for three psychiatric traits using two different weighting schemes – unweighted and modular IP-weighted. PRS were adjusted for potential confounding by top genetic principal components, sex, age, and genotyping microarray. The solid lines indicate point estimates, and the bands indicate 95% confidence intervals for corresponding point estimates. Note that the standard IP-weighted model is not shown in this figure, since the estimates were nearly identical to the modular IP-weighted model. Numeric estimates from all three models can be found in online Supplementary eTables 5–7. (b) Comparison of discrimination by psychiatric PRS (area under the receiver operating characteristic curve or AUC) across groups defined by sex assigned at birth and age.
Discrimination ability at the top decile of psychiatric PRS
We found the largest impact of IP weighting on tail discrimination with respect to schizophrenia relative to bipolar disorder and depression (see online Supplementary eTable 8). When stratified by sex assigned at birth, the AUC estimates were generally higher among male participants than female participants regardless of the weighting scheme (see Fig. 3b). The impact of IP weighting was also greater among males (AUC = 0.792 and 0.711 from unweighted and modular IP-weighted models, respectively) than females (AUC = 0.711 and 0.675 from unweighted and modular IP-weighted models, respectively).
In addition, we found that both the magnitude and directionality of the impact of IP weighting varied by age, especially for schizophrenia (see Fig. 3c). For example, among participants whose age was less than 40 years, the AUC of schizophrenia PRS from the unweighted model was lower than the AUC from the modular IP-weighted model. Conversely, the AUC from the unweighted model was higher than the AUC from the modular IP-weighted model among participants whose age was greater than or equal to 40.
Discussion
In the present study, we demonstrated that effect estimates of psychiatric PRS can be sensitive to selection bias, using the MGB Biobank as a case example. First, we showed that volunteer-based biobank participants may substantially differ from patients in the underlying healthcare system with respect to a wide range of patient profiles including sociodemographic, clinical, and healthcare utilization characteristics. Notably, prevalence of disease conditions and rates of healthcare utilization were substantially higher in the analytic sample than in the overall MGB patient population. This suggests that, in contrast to the well-known phenomenon of ‘healthy volunteer bias’ in population-based biobanks (Fry et al., Reference Fry, Littlejohns, Sudlow, Doherty, Adamska, Sprosen and Allen2017; Swanson, Reference Swanson2012; Tyrrell et al., Reference Tyrrell, Zheng, Beaumont, Hinton, Richardson, Wood and Tilling2021), patients enrolled in hospital-based biobanks may have a greater burden of illness than those in the underlying healthcare system from which they were selected. In addition, we demonstrated that an efficient machine learning algorithm can help discover key sociodemographic, clinical, and healthcare utilization characteristics associated with the probability of retention in each selection step of PRS analyses, allowing for a more comprehensive adjustment of selection bias.
Using IP weighting procedures, we found that selection bias can produce meaningful impact on estimates of penetrance and discrimination ability of psychiatric PRS in biobank samples derived from healthcare system populations. Overall, unweighted effect estimates of psychiatric PRS were larger than the IP-weighted estimates for the three psychiatric traits examined in the current study. In the example of a bipolar disorder PRS, Fig. 2b shows a causal diagram that illustrates how selection bias could inflate PRS effect estimates in hospital-based biobanks that tend to be enriched with patients with higher frequency of healthcare interactions compared to the underlying patient population. Restriction of PRS analysis to biobank participants is represented as a box around biobank enrollment in the causal diagram. In this example, stratification on the descendent of healthcare utilization, a common effect (i.e. collider) of bipolar disorder PRS and clinical diagnosis of bipolar disorder, can induce a spurious association between the PRS and the target trait – a phenomenon commonly referred to as ‘collider stratification bias’ and known to pose a potential threat to the internal validity (Hernán, Hernández-Díaz, & Robins, Reference Hernán, Hernández-Díaz and Robins2004). As such, the estimated effect could include not only true causal effects but also the spurious association, thereby resulting in larger estimates in standard PRS analysis when non-random sampling is not addressed.
These findings underscore the complex nature of selection bias and the difficulty of predicting the magnitude or directionality of the effects by this type of bias on PRS estimates in real-world settings. For example, individuals who are more health-conscious or better informed about the clinical utility of genomic findings may be more willing to participate in a biobank, as has been shown in the UK Biobank (Fry et al., Reference Fry, Littlejohns, Sudlow, Doherty, Adamska, Sprosen and Allen2017; Swanson, Reference Swanson2012; Tyrrell et al., Reference Tyrrell, Zheng, Beaumont, Hinton, Richardson, Wood and Tilling2021; van Alten, Domingue, Galama, & Marees, Reference van Alten, Domingue, Galama and Marees2022). Conversely, patients whose illness leads to more frequent encounters with the healthcare system may have more opportunities to be selected for biobank participation, leading to an overrepresentation of less healthy individuals. In addition, some individuals may enroll in genetic studies because they have a family history of heritable conditions, such as cancer, and are thus motivated to learn about their risk of illness; enrichment for family history of specific diseases may contribute to differences between biobank cohorts and their underlying source populations.
Recently, several analytic approaches to model and mitigate selection bias in EHR data have been proposed, with varying conceptual definitions of selection bias and statistical approaches to modeling underlying selection mechanisms. For instance, Haneuse and Daniels encourage researchers to modularize complex selection mechanisms into a series of sub-mechanisms that are easier to characterize and model (Haneuse & Daniels, Reference Haneuse and Daniels2016; Haneuse et al., Reference Haneuse, Arterburn and Daniels2021). In the current study, we adapted this statistical framework to accommodate the selection procedures unique to PRS analyses conducted in hospital-based biobanks, though modular IP weighting did not differ substantially from standard IP weighting in its impact on polygenic risk estimation. Nevertheless, the modular approach revealed that certain features (e.g. visit count) may have differing impacts on retention probability at different stages of selection and provided useful insights into the variable contributions of features that would not have been identified otherwise. As an alternative to Haneuse and Daniels' approach, Goldstein and colleagues proposed controlling for the number of healthcare encounters (Goldstein, Bhavsar, Phelan, & Pencina, Reference Goldstein, Bhavsar, Phelan and Pencina2016). However, as they note, stratification on healthcare utilization may actually induce spurious association between two disease phenotypes in cases where healthcare encounters may be the common outcome of the exposure and outcome (i.e. collider stratification bias).
More recently, Beesley and Mukherjee proposed calibration weighting and IP weighting methods to account for selection bias in EHR-linked biobank studies (Beesley & Mukherjee, Reference Beesley and Mukherjee2022). They focus on the form of selection bias that arises from the lack of representativeness and propose constructing weights from external data that better represent the demographic and clinical characteristics of the source population, such as national disease registries for target traits of interest. However, different healthcare systems serve different patient populations, each characterized by unique profiles of sociodemographic, clinical, and healthcare utilization characteristics. As such, it may not be feasible to directly transport selection weight models trained in one healthcare system to another. Instead, adjustment may require a context-specific examination of underlying distributions of the key determinants leading to retention in the analytic sample for PRS analyses. To that end, we leveraged the longitudinal EHRs linked to genomic data collected to derive a set of weights that are specific to the underlying selection mechanism for the MGB Biobank.
Relatedly, different health system biobanks may rely on varying strategies for recruitment and biospecimen collection. For example, at the MGB Biobank, participant enrollment is conducted using a range of procedures including recruitment via (a) outpatient primary care or specialty clinics; (b) inpatient settings; (c) at centralized phlebotomy services; (d) online enrollment; or (e) collaborating studies. For a subset of patients, biospecimen collection was obtained by placing an order into the Epic EHR system (Epic Systems Corporation, n.d.) collect a sample concurrently with a clinically ordered blood draw. Although an overrepresentation of less healthy individuals could be a general characteristic of hospital-based biobanks given that they originate from patient populations, the degree of overrepresentation may further vary depending on the distinct method of recruitment and sample collection used in each biobank study.
Our study has several limitations that should be considered when interpreting the results. First, our approach does not address the distributional mismatch between samples used to train and validate the PRS and the sample in which the PRS is implemented. This can lead to miscalibration of PRS estimates if the samples differ with respect to sample characteristics, such as age, sex, and socioeconomic status (Mostafavi et al., Reference Mostafavi, Harpak, Agarwal, Conley, Pritchard and Przeworski2020). Although this is an important issue in the implementation of PRS in clinical practice, it was beyond the scope of our current study. Second, caution is advised when generalizing our findings to other traits as our study focused on three psychiatric traits. It is possible that the impact of selection bias may vary across different clinical conditions. Third, our study was restricted to participants of European ancestry, primarily due to the limited availability of non-European ancestry participants in the MGB Biobank, particularly in the subsample with genotype data available for analysis. As a result, we were unable to investigate the impact of selection bias in non-European populations or potential variations in participation by genetic ancestry. Notably, patients from diverse populations are more likely to be exposed to sociodemographic disadvantages, such as low income, low health literacy, lack of access to healthcare, mistrust in biomedical research, and cultural beliefs, which can contribute to low participation rates among diverse populations in biobank studies (Prictor, Teare, & Kaye, Reference Prictor, Teare and Kaye2018). Therefore, further investigation and validation in more diverse samples and contexts are necessary to ensure equitable translation of PRS into clinical practice (Landry, Ali, Williams, Rehm, & Bonham, Reference Landry, Ali, Williams, Rehm and Bonham2018).
In conclusion, our analyses demonstrate a novel, interdisciplinary approach for detecting and accounting for unrecognized selection bias in hospital-based biobanks, particularly in the context of PRS analyses. As efforts to integrate PRS into research and clinical settings continue to expand, recognizing and mitigating these biases is increasingly important, since these biases may have implications for patient care and outcomes. Moreover, further research and validation in more diverse populations will be essential to ensure the generalizability and applicability of our approach in different contexts.
Supplementary material
The supplementary material for this article can be found at https://doi.org/10.1017/S0033291723001186.
Acknowledgements
This work was conducted with support from Harvard Catalyst | The Harvard Clinical and Translational Science Center (National Center for Advancing Translational Sciences, National Institutes of Health Award UL1 TR002541) and financial contributions from Harvard University and its affiliated academic healthcare centers. The content is solely the responsibility of the authors and does not necessarily represent the official views of Harvard Catalyst, Harvard University and its affiliated academic healthcare centers, or the National Institutes of Health. J. W. S. was supported in part by NIMH R01MH118233, NHGRI U01HG008685, and a gift from the Demarest Lloyd, Jr. Foundation. T. G. was supported in part by NIA R00AG054573, NHGRI U01HG008685, and NHGRI U01HG011723. E. W. K. was supported by 5U01HG008685. This study would not be possible without the contributions of Mass General Brigham (MGB) patients and Biobank participants. We would also like to thank the research coordinators and the Biobank study for their tremendous effort in participant recruitment and sample collection. Lastly, we would like to acknowledge the RPDR team for their work maintaining the enterprise research patient data warehouse.
Financial support
Dr Smoller is a member of the Leon Levy Foundation Neuroscience Advisory Board, the Scientific Advisory Board of Sensorium Therapeutics, and has received honoraria for internal seminars at Biogen, Inc and Tempus Labs. He is PI of a collaborative study of the genetics of depression and bipolar disorder sponsored by 23andMe for which 23andMe provides analysis time as in-kind support but no payments.


