


Life history theory is an ecological and evolutionary framework grounded upon a central tenet that lifespan and reproduction trade-off against each other(Reference Gluckman, Beedle and Hanson1). Through this theory, the strong morbidity and mortality risks associated with earlier timing of pubertal onset or menarche may be explained as consequence of attaining reproductive maturity at a younger age(Reference Gluckman, Beedle and Hanson1). Earlier pubertal timing has, for many years, been recognised as a predictor of cardiometabolic disease, some hormone-related cancers and mortality(Reference Day, Elks and Murray2). More recently, a link between faster pubertal tempo and suboptimal mental wellbeing has been described(Reference Beltz, Corley and Bricker3, Reference Mendle4), suggesting that a trade-off potentially exists for the timing as well as speed of sexual maturation.
Over the past decade, there has been emerging interest in understanding how life history trade-offs are impacted by dietary macronutrients. Such interest has risen from advances in dietary analysis via nutritional geometry (NG), which is a non-linear data-driven analytic approach that considers how nutrient balance (rather than independent nutrient effects) relates to an outcome variable by ‘mapping’ data on a multi-dimensional space. Animal experiments using NG have generally found that a higher intake of protein relative to carbohydrate promotes fecundity, whereas the reverse dietary pattern prolongs survival(Reference Lee, Simpson and Clissold5–Reference Solon-Biet, Walters and Simanainen8). Such findings align with large epidemiological datasets on human ageing that show reduced mortality risk with high-carbohydrate, low-protein intake using the same analytic methodology(Reference Le Couteur, Solon-Biet and Cogger9). Studies of longevous populations around the world (e.g. Okinawans) also report dietary macronutrient ratios that mirror the lifespan-promoting diets in the animal experiments(Reference Le Couteur, Solon-Biet and Wahl10). The impact of macronutrients on human reproduction is, by contrast, less well explored. However, there is some evidence to suggest that the facilitatory effect of higher-protein, lower-carbohydrate intake on reproduction, as shown in the animal experiments, may hold true for pubertal maturation in humans.
Several cohort studies, primarily from the 1990s and mostly in girls(Reference Cheng, Buyken and Shi11), have reported that higher total and/or animal protein intake in childhood predicted earlier timing of pubertal events including height take-off, thelarche and menarche(Reference Gunther, Karaolis-Danckert and Kroke12–Reference Kissinger and Sanchez16). Yet, the overall evidence is equivocal because a number of other studies have failed to identify any macronutrient association with pubertal timing(Reference Maclure, Travis and Willett17–Reference Petridou, Syrigou and Toupadaki21). Conflicting evidence may, at least partly, be due to the way nutrient data have been analysed. Nutrition research has historically involved regression modelling, which is a method that requires the nature/shape of a relationship (typically linear) to be determined by the researcher and not the data. In many cases, the non-independence (or substitution effects) of nutrient variables are also handled inappropriately, which makes disentangling individual macronutrient influences and the macronutrient v. total energy effects challenging. NG may be useful for overcoming these challenges(Reference Simpson, Le Couteur and Raubenheimer22), and may offer new insights into the role macronutrient balance plays in human pubertal development.
This study aimed to use NG to assess the impact of childhood macronutrient balance on subsequent timing and tempo of puberty in adolescence. We hypothesised that children consuming greater amounts of total and animal protein relative to carbohydrate would experience earlier and faster puberty development, irrespective of total energy intake and other key confounders known to influence diet and pubertal development.
Experimental methods
Participants and overall study design
The present research used data from the Nepean Longitudinal Study. This was a cohort study that ran from 1996 to 2004, and which recruited 436 children (>95 % Caucasian) from an Australian birth cohort born between August 1989 and April 1990 in Western Sydney(Reference Garnett, Cowell and Baur23). The primary objective of the Nepean study was to explore foetal and mid-childhood influences on body composition and metabolic risk in adolescence(Reference Garnett, Cowell and Baur23). Data collection involved three study visits at: (i) 7–8 years of age (referred to as age 8 years or mid-childhood from this point onwards); (ii) age 13 years; and (iii) age 15 years, which span the pubertal development period allowing for off-timed normal puberty. Each visit involved collection of growth, metabolic and demographic data; the most relevant of which are outlined below. The Nepean study was conducted according to the guidelines laid down in the Declaration of Helsinki and all procedures involving human participants were approved by the ethics committees of The Children’s Hospital at Westmead (protocol nos. 95038 and 2001/095) and the Wentworth Area Health Service (protocol nos. 95/051 and 2001/65). Written informed consent was obtained from all parents, with verbal assent given by all adolescents.
To be included in the present analyses, participants must have had a plausible food record at age 8 years, and provided information on age at menarche or had suitable hormone and Tanner stage data to allow estimation of their pubertal trajectory (see below).
Collection and handling of dietary and demographic data
Dietary intake at age 8 years was assessed using parent-assisted 3-d food records. Parents were guided on recording their child’s food and drink intake using a standardised form. Dietary supplements, cooking methods, brand names and recipes were documented where applicable. Food records were analysed with DIET/1 version 3.10 (Xyris Software), using the Australian NUTTAB 95 database(Reference Lewis, Milligan and Hunt24). Food records were assessed for plausibility as per McCrory et al. (Reference McCrory, McCrory and Hajduk25), a method which has been used previously in adolescents(Reference Huang, Roberts and Howarth26). Records were excluded if reported energy intake fell outside the plausibility range of predicted energy requirement; calculated at 76·2–123·8 and 76·5–123·5 % for boys and girls, respectively. Plausible records were analysed for absolute energy (kJ per d), percentage energy (% kJ per d) and energy-adjusted residuals(Reference Willett and Stampfer27) from carbohydrate, fat, total protein and animal protein. The ratio of protein energy to non-protein energy (PE:NPE) was calculated.
Socio-economic variables assessed at age 8 years were mother’s education, mother’s occupational status and family income. Mother’s education was categorised as incomplete high school, completed high school and tertiary education. Employment status was categorised as professional, non-professional or home duties/student/unemployed. An occupational prestige score, a widely used metric at the time of data collection(Reference Daniel28), was calculated from employment data. Gross annual family income (including government pensions and allowances) was grouped based on categories in the 1991 national census: <AUD30 000, AUD30 000–49 999 or ≥AUD50 000.
Anthropometric and body composition assessment
At age 8 years, height (nearest 0·1 cm) was measured using a Harpenden stadiometer (Holtain Ltd). Weight (nearest 0·1 kg) was measured in minimal clothing using an electronic scale (Detecto Scales Inc.). Waist circumference (nearest 0·1 cm) was measured at the narrowest point between the lower rib border and iliac crest using flexible steel tape(Reference Garnett, Cowell and Baur23). Age- and sex-specific BMI z-scores (zBMI) were calculated(Reference Kuczmarski, Ogden and Guo29), with overweight and obesity defined using International Obesity Task Force cut-points(Reference Cole, Bellizzi and Flegal30).
Pubertal assessment
At age 8 years, 254 of the 436 participants provided a fasting morning blood sample for plasma testosterone and oestradiol analyses via radioimmunoassay(Reference Garnett, Hogler and Blades31). For the present study, we only included those who had a measured hormone level in the childhood range (laboratory specific cut-off of ≤1 nmol/l for male testosterone and ≤56 pmol/l for female oestradiol), with which their pre-pubertal status could be verified. These participants were coded as being in Tanner stage 1 at age 8 years. During the age 13 and 15 year follow-ups, adolescents self-rated their Tanner stage using line drawings of female breast or male genital development(Reference Duke, Litt and Gross32). Girls were asked if they had reached menarche, and if so, to recall the month and year of their first menstrual period.
Modelling of individual pubertal development trajectories
Using a logistic mixed modelling procedure detailed in Marceau et al. (Reference Marceau, Ram and Houts33), we described pubertal trajectories for each participant by modelling individual Tanner stage change against change in (fractional) age. To define the four parameter logistic curves with only three waves of data, a fourth pubertal time point had to be assigned for each individual which was done by coding Tanner stage 5 at age 17 years for girls and age 18 years for boys(Reference Susman, Houts and Steinberg34). The decision to use this methodology over linear models of puberty was based on several factors. Firstly, logistic models describe the physiological process of maturation more realistically than linear trajectories, and have been shown to provide better model-fit(Reference Beltz, Corley and Bricker3, Reference Marceau, Ram and Houts33). Secondly, logistic modelling considers within-person variation over time, unlike linear or duration-based measures of puberty that assume a constant rate of maturation. Thirdly, this methodology produces two model-derived scores for each individual, based on empirical Bayes estimates, which lend themselves naturally as mathematical estimates of pubertal timing and tempo. The score for pubertal timing represents the age at which a participant is halfway between the lower and upper asymptotes of the logistic curve; interpreted as the age at Tanner stage 3 for breast (B3) and genital (G3) development in girls and boys, respectively. The tempo score represents the slope of the logistic curve at the same halfway point, which gives the rate of maturation at mid-puberty expressed in Tanner stages per year. Model-derived scores were tested against the most reliable pubertal marker, i.e., menarcheal onset, using Spearman’s correlation (r s). Correlations between timing and tempo scores were assessed in both sexes.
Statistical analyses
Assessing selection bias. As only a subset of the Nepean cohort was included for the present study, we tested for selection bias by comparing birth weight, mid-childhood anthropometry and socio-economic variables between included and excluded participants using unpaired t tests and Mann–Whitney U tests. Normality was assessed via Shapiro–Wilk tests, with data presented as percentages, means and standard deviations or medians and interquartile ranges.
Nutritional geometry analysis of macronutrient balance v. pubertal outcomes. All analyses were undertaken across the absolute energy, percentage energy and energy-adjusted macronutrient variables. The balance of dietary carbohydrate, fat and protein in relation to each pubertal outcome (age at menarche; timing and tempo scores for breast/genital development) was assessed visually using a set of two-dimensional (2D) response surfaces, which plot the relationship of two nutrient predictors to a pubertal outcome (while holding the third nutrient axis at its median) using thin-plate splines(Reference Solon-Biet, McMahon and Ballard7). Each response surface is read like a topographic map whereby areas in red denote the highest menarcheal age and timing/tempo scores, gradually transitioning to areas in blue denoting the lowest menarcheal age and timing/tempo scores. Importantly, interpretation of the timing and tempo results are reversed in that earlier age at menarche/B3/G3 is represented by areas in blue, whereas faster tempo of Tanner stage change is represented by areas in red. These response surfaces are summarised statistically using generalised additive models (GAM), which express the macronutrient relationships as main and interaction effects with respect to the outcome variable.
Using the same methodology of combining 2D response surfaces with GAM, we assessed the balance of total protein, animal protein and non-protein macronutrients on menarcheal age and the timing and tempo scores. An overall GAM was also constructed, which analysed the relationship of PE:NPE to each pubertal outcome while adjusting for total energy intake, birth weight, height, zBMI and mother’s occupation prestige (other socio-economic variables were not included due to their categorical nature). All response surfaces and GAM were fitted using the fields and mgcv packages of the R language, respectively (R Core Team, 2012, v.2.15.13)(Reference Wood35, Reference Wood36).
Linear regression analysis of macronutrient variables v. pubertal outcomes. To aid comparison with prior research, we replicated the analytic strategy used in most existing studies through multiple regression modelling. Each regression model tested the main effects of the macronutrient variables on a pubertal outcome, adjusted for the same confounders described above. Collinearity between total energy intake and the macronutrient variables was tested by excluding total energy intake from the regression models, which did not alter any of the results. Linear regressions were performed on IBM SPSS Statistics 24 (IBM Corporation).
Justification of sample size. Sample size was determined by the availability of useable dietary and pubertal data from the Nepean cohort. Based on a two-sided significance level of 0·05, a sample of ninety-two girls achieves 80 % power to detect a minimal change in age at menarche and breast timing score of 0·14 year in a linear regression model with percentage protein as a predictor (sd of percentage protein: 2·04, sd of menarche residuals: 0·96; sd of breast timing score residuals: 0·99). A sample of fifty boys achieves 80 % power to detect a change in genital timing score of 0·11 year in a linear regression model with percentage protein as a predictor (sd of percentage protein: 2·17; sd of residuals: 0·58). Calculations were performed using PASS 16 Power Analysis and Sample Size Software.
Results
Participant characteristics
Of the 436 children recruited to the Nepean study, 142 (ninety-two girls, fifty boys) provided suitable dietary and pubertal data for NG analysis (online Supplementary Fig. S1). Upon assessing potential selection bias, the only observation was a slightly higher birth weight in the included v. excluded boys (by 190 g; P = 0·051). No other differences in birth, mid-childhood or socio-economic variables were detected in either sex (Table 1).
Table 1. Participant birth weight, mid-childhood anthropometry and pubertal characteristics
(Numbers of subjects, mean values and standard deviations, percentages, and medians and interquartile ranges)
* Data presented as a percentage.
† Data presented as median and interquartile range.
‡ Derived from breast and genital development in girls and boys, respectively. Timing score is defined as age at Tanner stage 3.
§ Derived from breast and genital development in girls and boys, respectively. Tempo score is defined as the slope at Tanner stage 3 and is expressed in stages per year.
Among participants included in the present analyses, birth weight and the mid-childhood variables were within normal range (Table 1). Overweight or obesity was prevalent in 21 % of girls and 18 % of boys, consistent with national rates at the time(Reference McLennan and Podger37). Plasma oestradiol at 8 years was 18·8 (sd 4·2) pmol/l in girls. Plasma testosterone at 8 years was 0·70 (interquartile range 0·30) nmol/l in boys. Age at menarche was 12·6 (sd 1·0) years. Median pubertal timing score (i.e. age at B/G3) was 13·2 years in girls and 13·4 years in boys. Median pubertal tempo score (i.e. mid-pubertal rate of maturation) was 1·15 and 0·98 Tanner stages per year in girls and boys, respectively. A significant negative correlation was observed between timing and tempo scores in girls (r s −0·40; P = 0·001) but not boys (Fig. 1). The two measures of female pubertal timing, i.e. age at B3 and age at menarche, were significantly and positively correlated with each other (r s 0·29; P = 0·033; Fig. 1).
Fig. 1. Bivariate correlations for (a) pubertal timing and tempo scores in both sexes (![]() , boys;
, boys; ![]() , girls); and (b) pubertal timing scores and age at menarche in girls. Δ, Change; TS, Tanner stage; r s, Spearman’s rho.
, girls); and (b) pubertal timing scores and age at menarche in girls. Δ, Change; TS, Tanner stage; r s, Spearman’s rho.
Macronutrient balance v. pubertal outcomes via nutritional geometry
Generalised additive modelling (Table 2), together with associated diagnostic tests (online Supplementary Fig. S2), supported a significant association between macronutrient intake and menarcheal onset. Evaluation of response surfaces showed this association was not in the hypothesised direction, because lower absolute (P= 0·04) and energy-adjusted (P = 0·03) protein were predictive of earlier menarche (Fig. 2). Other significant effects were detected for percentage fat (P = 0·009) and the interaction terms for absolute protein × carbohydrate (P = 0·005) and absolute protein × fat (P = 0·002), representing a higher intake of both non-protein macronutrients in earlier menstruating girls. Our overall model which adjusted for key confounders yielded similar findings, with lower PE:NPE strongly predicting earlier menarche (P = 0·008; Table 2). Animal protein intake did not show a significant relationship with menarcheal onset (data not shown).
Table 2. Generalised additive models assessing macronutrient intake on age at menarche†
Ref., reference; AIC, Akaike information criterion; CHO, carbohydrate; PE:NPE, protein energy:non-protein energy ratio; zBMI, BMI z-score.
* P < 0·05, ** P < 0·01, *** P< 0·001.
† All models were fitted using the Gaussian distribution.
‡ Rank score for mother’s occupational prestige.
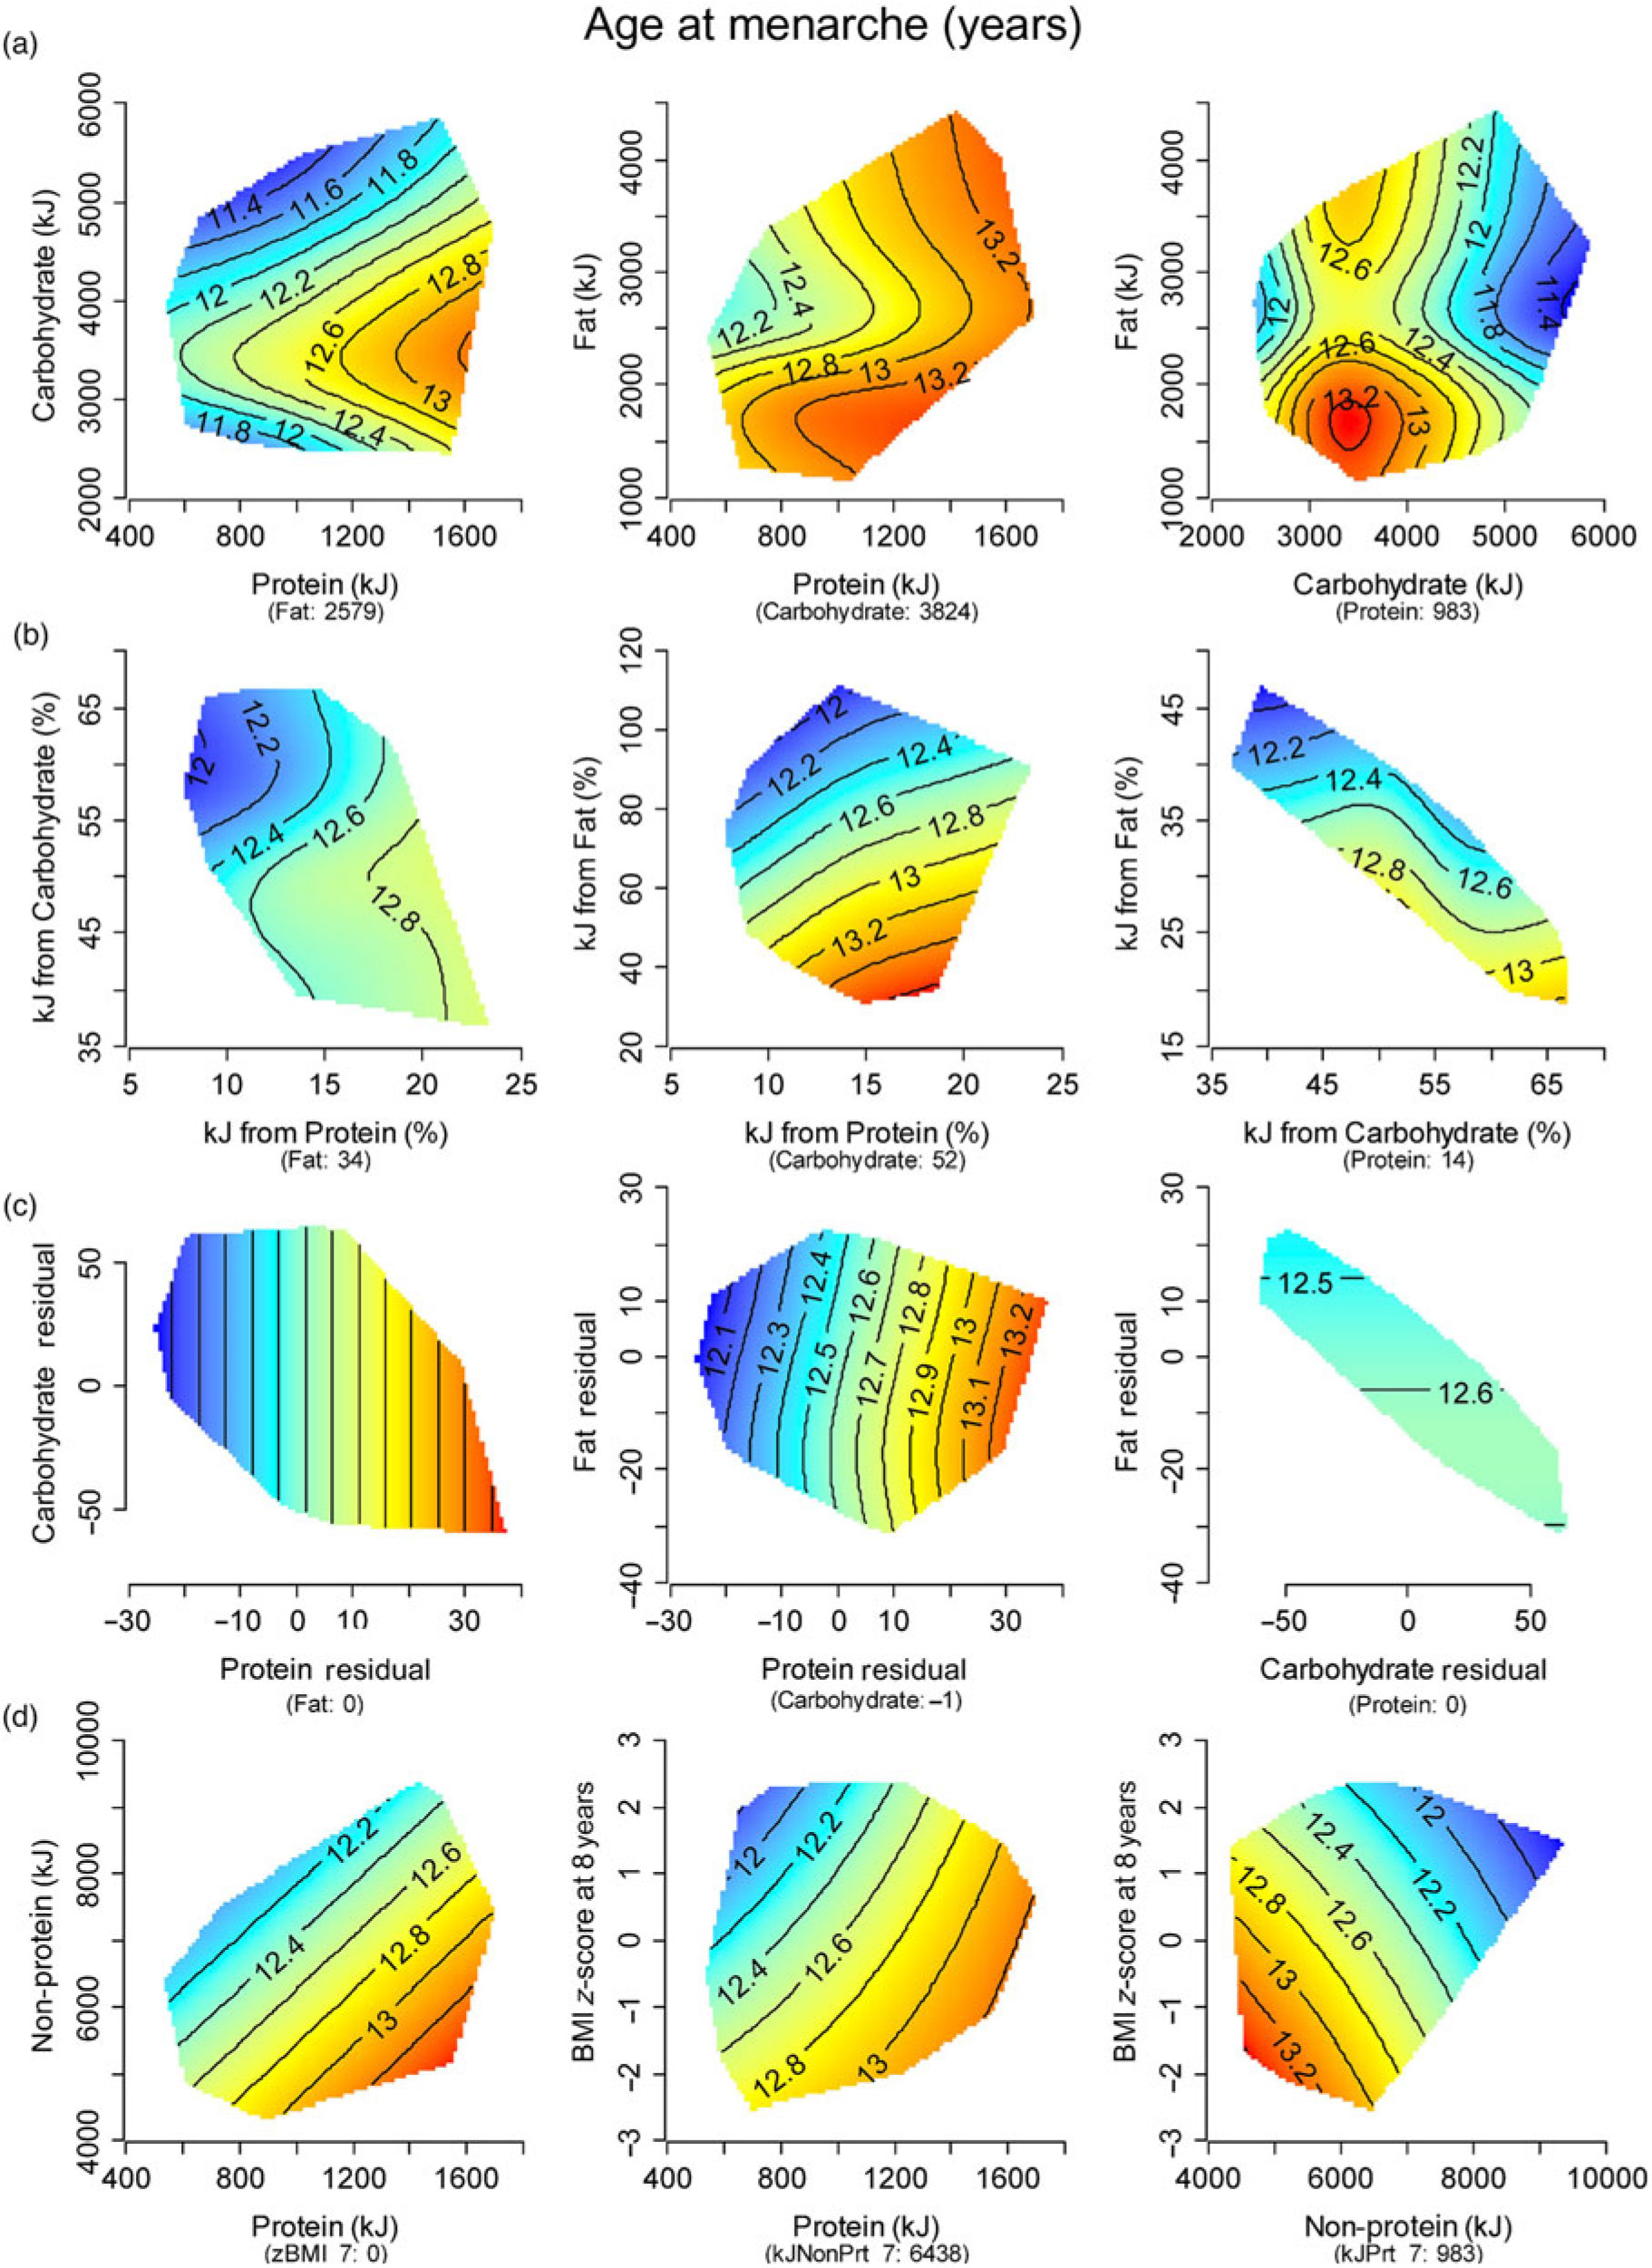
Fig. 2. Response surfaces showing the relationship between timing of menarche and: (a) absolute macronutrients (kJ/d); (b) percentage macronutrients (% energy/d); (c) energy-adjusted macronutrient residuals; and (d) protein/non-protein intake (kJ/d) and BMI z-score (zBMI). Three two-dimensional (2D) slices are presented to show the interactive effects of all three macronutrients. In each 2D slice, the third factor is set at its median (shown in parentheses beneath the x-axis labels). Areas in blue represent the earliest maturers. Those with progressively later menarche are represented by the colour shift from blue to red.
Application of the NG procedure to breast development timing scores showed that lower protein intake predicted earlier age at B3 (Fig. 3). This observation was supported statistically by a significant main effect of absolute (P = 0·036) and percentage (P = 0·009) protein, and a non-significant trend for energy-adjusted protein (P = 0·070; online Supplementary Table S1). Evaluation of tempo scores revealed a significant association for lower percentage protein (P = 0·046) and higher absolute carbohydrate intake (P = 0·002) to faster breast development (online Supplementary Fig. S3). Adjustment for confounding in the overall models did not alter these findings, as lower PE:NPE remained significantly predictive of earlier age at B3 (P = 0·006; online Supplementary Table S1) and faster tempo (P = 0·031; online Supplementary Table S2). Lower absolute (P = 0·013), percentage (P = 0·010) and energy-adjusted intake of animal protein was significantly associated with faster breast development tempo (P = 0·007; online Supplementary Table S3 and Fig. S4).
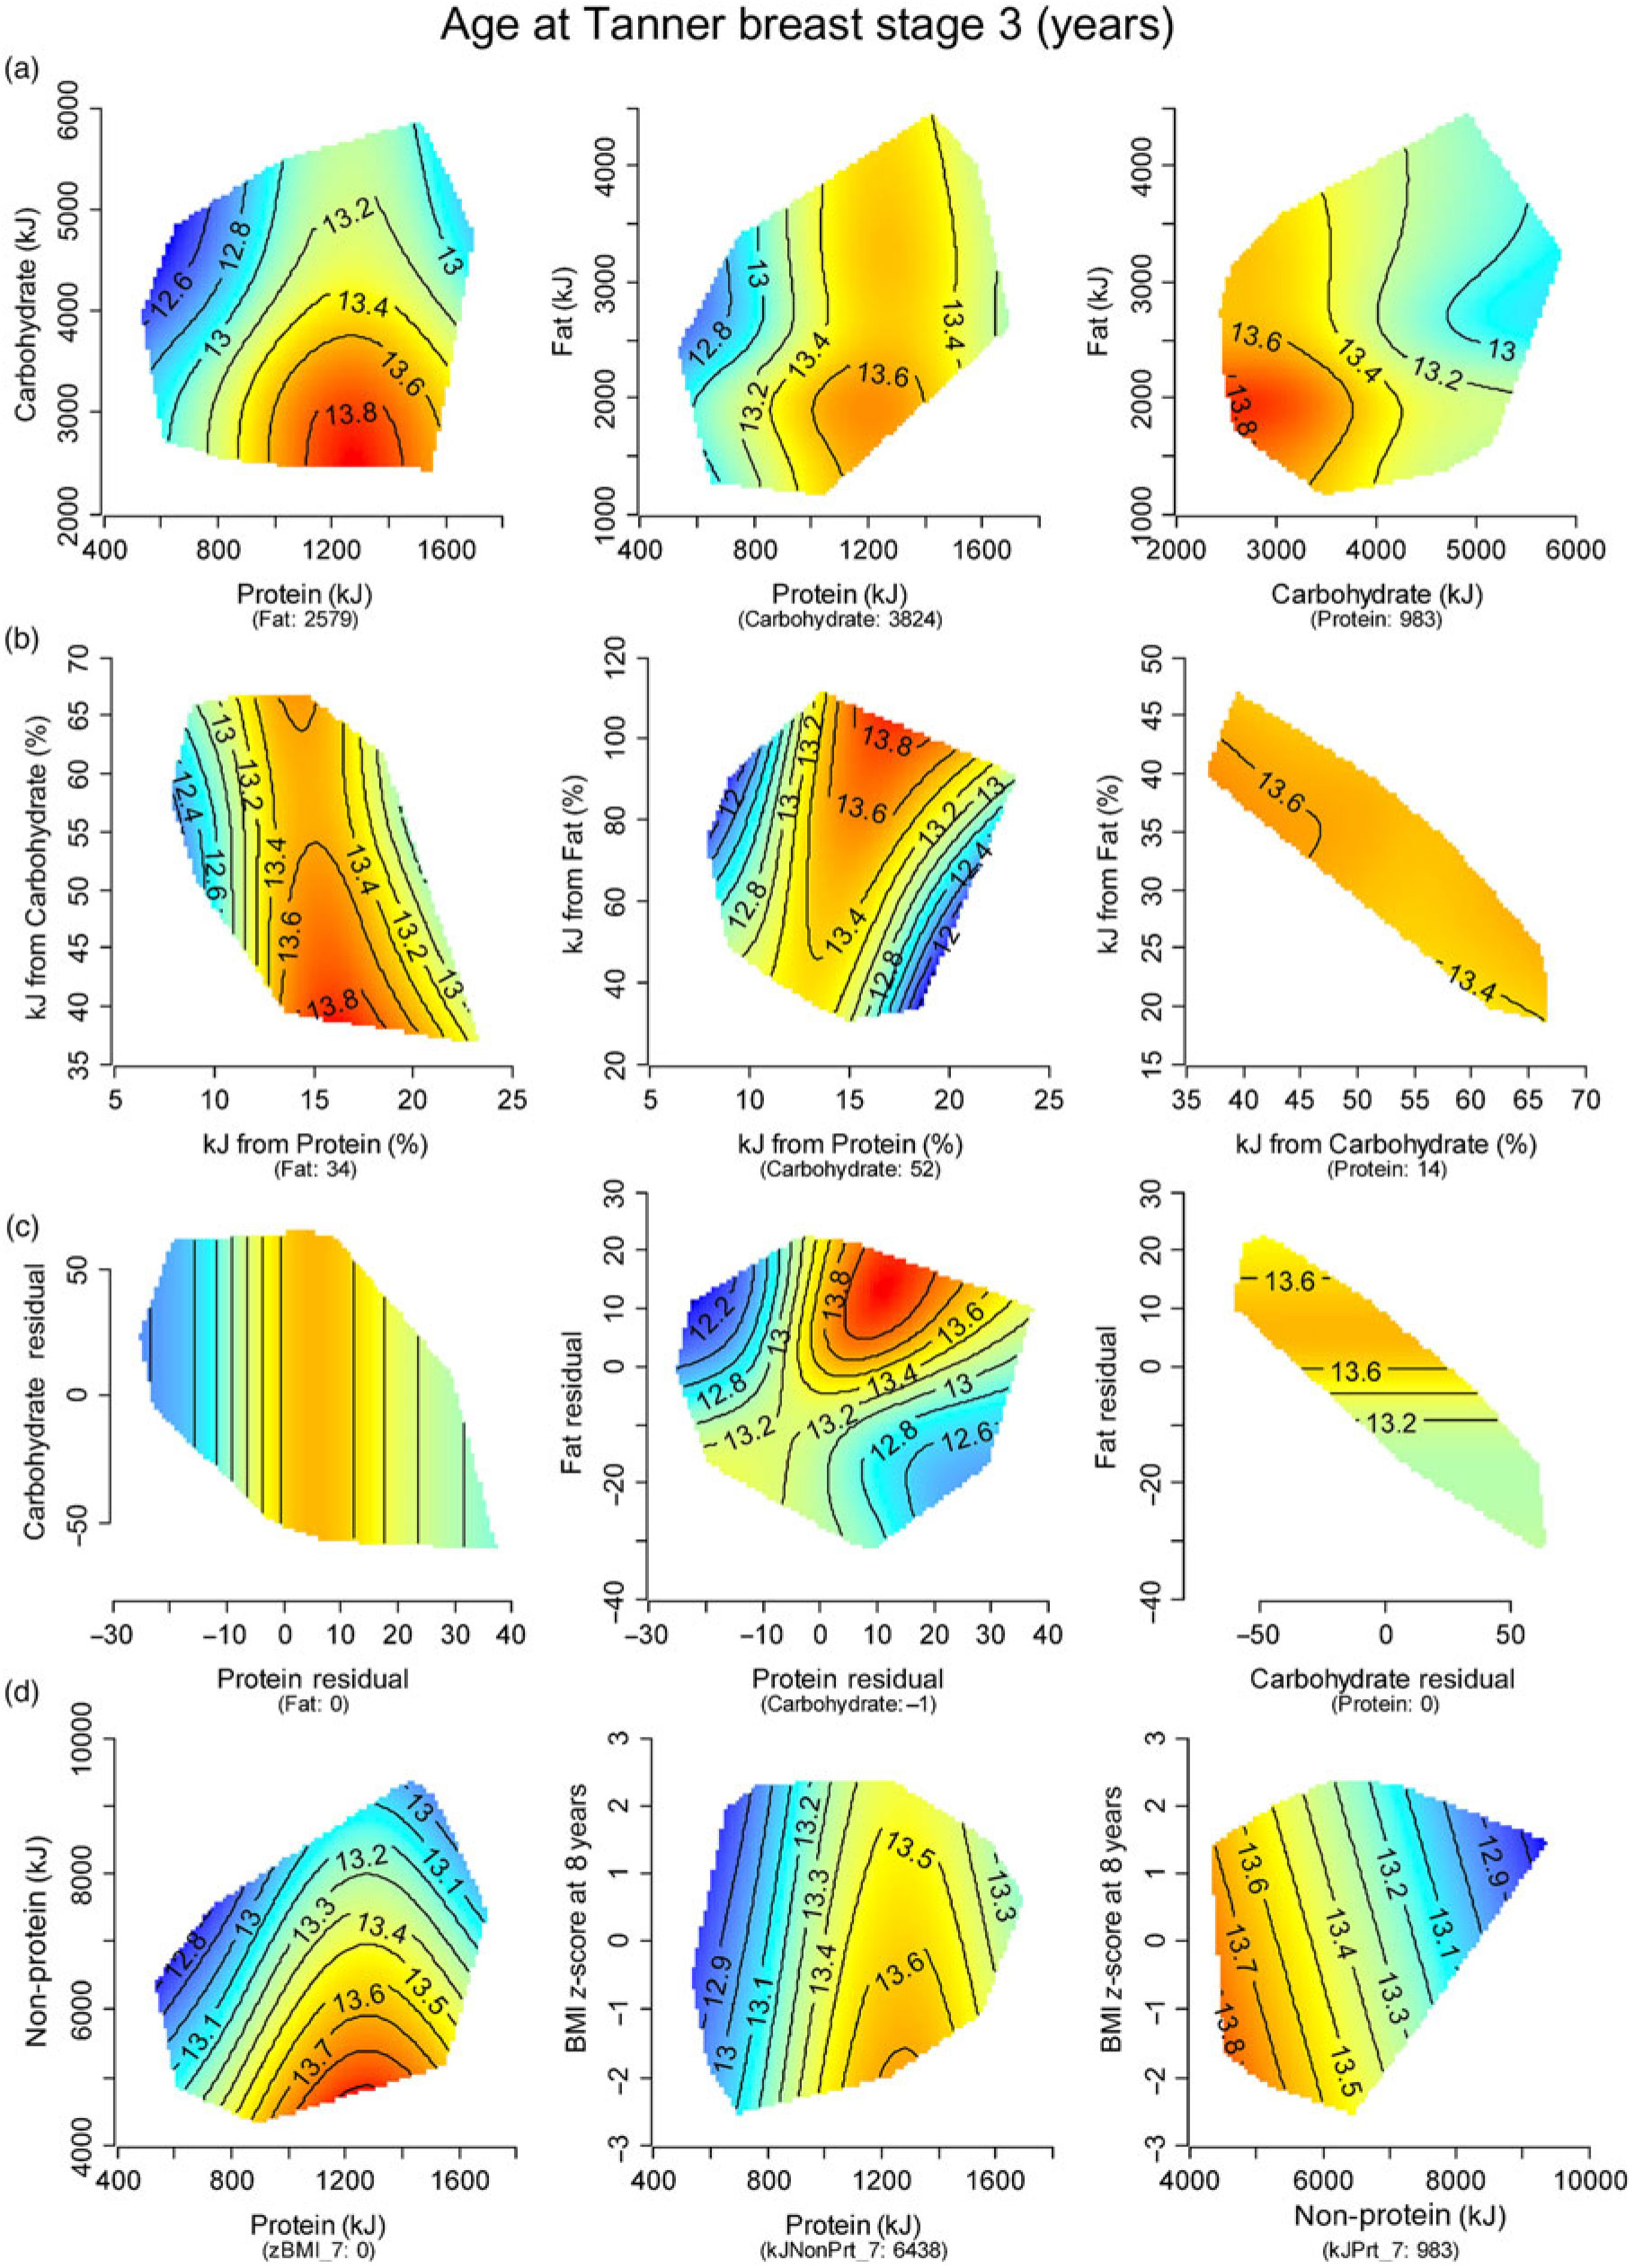
Fig. 3. Response surfaces showing the relationship between timing of breast development (age at Tanner stage B3) in girls and: (a) absolute macronutrients (kJ/d); (b) percentage macronutrients (% energy/d); (c) energy-adjusted macronutrient residuals; and (d) protein/non-protein intake (kJ/d) and BMI z-score. Three two-dimensional (2D) slices are presented to show the interactive effects of all three macronutrients. In each 2D slice, the third factor is set at its median (shown in parentheses beneath the x-axis labels). Areas in blue represent the earliest maturers. Those with progressively later age at B3 are represented by the colour shift from blue to red.
No significant associations were detected between the macronutrient variables and timing (online Supplementary Table S4 and Fig. S5) and tempo (online Supplementary Table S5 and Fig. S6) scores for male genital development. Similarly, no significant animal protein effects were observed for male pubertal timing and tempo scores (data not shown).
Macronutrient associations with pubertal outcomes via linear regression
Linear models adjusted for confounding showed no significant main effects for the three macronutrients on age at menarche, or the timing and tempo scores for breast and genital development (online Supplementary Table S6). Additional testing of interaction terms (interactions were not assessed in prior studies) showed significant two- and three-way interactions for menarcheal age (protein × carbohydrate × fat: P = 0·037) and age at B3 (protein × carbohydrate: P = 0·025; protein × fat: P = 0·003).
Discussion
In recent years, the growing use of NG in animal research has led to a paradigm shift in understanding how macronutrient intake influences lifespan and reproduction trade-offs. Application of this work to human data is in its infancy. As such, we sought to use NG to examine whether children consuming a higher-protein, lower-carbohydrate diet would experience an earlier and faster puberty. Our analyses in girls revealed associations that were contrary to our hypotheses. Furthermore, adjustment for confounding strengthened these unexpected results. Several potential explanations for our findings are discussed, which highlight clear knowledge gaps that remain around understanding nutrient balance with respect to human reproductive maturation.
Across various measures of macronutrient intake, our results consistently showed that a diet lower in protein, relative to both non-protein macronutrients, was predictive of earlier age at menarche and B3. A further finding was the association of lower total and animal protein to faster breast development, suggesting a potential impact of both macronutrient balance and protein source on pubertal tempo which has not been described previously. Overall, our observations align with the secular decrease in timing of thelarche and possibly menarche over the past century(Reference Sorensen, Mouritsen and Aksglaede38), together with evidence of increasing protein dilution in the modern food supply(Reference Raubenheimer, Machovsky-Capuska and Gosby39). Our data also support research describing a relationship between earlier menarche and excessive sugar-sweetened beverage consumption (protein intake was proportionately lower irrespective of BMI), which may be related to increased insulin secretion and gonadal/growth hormone bioavailability(Reference Carwile, Willett and Spiegelman40). Nevertheless, we are aware our findings contradict several NG and non-NG studies, the results of which were used to formulate our hypothesis.
A number of studies using linear regression have reported an earlier growth spurt and menarche among children with higher total and/or animal protein intake (measured at various ages between 3 and 7 years)(Reference Gunther, Karaolis-Danckert and Kroke12–Reference Kissinger and Sanchez16). Comparison of our Nepean cohort to these prior studies showed similar participant characteristics, research protocols and outcome variables, meaning that our discordant findings are most likely attributed to the mode of data analyses. Despite such evidence to support a facilitatory effect of protein on maturation, however, a substantial body of research has described null findings consistent with our regression analyses(Reference Maclure, Travis and Willett17–Reference Petridou, Syrigou and Toupadaki21). Significant two- and three-way interactions we observed also indicate some degree of non-linearity in the macronutrient–puberty relationship. This non-linearity was clearly illustrated through the NG methodology but not in the regression models.
To date, studies of macronutrient balance using NG have primarily been limited to animals. Earliest findings from Drosophila studies were largely contradictory to the present research(Reference Lee, Simpson and Clissold5, Reference Skorupa, Dervisefendic and Zwiener6). Later experiments in rodents showed less definitive results, as some (uterine mass and ovarian follicles) but not all reproductive markers (number of oestrous cycles and recent ovulations) were maximised on a high dietary protein to carbohydrate ratio(Reference Solon-Biet, Walters and Simanainen8). At present, the evidence most concordant with our work originates from non-human primates – a group of animals taxonomically similar to humans with comparable reproductive traits including menstrual cycle and gestation length and non-seasonal mating and births(Reference Knott, Emery Thompson and Wich41, Reference Saltzman, Tardify, Rutherford, Norris and Lopez42). Observational studies of wild mountain gorillas have reported a strong dietary preference for fruit (a rich source of easily digestible sugars) when these are available above leaves (a rich source of protein)(Reference Rothman, Raubenheimer and Chapman43, Reference Hanya and Chapman44). Fruit availability, in turn, has consistently been shown across primate species to be a key determinant of fertility and population density(Reference Knott, Emery Thompson and Wich41, Reference Hanya, Stevenson and van Noordwijk45). Collectively, these lines of evidence indicate an important role of NPE in primate reproduction, lending support to the accelerated puberty we observed in our girls with lower PE:NPE. A number of caveats are, however, important to this interpretation. Firstly, fertility does not necessarily equate to reproductive maturation. Secondly, food shortages may be less relevant for humans (at least in developed societies) who have consistent access to all macronutrients throughout the year.
The present study represents one of three cohorts to have assessed macronutrient intake in relation to male puberty(Reference Gunther, Karaolis-Danckert and Kroke12, Reference Remer, Shi and Buyken13, Reference Alimujiang, Colditz and Gardner46). Historically, boys are under-represented in the literature due to the lack of a menarche-equivalent event that signifies achievement of reproductive competence. In our analyses, we modelled timing and tempo of self-reported genital change and found no association with the macronutrient variables. This result is in partial agreement with a German and US study that found higher dietary protein in childhood was consistently predictive of earlier height take-off and peak height velocity(Reference Gunther, Karaolis-Danckert and Kroke12, Reference Alimujiang, Colditz and Gardner46), but not timing of voice-break(Reference Gunther, Karaolis-Danckert and Kroke12). Height take-off and peak height velocity are, respectively, early (G2) and later (G3-4) pubertal events controlled by synergistic changes in growth and gonadal hormone levels(Reference Marshall and Tanner47, Reference Tinggaard, Mieritz and Sorensen48). This is in contrast to the voice-break which occurs at G3-4 and is primarily driven by the rise in testosterone(Reference Harries, Walker and Williams49). Given our male timing measure (age at G3) is similar in both chronology and hormone regulation to voice-breaking, the null associations we observed may represent a true sex-related difference. Other limitations of small sample size, pubertal and dietary self-report and infrequent follow-up cannot be ruled out, which could also explain the lack of significant findings among boys.
This study explored the use of NG in analysing relationships of macronutrient balance to pubertal maturation. NG has major strengths in that it provides an integrated approach to studying the complex nutrient interactions that are not captured by conventional regression methodologies. Other strengths of this study include multiple pubertal timing proxies in girls, and the use of non-linear models to describe puberty. The primary limitation of this study is the infrequent follow-ups, which potentially reduced our capacity to accurately describe pubertal trajectories within a logistic model framework. Despite this, our estimates for age at B3 were significantly correlated with age at menarche; the latter being our most reliable proxy for pubertal timing. These two proxies also yielded congruent findings, which add confidence to the validity of our model-derived scores as well as the new macronutrient associations identified for pubertal tempo. Other study limitations were the use of parental/self-reported dietary and pubertal data (reporting bias is especially common in individuals with obesity(Reference Pietilainen, Korkeila and Bogl50, Reference Shirtcliff, Dahl and Pollak51)) and the absence of analyses testing different carbohydrate types. The decision to utilise self-reported Tanner stage was driven by ethical considerations precluding clinician staging in a healthy community sample.
In conclusion, this study identified an association between lower childhood protein intake and accelerated pubertal timing and tempo in girls, including earlier menarcheal onset. While this finding is in contrast to some older studies that described a facilitatory effect of protein on maturation, our data show parallels to animal research that have found NPE to be closely tied with primate reproduction. The absence of significant findings among boys reflects either sexual dimorphism in maturation or methodological limitations. Given this study is the first to explore pubertal development using the NG framework, our results strongly warrant replication in other adolescent datasets. The complex relationship between diet and biological processes, as demonstrated in this study, also argue for wider application of NG to contemporary research of human health and development.
Acknowledgements
We thank all participants and their families for generously donating their time to the study. Acknowledgements to Dr Frances Garden for her guidance on the statistical aspects of this project including assistance with sample size calculations.
The Nepean Longitudinal Study was supported by The Children’s Hospital at Westmead Grant Research Scheme, the National Health and Medical Research Council of Australia (project grant no. 206501) and Meat and Livestock Australia. The above funders had no role in the design, analysis or writing of this article. The present study involves a secondary analysis of the Nepean study dataset, which was not supported by a specific grant from any funding agency, commercial or not-for-profit sectors. H. L. C. holds the Marie Bashir Clinical Research Fellowship in Adolescent Health, funded by the NSW Ministry of Health.
All authors designed the study; L. B. and S. G. collected the data; D. R. provided essential software for data analyses; H. L. C., D. R. and S. G. analysed the data; H. L. C., D. R. and S. G. wrote the article with critical feedback from K. S. and L. B.; H. L. C. had primary responsibility for final content. All authors read and approved the final manuscript.
There were no conflicts of interest.
Supplementary material
To view supplementary material for this article, please visit https://doi.org/10.1017/S0007114519001326


