


Introduction
Copper sulfate, phosphate and arsenate minerals are common constituents of many oxidation zones of ore deposits (e.g. Williams, Reference Williams1990), mine wastes and tailings (Sracek et al., Reference Sracek, Mihaljevič, Kříbek, Majer and Veselovský2010; Portales et al., Reference Portales, Jiménez, Michel, Amador, Mikuš, Kump and de la Rosa2015), or oxidation products of copper artefacts (e.g. Livingston, Reference Livingston1991; Karlén et al., Reference Karlén, Wallinder, Heijerickand and Leygraf2002). Their formation and fate are to a certain extent controlled by equilibrium thermodynamics. Chemical reactions, such as precipitation or transformation, determine which minerals form or persist (e.g. Magalhães et al., Reference Magalhães, de Jesus and Williams1986, Reference Magalhães, de Jesus and Williams1988; Bowell, Reference Bowell, Bowell, Alpers, Jamieson, Nordstrom and Majzlan2014). The distribution of substituting ions between the aqueous phase and solid solution is controlled by mixing parameters (e.g. Glynn, Reference Glynn1991, Reference Glynn, Alpers, Jambor and Nordstrom2000), expressed graphically by the Lippmann diagrams (Lippmann, Reference Lippmann1980). A special type of distribution is the one that involves isotopes of one element, partitioned among co-existing phases (Sharp, Reference Sharp2017). This distribution is associated with significantly smaller energies than chemical equilibria between aqueous and pure solid phases or equilibria that involve solid solutions (Sharp, Reference Sharp2017, page 3–3). Despite such tiny energy changes, the isotopic equilibria are instrumental in many areas of geosciences as they can reveal details about the geological history of various samples, their temperature of formation, or the origin of the parental solutions.
In this work, we have determined isotopic fractionation factors for H, O, S and Cu between an aqueous phase and the minerals brochantite [Cu4(SO4)(OH)6], libethenite [Cu2(PO4)(OH)] and olivenite [Cu2(AsO4)(OH)]. They were selected as common representatives of the copper sulfate, phosphate and arsenate minerals, respectively, in environments where there is weathering of copper ores or their products. All three minerals were synthesised under controlled conditions in the laboratory at various temperatures and their isotopic composition was determined by mass spectrometry. A few natural libethenite samples were analysed together with the suite of synthetic samples and the isotopic composition of their parental waters was estimated from the newly determined fractionation factors. Simple chemical forward models were coupled with isotopic fractionation factors for copper to document possible fluctuations in the Cu isotopic composition of aqueous fluids at near-surface temperatures.
Materials
Syntheses of olivenite and libethenite
Preliminary syntheses of both phases were carried out at 30–80°C to determine the optimal conditions, phase-pure yield, and the amount of chemicals needed to carry out the syntheses successfully. For the syntheses of olivenite and libethenite, the following chemicals were used: Cu(NO3)2⋅3H2O, Na2HAsO4⋅7H2O, NaH2PO4⋅2H2O and NaOH. At the beginning of the experiments, 1.566 g Cu(NO3)2⋅3H2O and 1.01098 g Na2HAsO4⋅7H2O (for olivenite) and 1.566 g Cu(NO3)2⋅3H2O and 0.5054 g NaH2PO4⋅2H2O (for libethenite) were weighed. Each chemical was dissolved separately in 10 mL of deionised water. In addition, a stock solution of 0.3 M NaOH was prepared.
The prepared solutions were heated separately in borosilicate flasks to the desired temperature on a heating plate. Once the temperature was reached and stabilised, the phosphate/arsenate solution was poured into the copper solution. A light blue precipitate formed immediately and remained in the mixture. The solutions were strongly acidic, ≈2.2 for Cu/As and ≈2.6 for Cu/P. The stock NaOH solution was used to adjust pH to 3.0, using a pH electrode.
The suspensions were placed in heating cabinets at a constant temperature. One week was sufficient for temperatures 50 to 80°C. At 30°C, the time necessary to reach a crystalline product was ~3 weeks. Thereafter, the solutions remained clear, with light blue colour. The product was green (libethenite) or light-green to beige (olivenite). The solid was filtered, washed with deionised water, and air dried.
The samples for the determination of isotopic fractionation factors were synthesised in a similar manner. For their syntheses, however, larger volumes of stock solutions of all chemicals were prepared before the start of the experiments and were stored tightly sealed in borosilicate (Cu, P and As solution) or plastic (NaOH solution) bottles. The goal was to maintain a constant isotopic composition of the parental solutions for all of the experiments. The volume of the NaOH solution, necessary to raise pH to 3.0, was determined in the preliminary experiments. During this experiment series, pH was not monitored. The flasks were placed in a thermostat with temperature control precision of ±0.5°C, with a set point between 30 and 70°C with 10°C steps.
Syntheses of brochantite
Preliminary syntheses of brochantite were carried out in the temperature range 40 to 80°C with a step of 5°C. For these syntheses, the following chemicals were used: CuSO4⋅5H2O and NaOH. Initially, 0.04 grams of CuSO4⋅5H2O and 0.32 grams of NaOH were weighed out. Each chemical was dissolved separately in 40 mL deionised water to produce 0.004 M CuSO4 and 0.2 M NaOH solutions.
The solutions were heated separately on a heating plate to the desired temperature. After the temperature was reached and stabilised, the NaOH solution was added dropwise up to pH of 6.2. During this titration, turquoise precipitate formed immediately and did not re-dissolve. Once the end pH was reached, the suspension was filtered through filter paper and the filtrate allowed to air dry.
The samples for the determination of isotopic fractionation factors were synthesised in a similar manner. Larger volumes of stock solutions were prepared and used throughout these syntheses, but in a thermostat with temperature control to ±0.5°C. The stock solutions were 0.08 M CuSO4 and 0.3 M NaOH solution.
Natural samples
A few natural samples were collected near the village of Ľubietová, at a site called Podlipa. This site is the type locality of libethenite and this mineral, together with other phosphates and carbonates of copper, can be found in abundance in the old mining dumps. The samples used in this study were grab samples with visible libethenite crystals and druses. The precise location of these samples in the oxidation zone at Ľubietová-Podlipa is not known.
Methods
Powder X-ray diffraction (pXRD) patterns of all samples were collected with a Bruker D8 Advance DaVinci diffractometer employing CuKα radiation (λ = 1.54058 Å). The patterns were collected at room temperature between 5 and 90°2θ, with a step size of 0.02°2θ, and a time per step of 1.0 s.
Oxygen isotopes were measured on an isotope ratio mass spectrometer (IRMS) MAT253 at the Slovak Academy of Sciences, Banská Bystrica, Slovakia, using an automated carbonate preparation system (KIEL IV) coupled to IRMS in dual-inlet mode. Powdered samples of ≈100 μg were heated overnight at 70°C in order to remove adsorbed water. The samples were then reacted with anhydrous H3PO4 at 70°C in a vacuum. The CO2 yield was purified through two liquid nitrogen traps and introduced into the IRMS. Raw isotope values were calibrated using international reference material NBS18 with δ18O = –23.2‰ and two working standards with δ18O = –2.40‰ and δ18O = –15.30‰. The precision of the method is 0.02‰ for δ18O (based on measurements in this work). The measured values are reported as δ18OVSMOW.
Hydrogen isotopes were measured using an elemental analyser (FLASH 2000 HT plus) coupled to the IRMS in continuous-flow mode. Powdered samples of ca. 250–700 μg were filled into silver capsules and pyrolysed on glassy-carbon chips in a stream of helium at 1400°C. Evolved H2 was purified from other gases on a packed chromatographic column (5 Å molecular sieve) and led into IRMS. The δD values were calibrated by international reference materials USGS 57 and USGS 58 with δD = –91.5 ± 2.4 and –28.4 ± 1.6‰, respectively (Qi et al., Reference Qi, Coplen, Gehre, Vennemann, Brand, Geilmann, Olack, Bindeman, Palandri, Huang and Longstaff2017). The precision of the method is 3‰ for δD, values are reported as δDVSMOW.
Sulfur isotopes were measured on a mass spectrometer MAT253 coupled with the elemental analysis device Flash2000 HT plus (Thermo Scientific) in a continuous-flow mode. Powdered samples of ca. 800–950 μg of brochantite were wrapped into tin capsules with the same amount of V2O5. After flushing with helium, they were combusted in a packed quartz glass reactor at 1000°C in a stream of oxygen. Evolved gases were carried by helium through WO3 and copper for purification, magnesium perchlorate for water trapping and chromatographic column for separation of SO2 from other gases, and further into mass spectrometer. The sample SO2 peak was preceded by two injections of reference SO2 gas against which the isotope composition is measured. Raw values were corrected by four-point calibration using international standards IAEA-S2, IAEA-S3, IAEA-SO6 and NBS–127 with δ34S values +22.70, –32.30, –34.10 and +20.30‰ CDT, respectively. All the values are reported as per mil versus CDT, long-term external precision is 0.21‰.
Copper isotopes were measured on a Neptune plus multicollector mass spectrometer at Washington State University. As all the solid and solutions analysed were copper rich, no ion exchange chromatography was needed (Mathur et al., Reference Mathur, Ruiz, Titley, Liermann, Buss and Brantley2005; Zhang et al., Reference Zhang, Bao, Lv, Chen, Zong and Yuan2020; Zhu et al., Reference Zhu, O'Nions, Guo, Belshaw and Rickard2000). Solids were dissolved in 4 ml of ultrapure aqua regia in 15 ml Teflon vials that were heated to 80°C overnight. Solutions were diluted to 150 ppb Cu and measured in wet plasma mode in low resolution. Mass bias was corrected for using standard sample bracketing with NIST 976. All values are reported relative to the NIST 976 in the traditional per mil unit (‰). Blanks on-peak were subtracted, one block of 35 ratios was measured and values were measured in duplicate. All duplicates fell within error reported below. An internal USA cent standard produced δ65Cu = +0.02 ± 0.06‰ (2σ, n = 12) and lies within error of previously reported values in Mathur et al. (Reference Mathur, Titley, Hart, Wilson, Davignon and Zlatos2009). The NIST 976 standard varied by ±0.08‰ (n = 46) and is considered the conservative estimate of the error for the analyses.
Results
The samples synthesised for the investigation of isotopic fractionation were phase-pure, with sharp XRD peaks (see Supplementary Fig. S1). The refined lattice parameters show no correlation with the synthesis temperature, as expected (Tables 1–3). Examination of the samples, either in air or in oil suspensions, under transmitted polarised light showed no impurities (Fig. 1a). The synthetic protocols were optimised in a number of experiments, many of them yielding mixtures of phases (Fig. 1b). The material used in this study, however, was free of impurities.
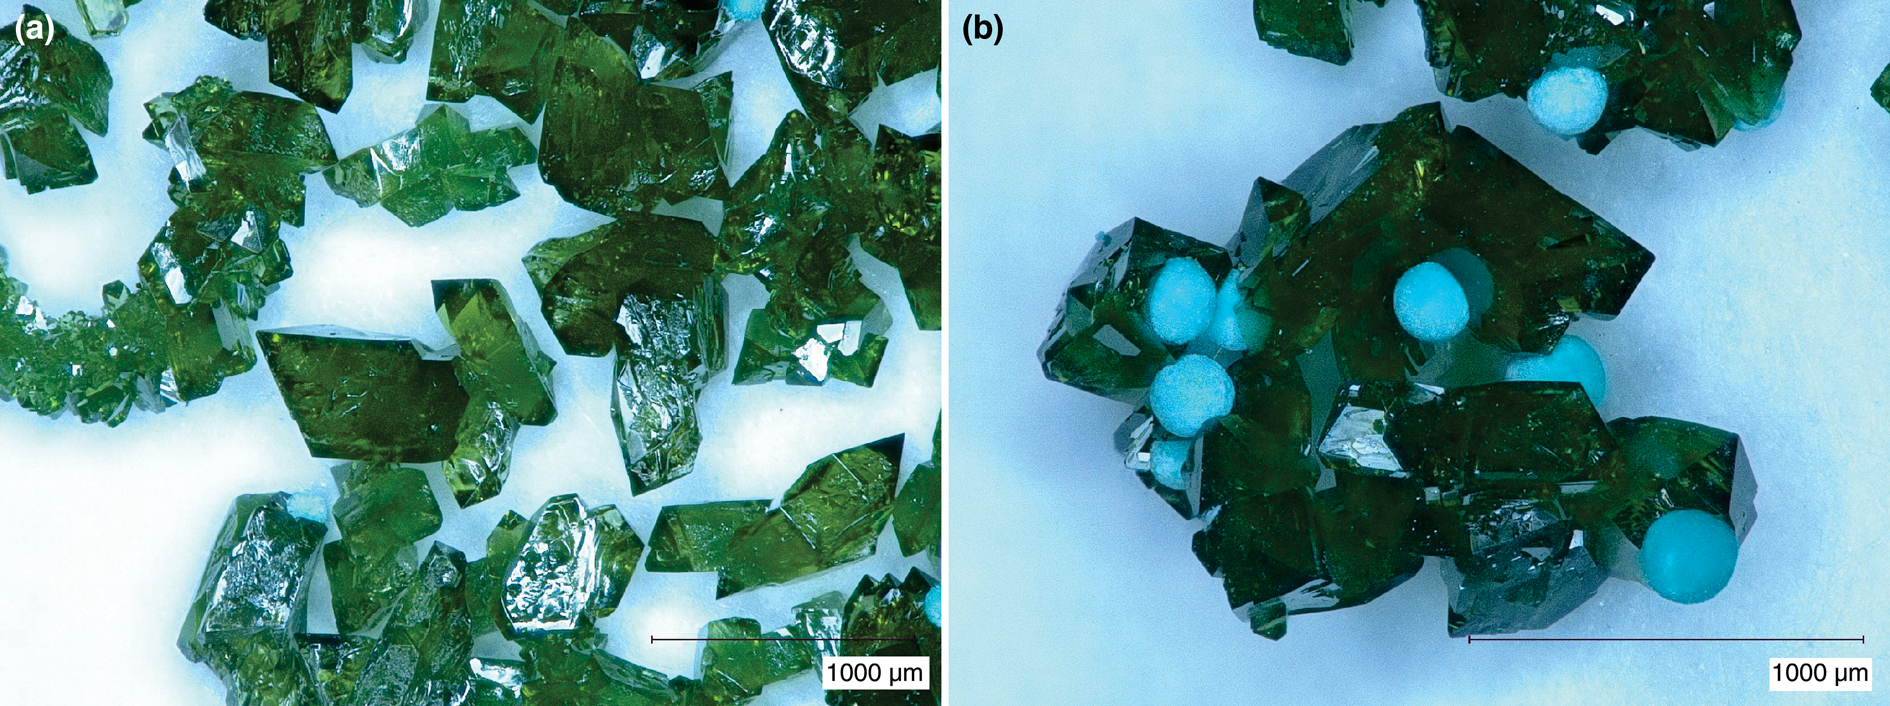
Fig. 1. Photographs of synthesis products from a binocular microscope. (a) Libethenite crystals, phase-pure sample; (b) libethenite crystals contaminated by spherical aggregates of pseudomalachite.
Table 1. Isotopic composition and lattice parameters (a, b, c in Å, β in °, V in Å3) of brochantite samples synthesised at various temperatures. Space group P121/a1.
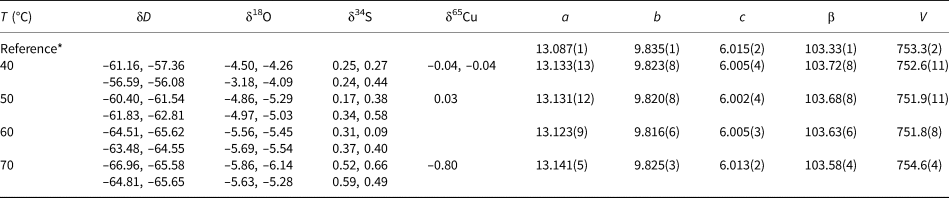
* The reference structural model is taken from Helliwell and Smith (Reference Helliwell and Smith1997).
Table 2. Isotopic composition and lattice parameters (a, b, c in Å, V in Å3) of the libethenite samples synthesised at various temperatures. Space group Pnnm.
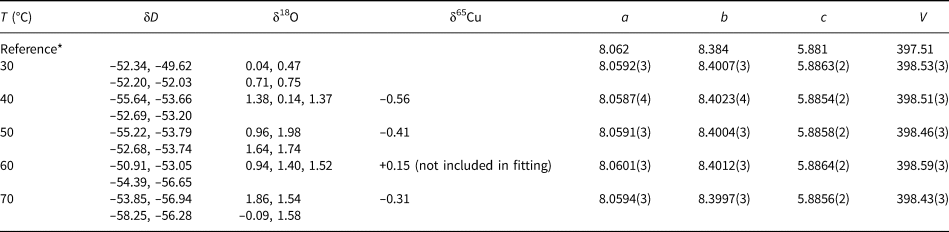
* The reference structural is model taken from Cordsen (Reference Cordsen1978).
Table 3. Isotopic composition and lattice parameters (a, b, c in Å, α in °, V in Å3) of the olivenite samples synthesised at various temperatures. Space group P21/n11.
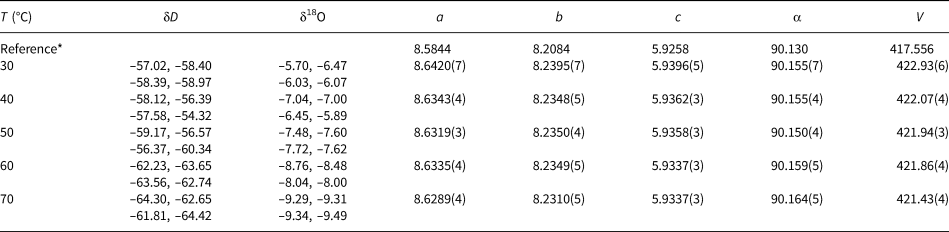
* The reference structural model is taken from Li et al. (Reference Li, Yang and Downs2008).
Infrared and Raman spectroscopy (Supplementary Figs S2–S4) confirmed the absence of impurities. The spectral features could all be assigned to the mineral that was synthesised. There were no significant differences among the spectra of individual minerals when synthesised at different temperatures.
Isotopic composition of synthetic and natural samples
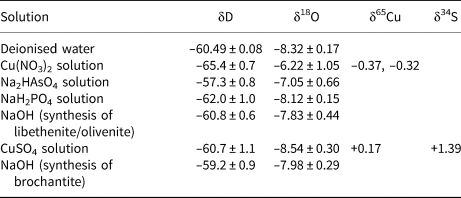
The isotopic composition of the solutions used for the syntheses of the phases considered here is listed in Table 4. All starting solutions were prepared from deionised water and the variations in the δD and δ18O values are due to the isotopic composition of the dissolved solids. The difference is especially marked for the Cu(NO3)2 solution. This chemical, as are many nitrates, is hygroscopic and was absorbing water vapour from the air over longer periods of time. For the calculation of the starting isotopic composition (for O and H), we used weighted averages of the values in Table 4, according to the synthesis protocols.
Table 4. Isotopic composition of the solutions used for syntheses of brochantite, libethenite and olivenite.
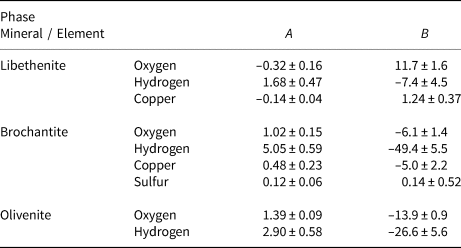
The isotopic compositions of the solid products are listed in Tables 1–3. The measured isotopic composition for the individual phases considered in this work is plotted in Fig. 2 in 1000/T versus 1000 ln α space. The results of the linear fits, including uncertainties, are given in Table 5.
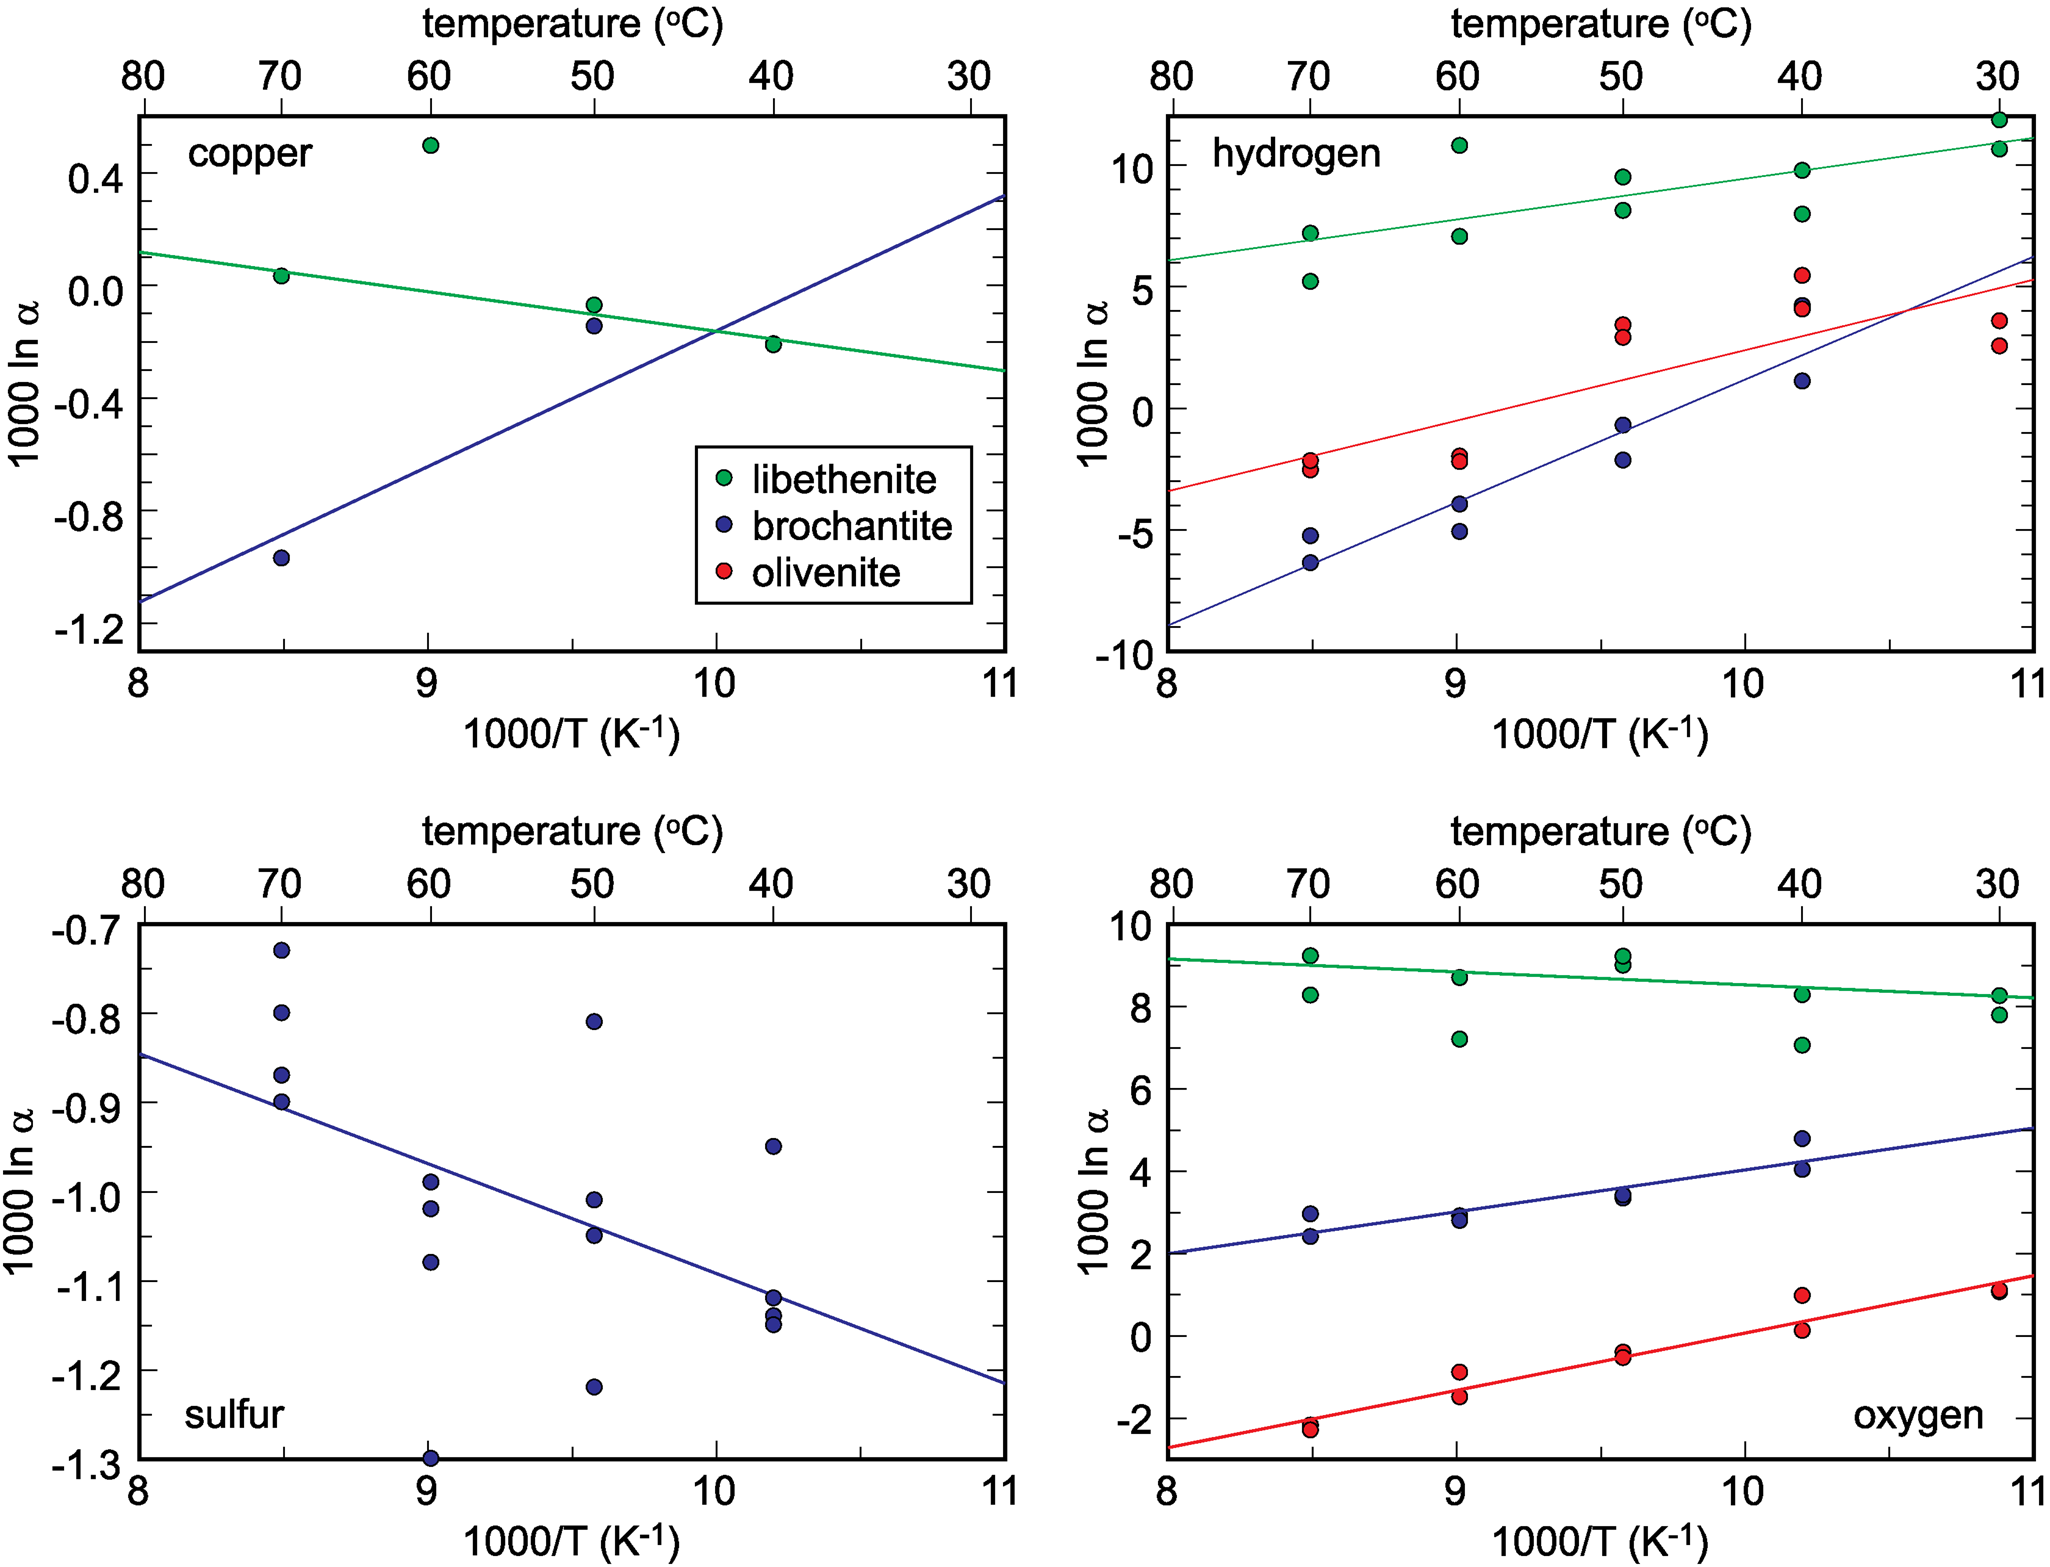
Fig. 2. Isotopic composition of the synthetic samples studied, plotted as a function of temperature and recalculated to the 1000 ln α factors. The lines show the fits whose parameters A and B are listed in Table 5. Note that the copper isotope composition for libethenite at 60°C was considered to be an outlier and not included in the fits. The copper isotope composition for libethenite and olivenite at 40°C overlap and only one symbol is visible.
Table 5. Empirical parameters A and B for the fractionation equation 1000 ln α = (A × 106/T2) + B for different elements in the minerals studied.
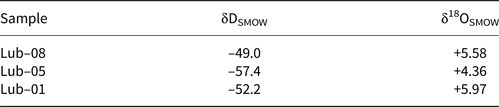
The isotopic composition of the libethenite samples from the dumps at Ľubietová-Podlipa is listed in Table 6. The samples show some scatter but, because they originate from the old dumps, that scatter cannot be correlated to the position of these samples in the oxidation zone.
Table 6. Isotopic analyses of natural libethenite crystals from the dumps at Ľubietová-Podlipa.
Discussion
The role of precursors and isotopic equilibrium
The syntheses performed in this work shared a common feature that after initial and rapid mixing of the solutions, fine-grained precipitate formed and slowly transformed to the final product. The nature of the precipitate was not investigated further. For malachite, Melchiorre et al. (Reference Melchiorre, Criss and Rose1999) and Plumhoff et al. (Reference Plumhoff, Mathur, Milovský and Majzlan2021) showed that the initial precipitate in rapid syntheses is georgeite, a poorly-crystalline precursor of malachite. Thus, it must be asked whether the measured isotopic composition reflects a true equilibrium between the crystalline solids and the fluids, or if it was inherited to some extent from the precursor. It has been suggested previously that the isotopic composition may be influenced by the degree of crystallinity (O'Neil et al., Reference O'Neil, Clayton and Mayeda1969). For malachite, Plumhoff et al. (Reference Plumhoff, Mathur, Milovský and Majzlan2021) were able to show that the precursor signature persists at <50°C over the duration of the experiments. At higher temperatures, the isotopic equilibrium was reached rapidly. Melchiorre et al. (Reference Melchiorre, Criss and Rose1999) discussed the possible impact of the precursors on the δ18O values between carbonates and solutions. Both positive and negative deviations from the equilibrium fractionation can be encountered.
Many supergene minerals precipitate from gel-like precursors (O'Neil et al., Reference O'Neil, Clayton and Mayeda1969, Melchiorre et al., Reference Melchiorre, Criss and Rose1999, Majzlan, Reference Majzlan2020), and not directly from the aqueous solutions. If the formation of these precursors and their transformation to the crystalline phases are alike in the laboratory and Nature, then the fractionation factors used in this work can be used to model and understand natural processes. Conversely, it should be noted that if the formation mechanism in Nature differs from that in laboratory, our results may not be fully applicable to such natural systems.
Isotopic composition in relation to the parental fluid
The investigated minerals form in near-surface environments, during weathering of ore minerals. Therefore, the most common parental solution, from which they precipitate, is rain water. Other parental solutions are rare but known (e.g. marine water at Lavrion, Greece, Siidra et al., Reference Siidra, Krivovichev, Chukanov, Pekov, Magganas, Katerinopoulos and Voudouris2011) or low-temperature hydrothermal solutions (Haßler et al., Reference Haßler, Taubald and Markl2014).
The relationship between the isotopic composition of H and O in rain water expresses the Global Meteoric Water Line (GMWL)

The difference between the isotopic composition of a mineral and its parental solution, assuming only equilibrium fractionation, is

and

Combining and re-arranging equations (1), (2) and (3) gives
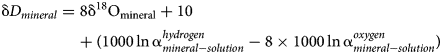
Hence, the slope of such a ‘mineral’ line is the same as the slope of GMWL, but the intercept depends on the fractionation factors, such as those derived in this study. The factors 1000 ln α are a function of temperature (Table 5). The lines that show the dependence of O and H isotopes in secondary minerals are shown in Fig. 3 for the temperature 20°C. The figure shows the expected isotopic composition of the copper minerals that precipitated in equilibrium from rain water. It is obvious that malachite deviates from the other copper secondary mineral. This deviation, however, is only related to a methodological difference. For malachite, the δ18OCO2 values were determined (Plumhoff et al., Reference Plumhoff, Mathur, Milovský and Majzlan2021), that is, the isotopic composition of CO2 that escapes from malachite upon dissolution in anhydrous H3PO4. For the phases investigated in this work, the isotopic composition of the total oxygen was measured.
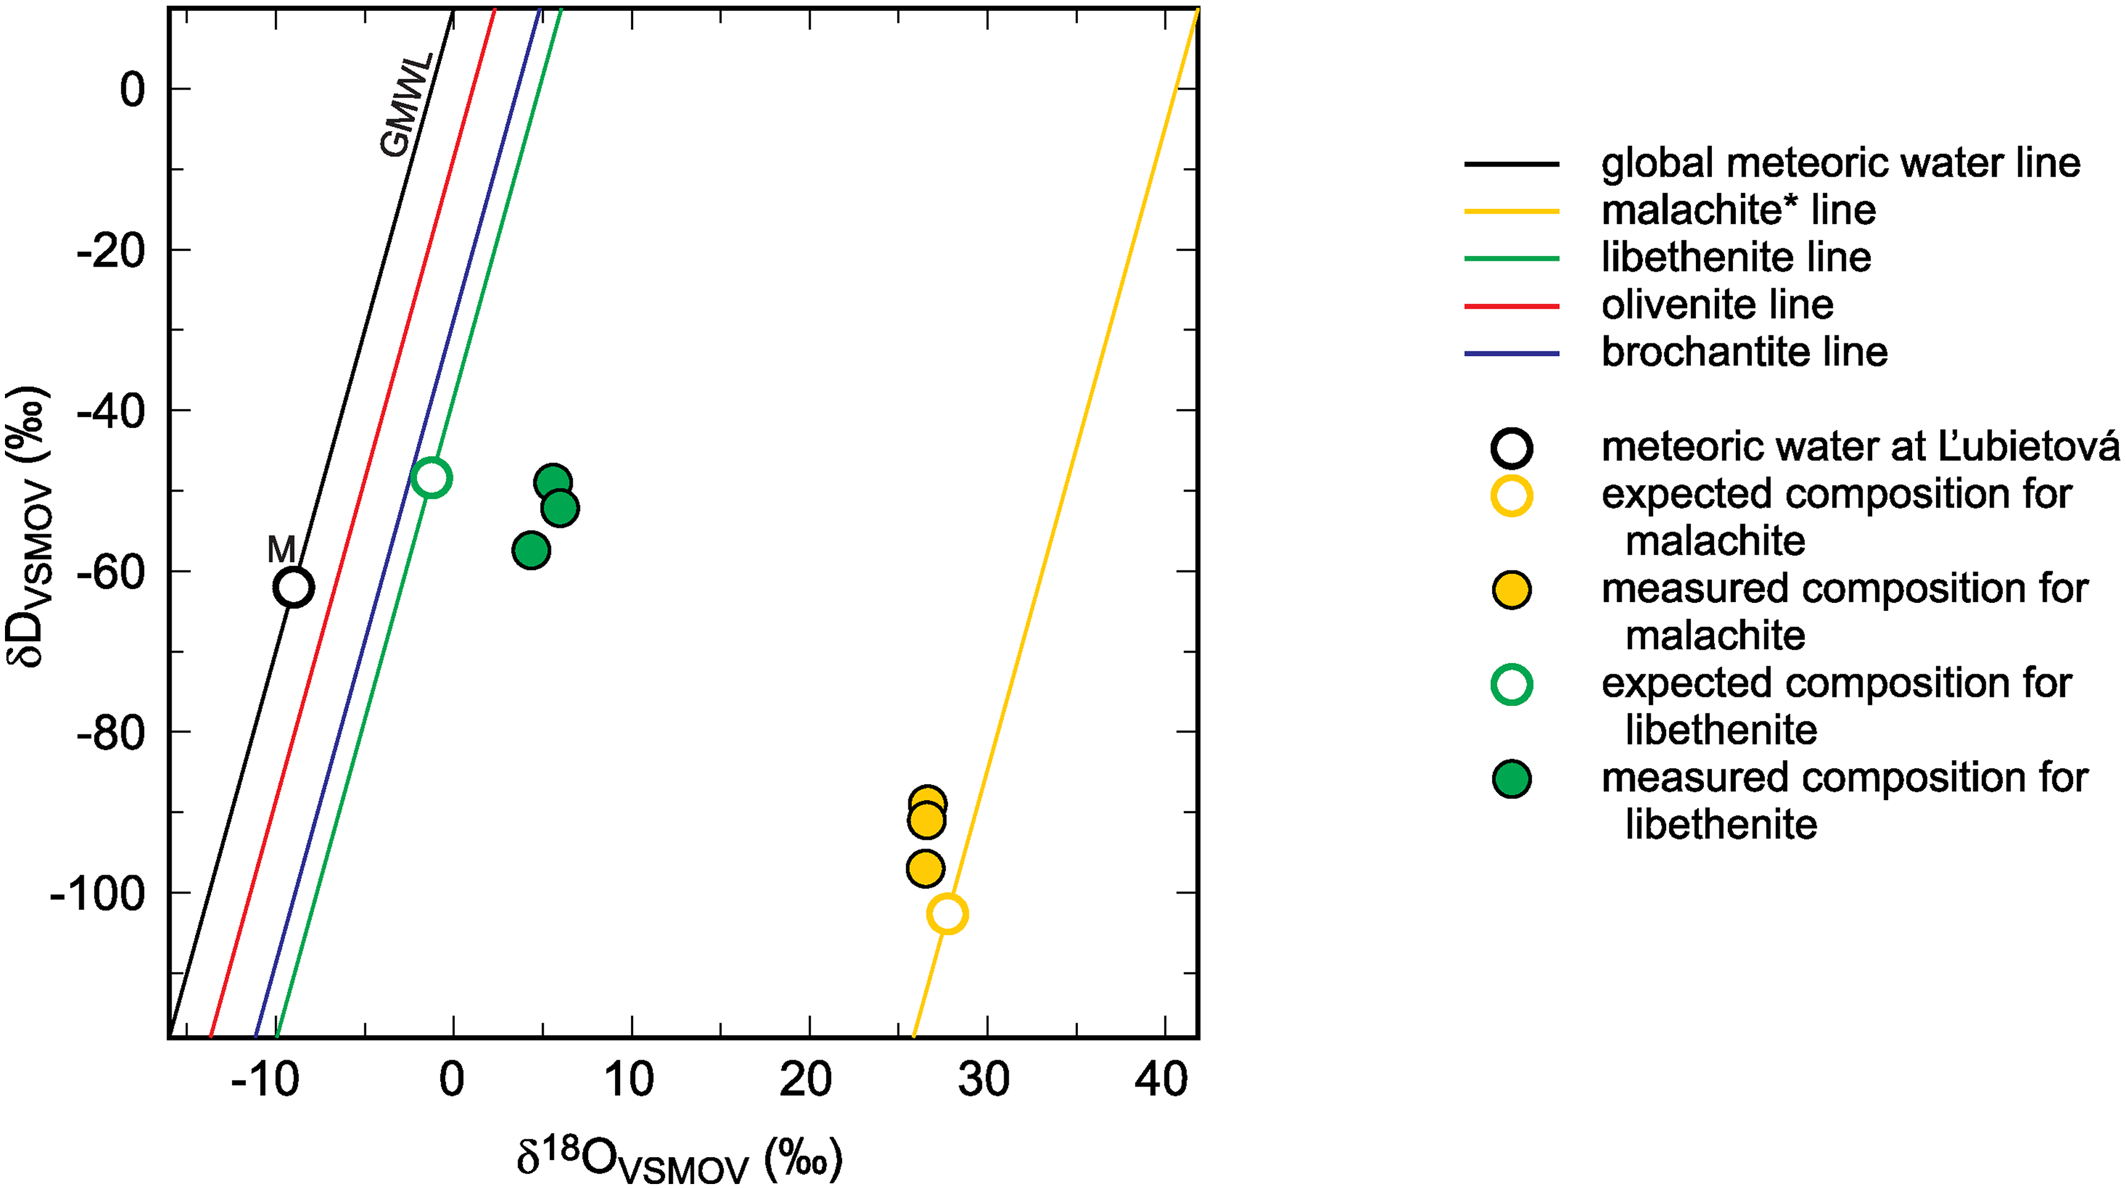
Fig. 3. Global meteoric water line (GMWL), isotopic composition of meteoric water (M) at Ľubietová, and mineral lines calculated for a set of secondary copper minerals. The diagram also shows the isotopic composition of malachite* and libethenite, calculated from the composition of meteoric water and experimentally determined fractionation factors. The expected (calculated) isotopic composition is compared to the measured data from Ľubietová. All data for malachite from Plumhoff et al. (Reference Plumhoff, Mathur, Milovský and Majzlan2021). The asterisk for the malachite isotopic composition means that δ18O values in this case are related only to the CO2 liberated during dissolution of malachite in H3PO4. For the minerals studied in this work, total oxygen was measured.
Fig. 4. Graphical representations of the forward models that simulate (a) neutralisation and (b) reduction of a neutral mine drainage solution rich in copper (see Majzlan et al., Reference Majzlan, Števko, Chovan, Luptáková, Milovská, Milovský, Jeleň, Sýkorová, Pollok, Göttlicher and Kupka2018 and Supplementary material). Chemical speciation is expressed in the bottom panels as number of moles of minerals or Cu(II) molality of the aqueous solution. The upper panels show the evolution of the δ65Cu isotopic composition of each reservoir. For details, see text.
The isotopic composition of meteoric water at Ľubietová and the measured isotopic composition (O and H) for libethenite and malachite from this site are also shown in Fig. 3 (malachite data taken from Plumhoff et al., Reference Plumhoff, Mathur, Milovský and Majzlan2021). The local meteoric water and the fractionation factors were used to calculate the expected isotopic composition for libethenite and malachite at this site. The results show that libethenite has much higher δ18O values than expected, although the δD values conform to the expected ones.
A likely explanation of the discrepancy is the isotopic disequilibrium between phosphate species and the aqueous solution (O'Neil et al., Reference O'Neil, Vennemann and McKenzie2003), either in nature or in our experiments. Hence, the oxygen fractionation factors determined in this study should be used with caution. They can be accurate but they can be also subject to systematic error because of the disequilibrium between the aqueous solution and the oxyanions (phosphate, arsenate or sulfate). Another possible explanation is the shift to higher δ18O values due to interaction with isotopically heavy country rocks. The isotopic shift of malachite (see also Fig. 3) speaks against this possibility. A more detailed study designed to address these questions at the field site at Ľubietová-Podlipa has been started already.
Isotope geothermometry
Two phases M and N that precipitate from the same parental solution in equilibrium have their isotopic composition related by the equation

For example, for the hydrogen isotopes in the pair libethenite–malachite, the equation is

Using the isotopic composition of libethenite (Table 6, this work) and malachite (Plumhoff et al., Reference Plumhoff, Mathur, Milovský and Majzlan2021) from Ľubietová-Podlipa, the calculated formation temperature is 80–90°C. Participation of low-temperature hydrothermal fluids in the ore oxidation has been proposed and documented before (Haßler et al., Reference Haßler, Taubald and Markl2014). As mentioned above, a larger study intended to elucidate the origin of the oxidation zone at Ľubietová-Podlipa has been started. One of the questions that should be attended and answered is if such elevated temperatures are feasible within the geological and mineralogical context of the site.
In order to use such an isotopic geothermometer, the evidence of coeval formation of the two minerals must be firmly established. Textural observations must clearly witness that the two minerals precipitated simultaneously, from the same fluid. Equilibrium can be only assumed as it is usually very difficult to prove. Hence, in deposits with co-eval malachite, brochantite, libethenite, or olivenite, precipitation temperature can be determined precisely and linked to the formation processes of the secondary minerals.
Fluctuations in isotopic composition of copper
The δ65Cu values do not change significantly in reactions which do not involve redox changes of copper (e.g. Plumhoff et al., Reference Plumhoff, Mathur, Milovský and Majzlan2021). When considering malachite, the mineral should have slightly lower δ65Cu than the parental solution. The same holds for libethenite, but not for brochantite (Table 5). These fractionation factors are small in comparison to the magnitude of fractionation with redox changes (Mathur and Fantle, Reference Mathur and Fantle2015, Plumhoff et al., Reference Plumhoff, Mathur, Milovský and Majzlan2021). It is therefore of interest to perform simple calculations in order to determine the possible variations in δ65Cu of the fluids when secondary copper minerals precipitate.
In systems that contain little Cu or are strongly Cu-limited (e.g. Cu << S), copper may precipitate essentially completely out of the solution. Mine drainage systems, on the other hand, may contain sufficient copper so that even after precipitation, the fluids will contain a substantial copper load with a distinct δ65Cu value. A neutral mine drainage system in Ľubietová was investigated by Majzlan et al. (Reference Majzlan, Števko, Chovan, Luptáková, Milovská, Milovský, Jeleň, Sýkorová, Pollok, Göttlicher and Kupka2018) and one of the analyses of the copper-contaminated water was adopted for further calculations.
Two forward simulations were carried out. One of them involves dissolution of calcite and increase of pH, even though the initial pH was already 6.4. This simulation is referred to as neutralisation hereafter. The other simulation is based on addition of methane into the aqueous solution, causing gradual reduction of the aqueous species. This simulation is referred to here as reduction. The simulations were carried out with the program PHREEQC (Parkhurst and Appelo, Reference Parkhurst and Appelo1999) and the molar amounts of minerals that precipitate or dissolve were written to the output files. A self-written program used these results as an input and calculated the copper isotopic composition of each phase, including the aqueous phase. The calculations were done with the assumption that minerals crystallise in equilibrium with the aqueous phase (according to the fractionation factors in Table 5). Mineral dissolution, on the other hand, was considered to be isotopically congruent, without isotopic changes.
The starting solutions in both simulations have δ65Cu of +0.2‰. During neutralisation, brochantite precipitates initially and drives the isotopic composition of the fluid to negative values, almost –1.7‰. Afterwards, brochantite dissolves and malachite precipitates and the isotopic composition of the fluid returns back to almost the initial value. If, in Nature, the calcite dissolution proceeds slowly and the fluid is removed from the precipitating minerals, it can be modified substantially from its original state, namely isotopically much lighter than at the beginning.
During reduction, a small amount of brochantite precipitates initially but dissolves quickly as the reaction proceeds. Malachite precipitates and remains during the simulation, even though the mineral dissolves slowly. Reduction causes precipitation of native copper whose amount increases with the progress of the reaction. If such reactions are allowed to proceed further, covellite will form and take up the remaining copper from the solution (in that case, final molality of Cu(II) is 10–19). In the simulation presented here, however, covellite did not form. The fractionation factor for native copper was taken from Qi et al. (Reference Qi, Behrens, Lazarov and Weyer2019), noting that this factor shows unusual behaviour at low temperatures and needs to be verified by further studies. Precipitation of native copper causes an increase of the original δ65Cu of +0.2‰ to around +2.5‰. Hence, such reactions can cause a substantial shift in the isotopic composition of the fluid, with appreciable remaining copper in the solution.
These two simple examples document the magnitude of δ65Cu changes induced by pH or redox changes in an oxidation zone or a mine drainage system. These models do not take into account adsorption of copper onto surfaces of minerals, its association with organic matter, or the action of microorganisms. Even with no redox changes taking place, isotopic shifts on the order of 1‰ or slightly more can be encountered. Of course, redox changes will cause even larger isotopic shifts.
Acknowledgements
This work is dedicated to Pete Williams for his life-long contribution to our understanding of secondary minerals and oxidation zones. We are thankful to Erik Melchiorre and an anonymous reviewer for the constructive criticism. We thank Stefanie Notz, Franziska Meißner, Kevin Kretschmer and Felix Tost for the help with the syntheses. The work presented here was supported financially by Deutsche Forschungsgemeinschaft grant MA 3927/26–1.
Supplementary material
To view supplementary material for this article, please visit https://doi.org/10.1180/mgm.2021.77


 Open access