


The relationship between birth weight and the development of chronic non-communicable diseases (NCD) in adult life has been well established. This association, called the Thrifty Phenotype Hypothesis, was developed by David Barker and others( Reference Hales and Barker 1 – Reference Eriksson, Forsén and Tuomilehto 4 ) and stipulates that children born with low birth weight, or some degree of growth restriction, have a higher incidence of CVD( Reference Barker, Osmond and Forsén 3 ), type II diabetes mellitus( Reference Eriksson, Forsén and Tuomilehto 4 ) and the metabolic syndrome( Reference Hales and Barker 1 , Reference Roseboom, van der Meulen and Ravelli 2 , Reference Eriksson, Forsén and Tuomilehto 4 ) during their life course. The reasons why intra-uterine growth restriction (IUGR) is linked to many adverse life conditions involves, amongst others, a series of biochemical, hormonal and structural alterations. The combination of such alterations put the individual on a different life course trajectory, with an increased risk for NCD, in a process called programming( Reference Lucas 5 ). On the other spectrum of birth weight, being born large for gestational age is also associated with such higher risk for obesity and metabolic disease( Reference Murtaugh, Jacobs and Moran 6 – Reference Tam, Wang and Luan 8 ), a process believed to be secondary to fetal overnutrition, early fat retention and known as the Pederson Hypothesis( Reference Hadden 9 ).
Children’s eating behaviour is modulated by a variety of factors that range from genetic to environmental influences( Reference Scaglioni, Arrizza and Vecchi 10 , Reference Breen, Plomin and Wardle 11 ). Parental behaviour including feeding practices, parental response to infant temperament and parental perception of infant growth and appetite are important mediators and modulators of infant feeding behaviour( Reference Faith, Van Horn and Appel 12 ). Therefore, understanding the factors that contribute to the development of unhealthy eating behaviours is an important step into promoting a healthier life trajectory.
In many instances, we and others have found evidence for a behavioural compound to the Thrifty Phenotype Hypothesis, suggesting altered feeding preferences in low birth weight individuals. However, until now, the literature on the association between birth weight and its behavioural compounds has been sparse at best, and with results that vary accordingly to age and sex investigated. Nevertheless, results always favour the intake of foods either rich in sugar( Reference Ayres, Agranonik and Portella 13 , Reference Barbieri, Portella and Silveira 14 ) or fat (i.e. foods with higher energetic density), when compared with individuals with normal birth weight( Reference Perala, Mannisto and Kaartinen 15 , Reference Crume, Scherzinger and Stamm 16 ). We refer to it as the Thrifty Eating Phenotype Hypothesis( Reference Silveira, Agranonik and Faras 17 , Reference Reis, Dalle Molle and Machado 18 ), and to our knowledge, there is no evidence documenting the association between IUGR and preference for certain macronutrients in children aged 6–12 years.
Therefore, in this study, we investigated if birth weight is associated with increased energy intake and/or increased preference for carbohydrate, protein, or fat at 6–12 years of age. We aim to provide an important piece of evidence by helping to understand how behavioural, physiological and developmental mechanisms interact in school-aged children to affect the programming of health and disease.
Methods
A sample of households from the Montreal Metropolitan area was selected from a larger database of families who previously indicated their willingness to partake in academic research and were likely to have children in the target age group (6–12 years old). These families were contacted by telephone by an independent research firm (SM Research) and invited to take part in a survey about children’s eating and lifestyle habits on behalf of researchers from McGill University. This survey was part one of the multi-component Brain-to-Society diagnostic study aiming to map children’s behaviours regarding a multitude of factors, including their environment, eating habits, physical activity and BMI. Given the wide scope of the research programme and the more limited cognitive capacity of children, questionnaires were completed by children’s parents or guardians.
Respondents were first asked whether there were any children aged 6–12 years who lived in their households most of the time. If yes, the interviewer then proceeded to ask to speak with the parent or guardian who knew the child’s daily habits best. If more than one child between 6 and 12 years old was residing in the household, the parent/guardian was asked to answer all questions regarding the child who had the next birthday. Verbal consent was obtained from all participants, who were mailed a $10 check for completing the 50-min telephonic survey including household demographic information, children’s anthropometrics (height and weight), physical activities and information about birth weight and gestational age at birth. Data collection took place between March and August 2013. Verbal consent was obtained from all participants included in the study, and ethical approval was obtained from McGill University’s Institutional Research Board. All procedures performed in studies involving human participants were in accordance with the ethical standards of the institutional and/or national research committee and with the 1964 Helsinki declaration and its later amendments or comparable ethical standards. The overall response rate for the telephone interview was 23 %. (Fig. 1).
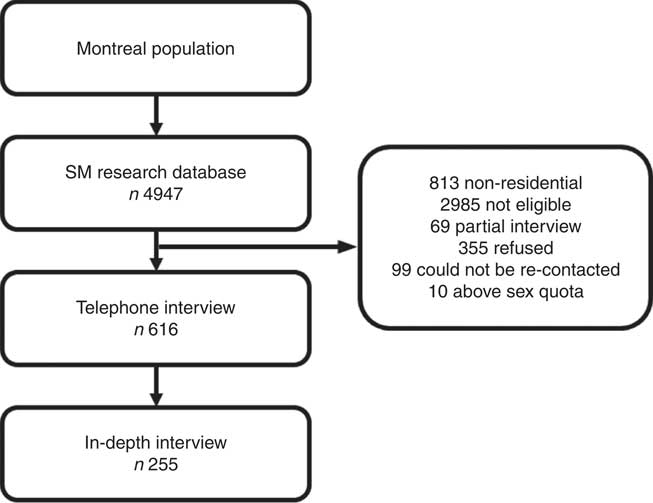
Fig. 1 Flow chart of study participants included in the analysis.
Participants who completed the telephone interview were then invited to complete a follow-up self-administered questionnaire. Participants who agreed were mailed the questionnaire and, as part of the process, completed a consent (parent) and assent (child) form and mailed the forms and completed questionnaires back to the investigators using a pre-stamped envelope. The sample for this study consists of children of parents who completed both the telephone and self-administered parts (n 255).
The survey included a web-based FFQ to assess children’s eating patterns, validated by Labonte et al., designed and validated for the Quebec population( Reference Labonte, Cyr and Baril-Gravel 19 ). Participants were required to recall their children’s food intake over the last month based on a list of 136 individual food items or food clusters. These items covered eight categories of food and beverages: dairy products, vegetables, fruits, meat and alternatives, beverages, cereal and grain products, ‘other foods’ and supplements. For each individual item, participants had to indicate the frequency of consumption from ‘never’ to ‘four or more times per day’. Parents estimated portion sizes using the visual aid of digital photos representing the food in standardised dinnerware and utensils based on the SU. VI. MAX food atlas( Reference Le Moullec, Deheeger and Preziosi 20 ). The survey integrated parent-reported frequency and portion size of each food with nutrients values, based on the Nutrition Data System for Research( Reference Schakel, Sievert and Buzzard 21 ) and the Canadian Nutrient file( 22 ), to calculate the energy content (energy content), total intake (in g) of lipids (fats), proteins and carbohydrates, as well as fibres and cholesterol. The analysis of each macronutrient was conducted by evaluating its crude, unadjusted value, and also by normalising to total intake in grams, in energy content and by the residual method( Reference Willett, Howe and Kushi 23 ) as suggested by Willett et al.( Reference Willett, Howe and Kushi 23 ). The use of these multiple methods is to ensure that the analysis is not impaired by co-linearity issues and confounding by total energy intake.
The Food Rules questionnaire( Reference Puhl and Schwartz 24 ) was used to assess parental control, encouragement and restriction rules related to food. Parents answered how often they remember being reinforced for certain rules about food on their childhood, on a scale from 1 (never) to 5 (very often). The control rules subscale included four items on how often the parent used food as reinforcement or punishment for their children’s behaviour (Cronbach’s α=0·65). The subscale of restriction rules included eight questions about how often they restricted consumption of certain foods to their children (Cronbach’s α=0·76). The encouragement rules included eight items about the frequency of parents promoting or encouraging child food intake, overriding satiety signals (Cronbach’s α=0·79).
Statistical methods
Birth weight was normalised to average Canadian gestational birth weight for gestational age (birth weight ratio (BWR))( Reference Kramer, Morin and Yang 25 ), in order to more accurately represent adequateness of birth weight to the respective gestational age, sex and populational standards. Variables were described as means and standard deviations, medians and interquartile ranges or numbers and percentages. Nutrient intake from FFQ analyses was performed separately by sex, because of documented differences in eating behaviour between sexes( Reference Asarian and Geary 26 ), and was tested for sex v. BWR interaction. Linear regression models were used to evaluate the influence of BWR on nutrient intake (percentage of total energetic intake, residual method and total weight including fibres), and food rules (food restriction, encouragement and control rules). The first model tested unadjusted associations between BWR and the dependent variables and a second model adjusted for family income (annual family income in Canadian Dollars – imputed data was necessary for income (n 10, imputed as median value of the full sample (n 612))( Reference Drewnowski 27 ), children age( Reference Deglaire, Mejean and Castetbon 28 – Reference Lanfer, Knof and Barba 30 ) and maternal age at childbirth( Reference Santos, Assuncao and Matijasevich 31 ). Additional analyses using ANOVA and BWR expressed in the categorical form (using three categories, having −1 and +1 sd from mean as cutoffs) was conducted to evaluate non-linear associations when needed. Taking into account our a priori hypothesis backed by biological plausibility and previous findings that confer a good pre-test probability, we have used the correction for multiple testing of Benjamini–Hochberg( Reference Benjamini and Hochberg 32 ), using a false discovery rate of 0·25. Statistical significance was set at P=0·05. We estimate sensitivity to detect an effect size (f 2) as low as 0·06, for a power of 80 % and n of 130.
Results
Birth weight was similar to the Canadian population average for gestational age and sex, noted as the average BWR was close to 1. BMI means and prevalence of overweight were also similar to contemporary research findings in Canada( Reference Kakinami, Henderson and Chiolero 33 , Reference Wicklow, Becker and Chateau 34 ). The household income, as inferred by Table 1, was probably above the median family annual income of Can$72 240 for Quebec in 2013( 35 ). Table 1 summarises the sample characteristics.
Table 1 Descriptive table of sample characteristics (n 255)Footnote * (Mean values and standard deviations; medians and interquartile ranges (IQR); numbers and percentages)
* P values for t test, Pearson’s χ 2 or Mann–Whitney test.
In boys, both unadjusted and adjusted linear regression models performed showed a statistically significant negative association between energy density and BWR, indicating that boys with a lower BWR had higher energy density intake. Individual macronutrient associations, on the other hand, were significant only for fat, as depicted by the statistically significant correlations of fat energetic percentage, residual and density methods (see Table 2, and Fig. 2), which suggests that the higher energetic density intake in boys with lower birth weights originated from fat intake. In girls, however, the results followed an opposite pattern, as shown by the positive, and statistically significant, the association between BWR and fat intake. In accordance with this result in girls, we found a statistically significant positive association between BWR and cholesterol intake, but only in the unadjusted analysis. Results from normalisation to total grams and residual method yielded similar statistical results, providing confidence for lack of confounding and collinearity (Table 3). Interaction analysis confirmed statistically significant interactions between sex and BWR for fat grams, fat percentage, fat residual mean, fat energetic density and cholesterol (data not shown).
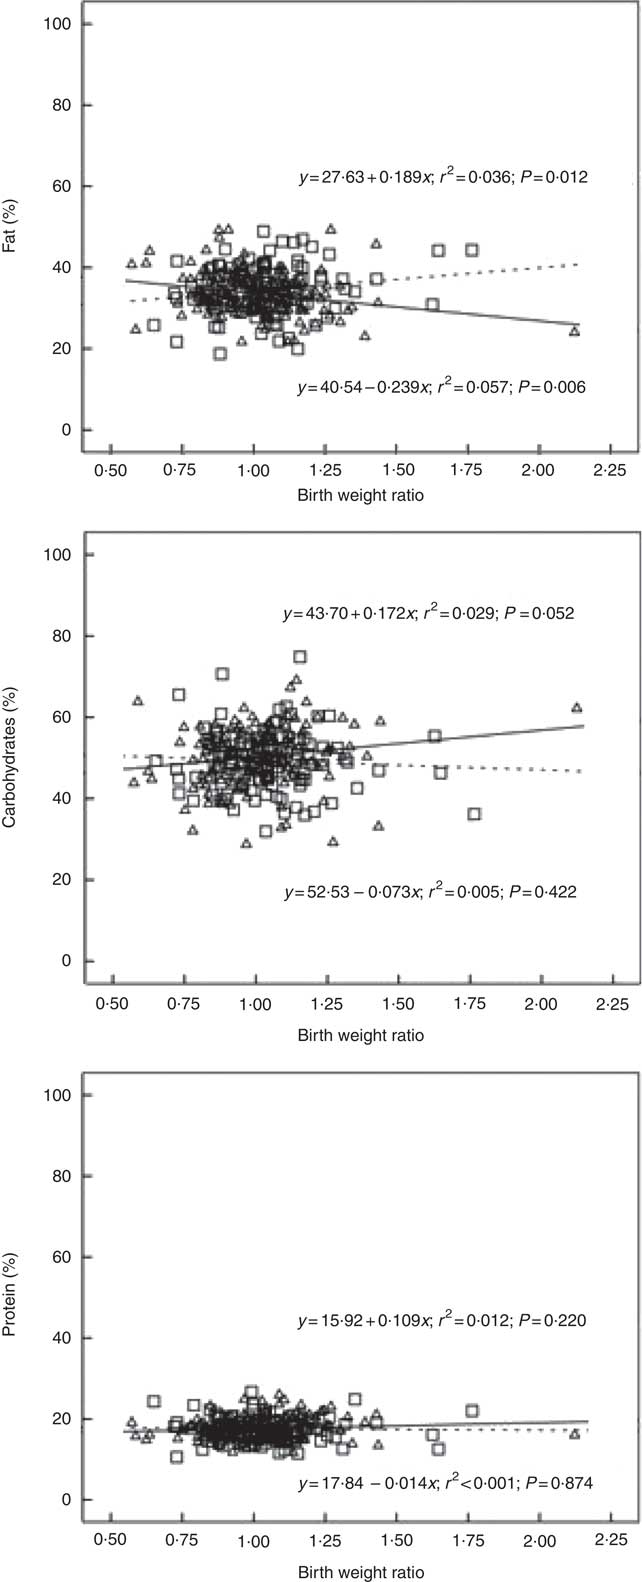
Fig. 2 Scatter plot showing the macronutrients (fat, carbohydrate and protein) intake in the percentage of energy content by total energy intake v. birth weight ratio, unadjusted. Regression formula showing unstandardised coefficients, r
2 effect size and P value. ![]() and
and ![]() , Male;
, Male; ![]() and
and ![]() , female.
, female.
Table 2 B and β coefficients for birth weight ratio in linear regression models, unadjusted (model 1) and adjusted (model 2) for family income, children age and maternal age at childbirthFootnote † (B and β coefficients with their standard errors)
* P<0·05 with Benjamini–Hochberg multiple testing correction.
† Macronutrients expressed in percentage of total energy content.
Table 3 β coefficients for birth weight ratio in linear regression models, unadjusted and adjusted for family income, children age and maternal age at childbirthFootnote †
* P<0·05 with Benjamini–Hochberg multiple testing correction.
† Unnormalised: intake in g, absolute value. % of Total energy content: percentage of total energy content (macronutrient energy content/total energy intake×100). Residual method: energy-adjusted intake estimate is the residual from a regression model in which total energy intake is the independent variable and absolute nutrient intake is the dependent variable. Thus, the residual is an estimate of nutrient intake uncorrelated with total energy intake and directly related to overall variation in food choice and composition. Density: intake in g, divided by total intake including fibres.
Discussion
In this study, we have found a negative correlation between BWR and energetic density intake in 6–12 years old boys, while – on the opposite – BWR was positively associated with energetic density from fat for girls in an unadjusted model. The energetic density intake in boys was mostly obtained from energy content derived from fat, suggesting an altered preference for this macronutrient. Energetic density is indeed mainly determined by water and fat content( Reference Blundell and Stubbs 36 ) and can be considered a correlate of palatability( Reference Drewnowski 37 , Reference Meiselman and Waterman 38 ). Dietary fat intake may also contribute to increased energy intake by its lower satiety potential( Reference de Castro, Bellisle and Dalix 39 ). Similar findings had already been demonstrated by Crume et al., in a cohort of 506 children with forty-two IUGR children (birth weight below the 15th percentile), in which there was a significantly higher percent energy intake of fat in IUGR children at 10 years of age compared with the unexposed( Reference Crume, Scherzinger and Stamm 16 ). In this study, we confirmed previous findings of increased palatable food intake in a population at risk for the metabolic syndrome. In girls, we found effects suggesting a trend in the opposite direction, indicating that girls with large birth weight are more likely to have higher ingestion of fat. However, this association did not persist after adjustment for confounding variables and when normalised to total energy content or by the residual method.
The biological significance of such effect in terms of cardiovascular risk is difficult to measure. In our case, the BWR range is about 1·5, representing a spectrum of birth weights from the IUGR (lower BWR=0·57) to the macrossomic (higher BWR= 2·12). In this range of birth weight, we estimated an absolute difference of 9 percentage points of fat intake between those extremes. Alternatively, comparing the IUGR extreme to the mean birth weight, the difference would be an absolute excess of 2·4 points in the percentage of total energetic intake from Fat. In general terms, there is a linear effect of fat intake as measured by the percentage of fat intake into cardiovascular risk( Reference Xu, Eilat-Adar and Loria 40 ). In our case, we also need to take into consideration that those with low birth weight are already known to be at increased risk, due to their metabolic programming, and the effect is concentrated in males, which also is a risk factor for CVD( Reference Jousilahti, Vartiainen and Tuomilehto 41 ). This is important because the clustering of risk factors is known to be more deleterious to health than a single factor alone, in both children( Reference Gubbels, Kremers and Stafleu 42 – Reference Gubbels, Kremers and Stafleu 46 ) and adults( Reference Kremers, De Bruijn and Schaalma 47 , Reference Schuit, van Loon and Tijhuis 48 ).
Animal models demonstrate that adversities in the intra-uterine life induce an increased preference for high-fat diets instead of high-protein or high-carbohydrate diets( Reference Bellinger and Langley-Evans 49 – Reference Dalle Molle, Laureano and Alves 52 ). The association between IUGR and specific food preferences and feeding behaviour has also been demonstrated in human with some variations among different age groups and sexes. In preterm newborns, for example, the degree of IUGR correlates with pleasurable hedonic responses to sucrose intake in the 1st day of life( Reference Ayres, Agranonik and Portella 13 ). In 3-year-old children, one study showed that girls with normal birth weight had a significantly higher ability than boys to delay response to an eating impulse; this relationship was not significant in the IUGR sample, suggesting that IUGR is linked to increased impulsivity towards sweet food rewards( Reference Silveira, Agranonik and Faras 17 ). Another study with adults revealed higher carbohydrate consumption in women who were severely IUGR at birth( Reference Barbieri, Portella and Silveira 14 ). Several other studies in adults corroborate the hypothesis that IUGR individuals have a higher preference either towards fats( Reference Stein, Rundle and Wada 53 – Reference Perälä, Männistö and Kaartinen 55 ) or carbohydrates( Reference Barbieri, Portella and Silveira 14 ). It appears to us that, despite the apparent discrepant food preferences described in different age groups, all studies converge to an increased intake of high energy density foods in IUGR individuals( Reference Portella and Silveira 56 ). These persistent small nutrient imbalances across lifespan could explain, in part, the increased risk of IUGR developing the metabolic syndrome and other NCD, and could constitute a target for more precise interventions.
Another apparent inconsistency between the different studies that evaluate food preferences according to birth weight is the effect of sex. In general, low birth weight girls/women seem to be more vulnerable to the effects of prenatal programming of food preferences, showing an increased preference for carbohydrates, impulsivity for sugar and emotional overeating when compared no normal birth weight counterparts( Reference Barbieri, Portella and Silveira 14 , Reference Silveira, Agranonik and Faras 17 , Reference Escobar, O’Donnell and Colalillo 57 ). However, other studies do not seem to find a sex effect( Reference Lussana, Painter and Ocke 54 ). Boys and girls differ both at the neurological and biological levels, especially in terms of timing (e.g. time of fat rebound, time of puberty, growth patterns, etc.)( Reference Eisenmann, Heelan and Welk 58 ), and these ultimately influence food intake and preferences( Reference de Beer, Vrijkotte and Fall 59 , Reference Koyama, Sairenchi and Shimura 60 ). Therefore, while prenatal programming seems to modify eating patterns of both boys and girls when compared with controls, the timing and nature of the differences can vary between the sexes( Reference Dulloo, Jacquet and Seydoux 61 ), fluctuating according to the adiposity rebound and body fat distribution during development( Reference Koyama, Sairenchi and Shimura 60 ). Indeed, in this study, the effect of the fetal programming of food preferences was apparent only in boys, possibly due to the specific age slot of the current investigation. Another aspect to take into consideration in sex differences is that girls may have intrinsic differences for fat and sweet taste from boys( Reference Lanfer, Knof and Barba 30 ).
The targeted age for this study is a relevant period because if follows the adiposity rebound( Reference Rolland-Cachera, Deheeger and Guilloud-Bataille 62 , Reference Rolland-Cachera, Deheeger and Maillot 63 ), which is the period in which BMI begins to increase after a nadir, and usually occurs between 5–7 years of age( Reference Rolland-Cachera, Deheeger and Bellisle 64 – Reference Eriksson, Kajantie and Lampl 67 ). Children at this stage have already passed the physiological decrease in appetite that occurs between 1 and 5 years of age( Reference Leung, Marchand and Sauve 68 , Reference Leung and Robson 69 ), and are at risk to be obese in adulthood if they are already overweight or obese( Reference Whitaker, Wright and Pepe 70 ). An early adiposity rebound has been shown to correlate with a variety of outcomes such as body weight gain during infancy( Reference Koyama, Sairenchi and Shimura 60 ), metabolic risk( Reference Gonzalez, Corvalan and Pereira 71 – Reference Peneau, Gonzalez-Carrascosa and Gusto 73 ), adiposity in adolescence( Reference Hughes, Sherriff and Ness 65 ), type 2 diabetes( Reference Eriksson, Forsen and Tuomilehto 74 ) and overweight and obesity( Reference Rolland-Cachera, Deheeger and Maillot 63 , Reference Rolland-Cachera, Deheeger and Bellisle 64 , Reference Whitaker, Pepe and Wright 66 ). Specifically, type 2 diabetes is associated with small body size at birth, followed by a precocious adiposity rebound( Reference Eriksson, Forsen and Tuomilehto 74 ). Most studies correlate the age of adiposity rebound with size at birth, and it has been shown that small head circumference at birth (a marker of IUGR) is also related to early adiposity rebound( Reference Eriksson, Kajantie and Lampl 67 ). Individuals with earlier adiposity rebound have increased levels of leptin at 10 years of age and females have increased adiponectin levels as well( Reference Flexeder, Thiering and Kratzsch 75 ). Although we did not study pubertal status, it is noteworthy that a significant portion of the population studied might have already entered puberty and this could be a possible confounder, as well as it could explain the sex differences reported, as girls start puberty earlier than boys do. An early adiposity rebound leads to a higher BMI that can also result in earlier pubertal timing( Reference Koyama, Ichikawa and Kojima 72 ), which also alters body composition, appetite and metabolic markers.
Our study has some limitations, such as the cross-sectional analysis that limits the assessment to one-time point, the use of a convenience sample, and the use of parent-reported questionnaires. Another aspect is the absence of data on some confounders such as breast-feeding, and family size. Nevertheless, we believe that, despite those limitations that may affect the capacity for causal inference, they do not invalidate our main observation of the association between birth weight and macronutrient intake( Reference Parrish, Marshall and Krebs 76 ). Moreover, it is important to keep in mind that although our results are in line with previous findings, future research is still needed to better characterise this association, with more adequate and prospective evaluations of food intake and its complex milieu of drivers in order to increase confidence in causative pathways( Reference Peng, Dominici and Zeger 77 , Reference Pearce 78 ).
Conclusion
The study confirms previous findings showing that low birth weight is associated with specific food preferences in a sex-specific manner over the life course. It is, therefore, likely that biological factors such as fetal programming of homoeostatic and/or hedonic pathways functioning are involved. Awareness of the vulnerability of this group to specific food preferences and behaviours during their life course in conjunction with their increased risk of obesity and related metabolic comorbidities makes birth weight an important element to consider in the clinical practice by providing more careful follow-up during childhood.
Acknowledgements
This study was funded by the Canadian Institutes of Health Research (CIHR) (CIHR-India grant reference no. INC 110726).
The authors appreciate all organisations’ team members involved in this project. N. A. and L. D. designed the research; L. D. conducted the research; A. R. B., A. K. P., C. P., R. D. M., A. F. and P. P. S. analysed data or performed statistical analysis; A. R. B., A. K. P., C. P., R. D. M., A. F., N. A., R. D. L. and P. P. S. wrote the paper; A. R. B., A. K. P., C. P., R. D. M., N. A., R. D. L., P. P. S. and L. D. had primary responsibility for the final content.
The authors declare that there are no conflicts of interest.


