


Metabolic syndrome (MetS), characterised by insulin resistance, abdominal obesity, hyperlipidaemia and hypertension, is also known as Syndrome X and is a cluster of metabolic and cardiovascular risk factors(Reference Saklayen1,Reference Eckel, Grundy and Zimmet2) . In the USA, the prevalence of MetS is approximately 24 %, with a prevalence of 19·5 % in those aged 20–39 years, increasing to 48·6 % in those aged 60 years and older, and with significant differences in prevalence by race and gender(Reference Medina, Vera-Lastra and Peralta-Amaro3–Reference Pucci, Alcidi and Tap5). Each component of MetS, including insulin resistance, abdominal obesity, hyperlipidaemia and hypertension, is an independent risk factor for cardiovascular disease (CVD), and the combination of these risk factors will significantly increase the incidence and severity of CVD(Reference Tune, Goodwill and Sassoon6). Compared with non-MetS patients, MetS patients had a twofold increased risk of atherosclerotic CVD and a fivefold increased risk of type 2 diabetes, and the incidence of MetS is strongly associated with obesity(Reference Alberti, Eckel and Grundy7,Reference Saklayen8) . Therefore, an anthropometric index that combines body size and disease-predictive ability is needed to measure MetS.
Previous studies have shown that visceral adiposity plays a key role in the pathogenesis of MetS, traditional studies have screened and managed visceral obesity by central obesity anthropometrics such as waist circumference (WC) and but these metrics provide limited information on fat distribution(Reference Tchernof and Després9–Reference Wu, Zhu and Qiao11). Combining traditional measurements, Thomas et al. proposed a novel anthropomorphic index body roundness index (BRI) to predict body fat and visceral adipose tissue volume, calculated based on WC and height(Reference Thomas, Bredlau and Bosy-Westphal12,Reference Rico-Martín, Calderón-García and Sánchez-Rey13) . BRI, WC and waist-to-height ratio (WHtR) were superior to other conventional measures in screening for MetS, and BRI was superior to BMI, waist-to-hip ratio (WHR), a body shape index (ABSI) and body fat index (BAI) in predicting MetS, moreover, increased BRI was associated with increased risk of MetS(Reference Rico-Martín, Calderón-García and Sánchez-Rey13). However, there is no research on the relationship between MetS and BRI based on the USA population.
The objective of our study is to investigate the association between BRI and MetS based on data from the National Health and Nutrition Examination Survey (NHANES): 1999–2018. These data will suggest that following baseline BRI in a population can help predict and screen for the onset of MetS, leading to early clinical diagnosis and early intervention to improve the prognosis of latent preclinical MetS patients.
Methods
Data collection
NHANES is a series of representative cross-sectional studies consisting of interviews, examination and laboratory data collected from a multi-stage, stratified and pooled probability sample of civilian and non-hospital personnel designed to monitor the health status of the USA population(Reference Johnson, Paulose-Ram and Ogden14). The National Center for Health Statistics Institutional Review Board approved the study protocol, and all participants signed informed consent agreements. Data are continuously collected and publicly released by NHANES on a 2-year cycle beginning in 1999, and our study included adult participants aged 18 years and older with BRI data in NHANES from 1999 to 2018.
Socio-demographic characteristics, laboratory testing and definition
Participants reported age, gender, race (non-Hispanic Black, non-Hispanic White, Mexican American and other) and risk factors (smoking, diabetes, hypertension, CVD, etc.), measured blood total cholesterol (TC), high-density lipoprotein (HDL) and HbA1c and performed anthropometric measurements using standard methods, including height, weight, WC, systolic blood pressure (SBP) and diastolic blood pressure (DBP)(Reference Grundy15).
MetS definition: According to the National Cholesterol Education Program-Adult Treatment Panel III, MetS in adults is defined as having at least three of the following cardiometabolic risk factors: (1) serum triacylglycerol (TAG) ≥ 150 mg/dl; (2) serum HDL cholesterol < 50 mg/dl in women and < 40 mg/dl in men; (3) fasting glucose ≥ 100 mg/dl; (4) SBP ≥ 130 mm Hg or DBP ≥ 85 mm Hg and (5) waist circumference ≥ 88 cm for women and ≥ 102 cm for men(Reference Ahluwalia, Raghavan and Zhang16).
Calculation formula related to anthropometric measurements: BMI = weight/height2, BRI = 364·2–365·5
 $$ \times \sqrt {1 - {{{{{\left( {{{{\rm{WC}}}} \over {{2{\rm{\pi }}}}} \right)}^2}}} \over {{{{\left( {0\cdot5{\rm{\;height}}} \right)}^2}}}}} $$
(Reference Wu, Pu and Zhang17). The BRI was stratified according to the data-driven tertile, and the population was trisected according to the magnitude of the BRI values into < 33rd percentile, ≥ 33rd percentile and < 67th percentile, ≥ 67th percentile, corresponding to BRI values < 4·22, ≥ 4·22 and < 5·98 and ≥ 5·98, respectively.
$$ \times \sqrt {1 - {{{{{\left( {{{{\rm{WC}}}} \over {{2{\rm{\pi }}}}} \right)}^2}}} \over {{{{\left( {0\cdot5{\rm{\;height}}} \right)}^2}}}}} $$
(Reference Wu, Pu and Zhang17). The BRI was stratified according to the data-driven tertile, and the population was trisected according to the magnitude of the BRI values into < 33rd percentile, ≥ 33rd percentile and < 67th percentile, ≥ 67th percentile, corresponding to BRI values < 4·22, ≥ 4·22 and < 5·98 and ≥ 5·98, respectively.
Statistical analysis
Our analyses used a weighted sample and considered stratification and clustering designed to derive USA population estimates(Reference Ingram, Malec and Makuc18). All statistical analyses were carried out using R software (version 4.1.0; http://www.R-project.org, R Foundation for Statistical Computing). Correlations between BRI and unadjusted traditional cardiovascular risk factors were determined, and we examined the relationship between BRI and MetS based on known possible relationships between BRI and race ethnicity, as well as significant interactions noted in crude models. In addition, a crude and simple univariate logistic regression was first performed with non-Hispanic Black as the reference, followed by multivariable logistic regression models were fitted to examine the association of BRI (in tertiles) with the response variable MetS. Model 1 is the original unadjusted data analysis, model 2 is the adjusted analysis according to age, sex and ethnicity and model 3 is an adjusted analysis based on model 2 for risk factors such as diabetes and hypertension. Finally, we performed receiver operating characteristic analysis on BRI and the associated continuous predictors. A P value of < 0·05 was considered statistically significant.
Results
Distribution of socio-demographic and clinical characteristics by body roundness index
In NHANES 1999–2018, 56 367 adults aged 18 years and older were screened, of which 3347 and 5717 participants were excluded due to missing data on BRI and covariates, resulting in a total of 47 303 NHANES participants being included in the study (Fig. 1). General conditions, ethnicity, anthropometric measurements and cardiovascular risk factors are presented overall and by tertiles of BRI as shown in Table 1. Non-Hispanic White had the largest proportion of the population across tertiles, but their proportion declined with increasing BRI, as did other races, while the proportion of Non-Hispanic Black and Mexican American both declined with increasing BRI (P < 0·001). The highest tertile of BRI (tertile 3) was associated with older mean age, greater BMI, SBP, DBP, WC and BRI, higher HbA1c and TC and lower HDL, as well as with higher cardiovascular risk factors (more diabetes, hypertension, smoke, atherosclerotic CVD, angina, myocardial infarction, congestive heart failure, CHD, CVD, hyperlipidaemia, stroke and MetS) were associated (P < 0·001). A positive correlation was noted between BRI (tertiles) and the prevalence of MetS and several MetS complications, and high HDL-cholesterol was more prevalent in lower BRI tertiles (P < 0·001). Specifically, crude MetS prevalence was 3·05, 26·14 and 50·03 % in tertile 1, 2 and 3 of BRI, respectively. The standard error of BRI were 3·21 (0·68), 5·07 (0·50) and 7·93 (1·85) for tertiles 1, 2 and 3 of the subpopulation, respectively.
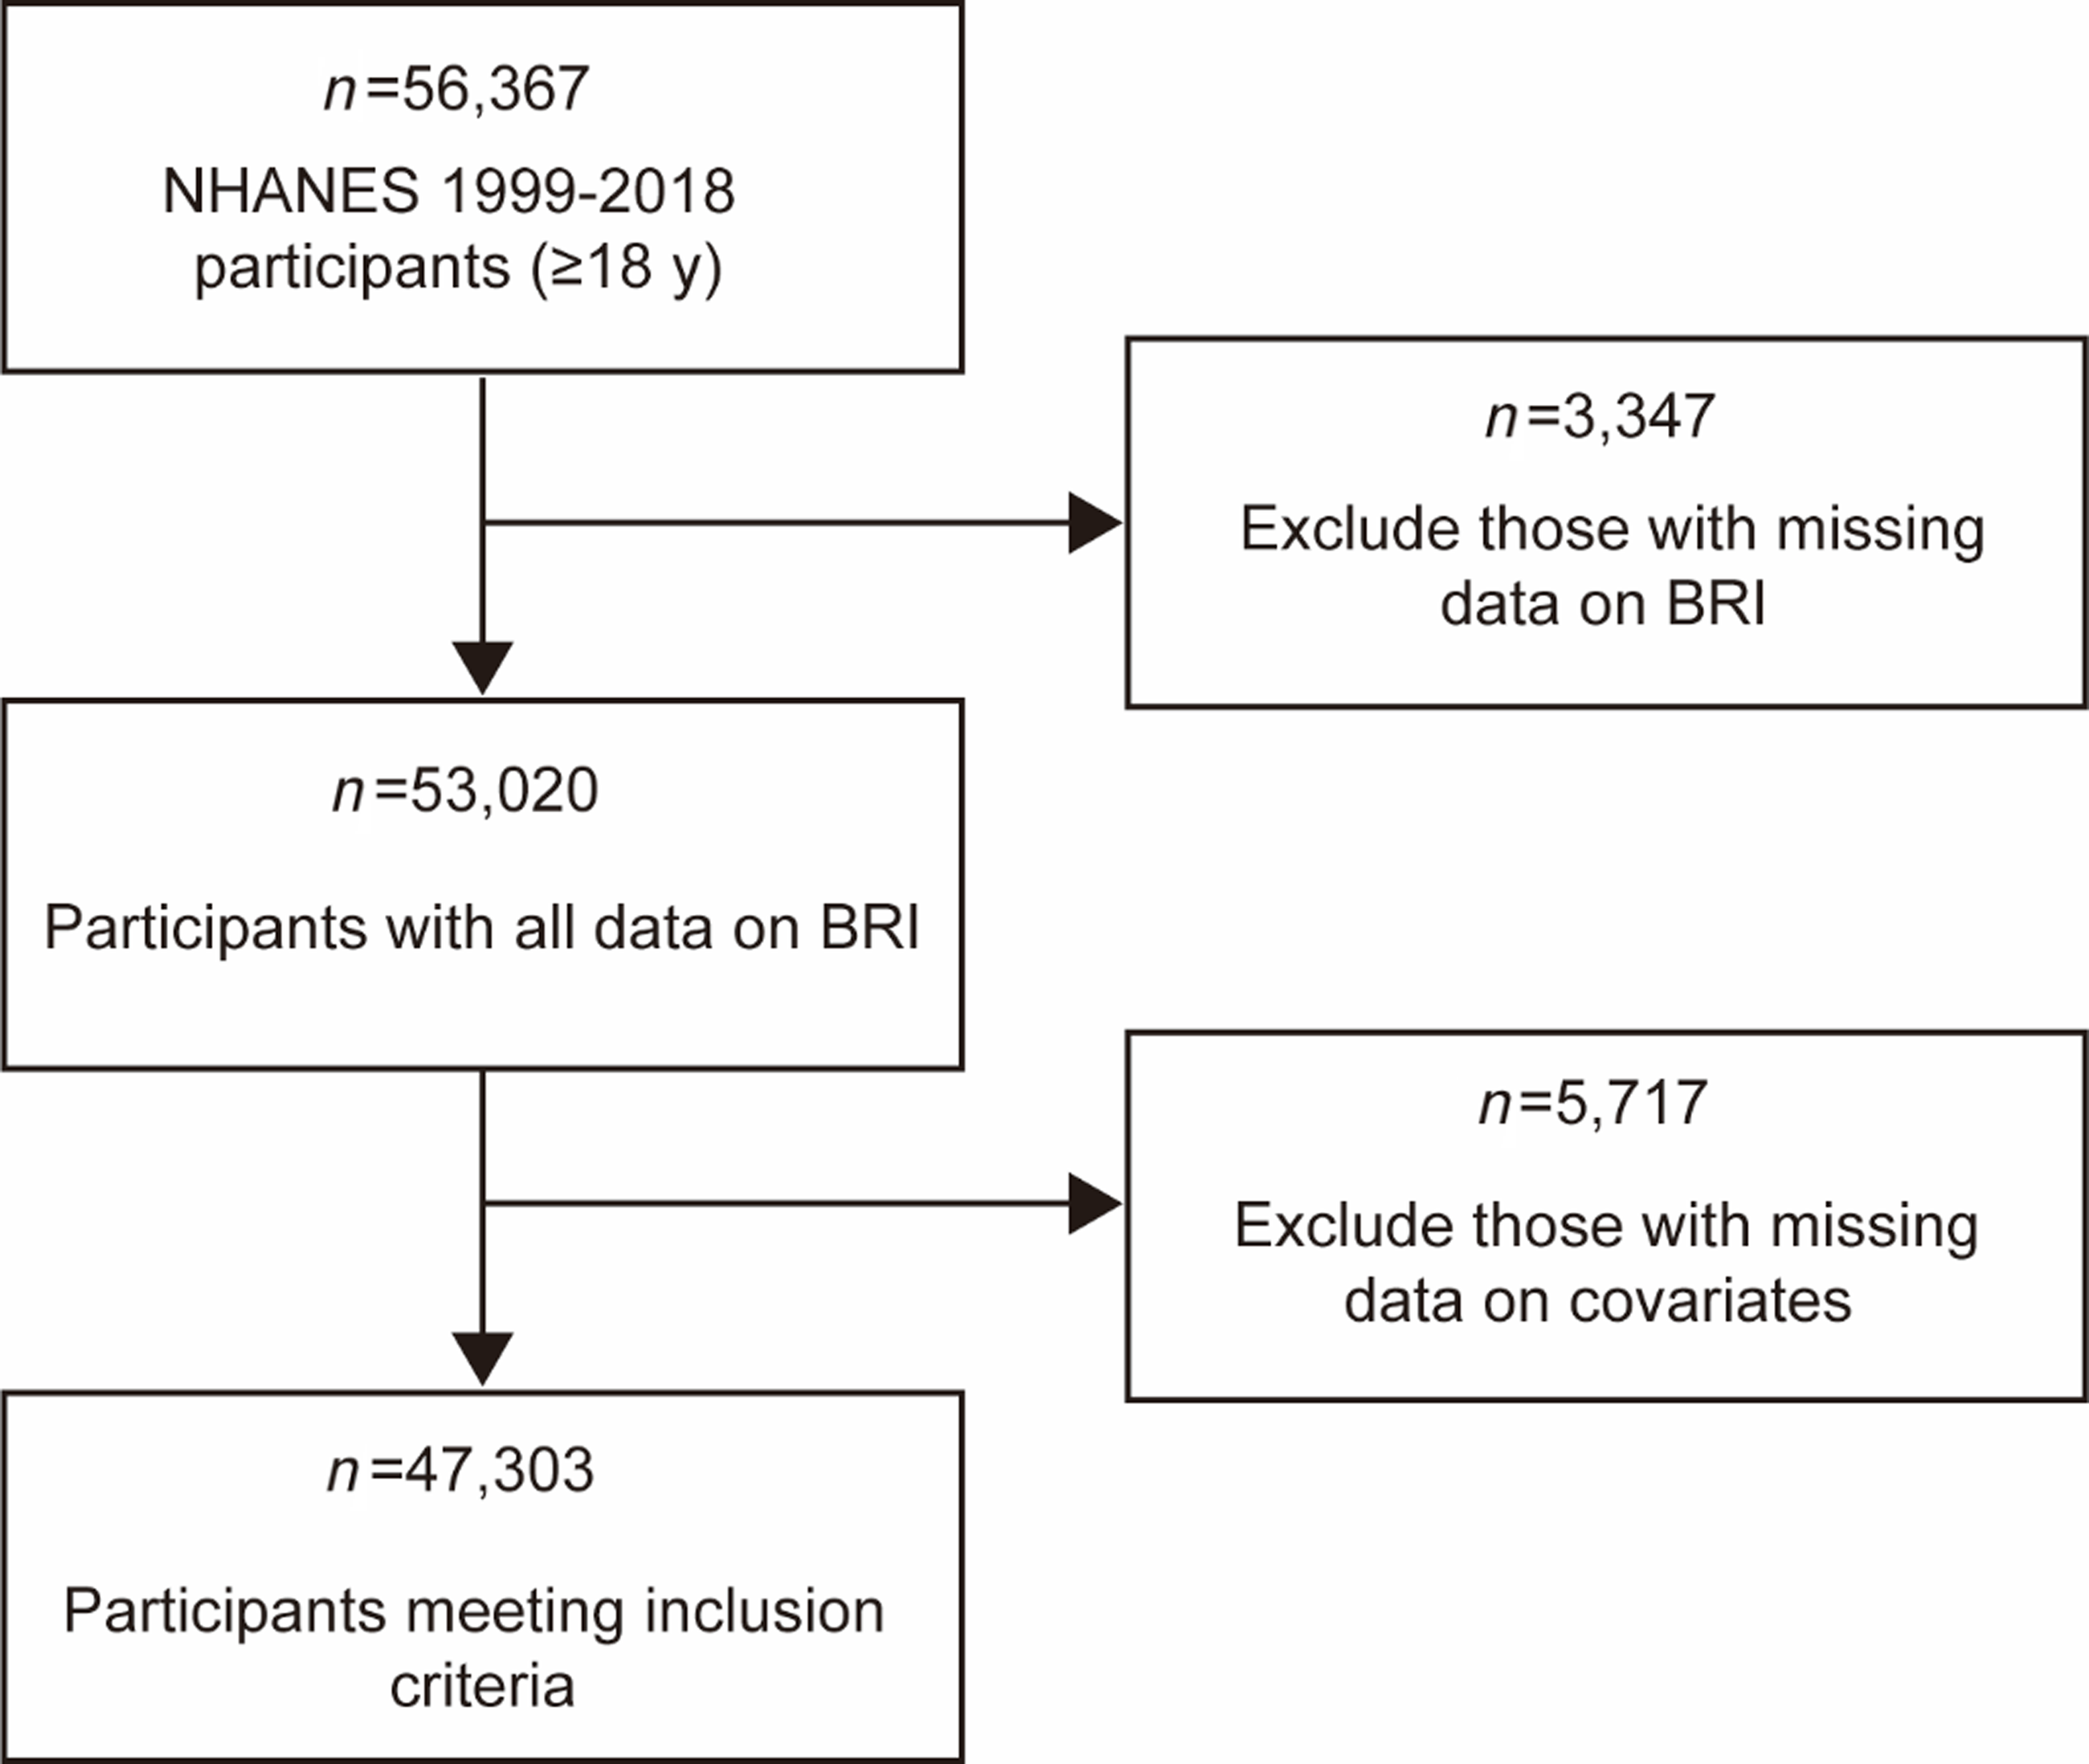
Fig. 1. Flowchart describing the sample exclusion criteria used in this study which uses data from NHANES (1999–2018).
Table 1. Distribution of socio-demographic and clinical characteristics by BRI in USA adults 1999–2018.
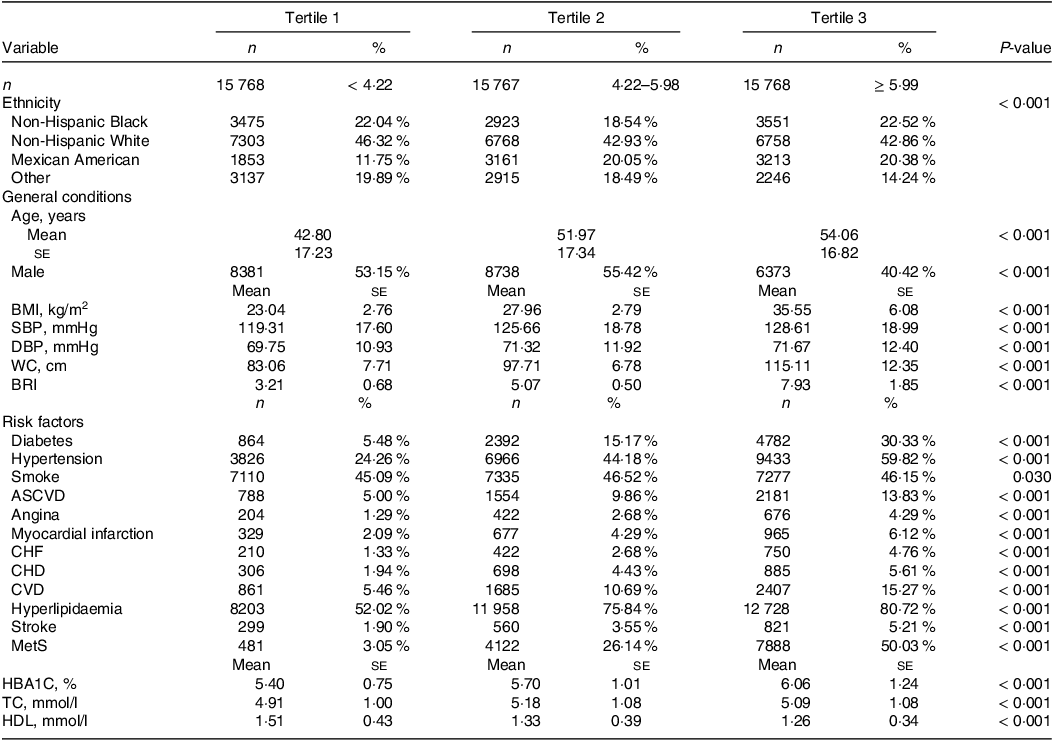
BRI, body roundness index; SBP, systolic blood pressure; DBP, diastolic blood pressure; WC, waist circumference; ASCVD, atherosclerotic CVD; CHF, congestive heart failure; MetS, metabolic syndrome; HBA1C, glycosylated Hb, Type A1C; TC, total cholesterol.
Correlations between body roundness index and traditional cardiovascular risk factors
Table 2 shows the results of the Spearman correlation coefficient of BRI and other traditional cardiovascular risk factors, including age, HbA1c, TC, HDL, BMI, WC, SBP and DBP. BRI was positively associated with all risk factors except HDL, which was significantly negatively associated (P < 0·001). Using 0·4 and 0·7 as the low, medium and high nodes of correlation, we found low positive correlations of BRI with age, HbA1c, TC, SBP and DBP (r = 0·2809, 0·3763, 0·0777, 0·2461 and 0·0799, respectively), low negative correlations with HDL (r = –0·2784) and high positive correlations with BMI and WC (r = 0·8993 and 0·9208, respectively).
Table 2. Correlations between BRI and traditional cardiovascular risk factors.
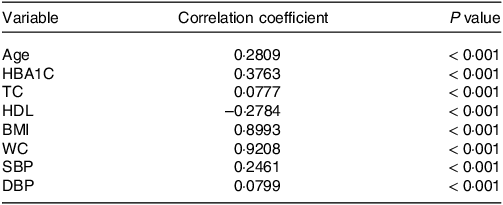
BRI, body roundness index; HBA1C, glycosylated Hb, Type A1C; TC, total cholesterol; WC, waist circumference; SBP, systolic blood pressure; DBP, diastolic blood pressure.
Association of metabolic syndrome with cardiovascular risk factors in univariate logistic regression analysis
The Non-Hispanic Black was taken as the reference group, and univariate logistic regression analysis was performed on the traditional cardiovascular risk factors, and statistically significant indicators were obtained (P < 0·001, Table 3). In addition, we artificially defined OR values 0·9–1·1 and 1·0–1·1 as no correlation, 0·7–0·8 and 1·2–1·4 as weak correlation, 0·4–0·6 and 1·5–2·9 as moderate correlation, 0·1–0·3 and 3·0–9·0 as strong correlation and < 0·1 and greater than 10·0 as great correlation. According to the analysis, we found no association among age (OR: 1·02, 95 % CI: 1·02, 1·02), BMI (OR: 1·14, 95 % CI: 1·14, 1·15), SBP (OR: 1·02, 95 % CI: 1·02, 1·02), DBP (OR: 1·02, 95 % CI: 1·02, 1·03) and WC (OR: 1·07, 95 % CI: 1·07, 1·07); female (OR: 1·29, 95 % CI: 1·24, 1·34), non-Hispanic White (OR: 1·41, 95 % CI: 1·34, 1·50), other race (OR: 1·20, 95 % CI: 1·12, 1·29), TC (OR: 1·21, 95 % CI: 1·18, 1·23) and smoking (OR: 1·22, 95 % CI: 1·17, 1·27) were weak risk factors and Mexican American (OR: 1·65, 95 % CI: 1·55, 1·77), HbA1c (OR: 1·96, 95 % CI: 1·92, 2·01), BRI (OR: 1·58, 95 % CI: 1·56, 1·60), atherosclerotic CVD (OR: 2·18, 95 % CI: 2·05, 2·33), Angina (OR: 2·38, 95 % CI: 2·13, 2·66), myocardial infarction (OR: 2·20, 95 % CI: 2·01, 2·41), congestive heart failure (OR: 2·45, 95 % CI: 2·20, 2·73), CHD (OR: 2·32, 95 % CI: 2·11, 2·54), CVD (OR: 2·21, 95 % CI: 2·08, 2·35) and stroke (OR: 1·90, 95 % CI: 1·72, 2·10) were moderate risk factors; diabetes (OR: 6·06, 95 % CI: 5·76, 6·38) and hypertension (OR: 3·7, 95 % CI: 3·54, 3·86) were strong risk factors, hyperlipidaemia (OR: 13·86, 95 % CI: 12·71, 15·12) was great risk factors and HDL (OR: 0·03, 95 % CI: 0·02, 0·03) was strong protective factor.
Table 3. Results of univariate logistic regression analysis.
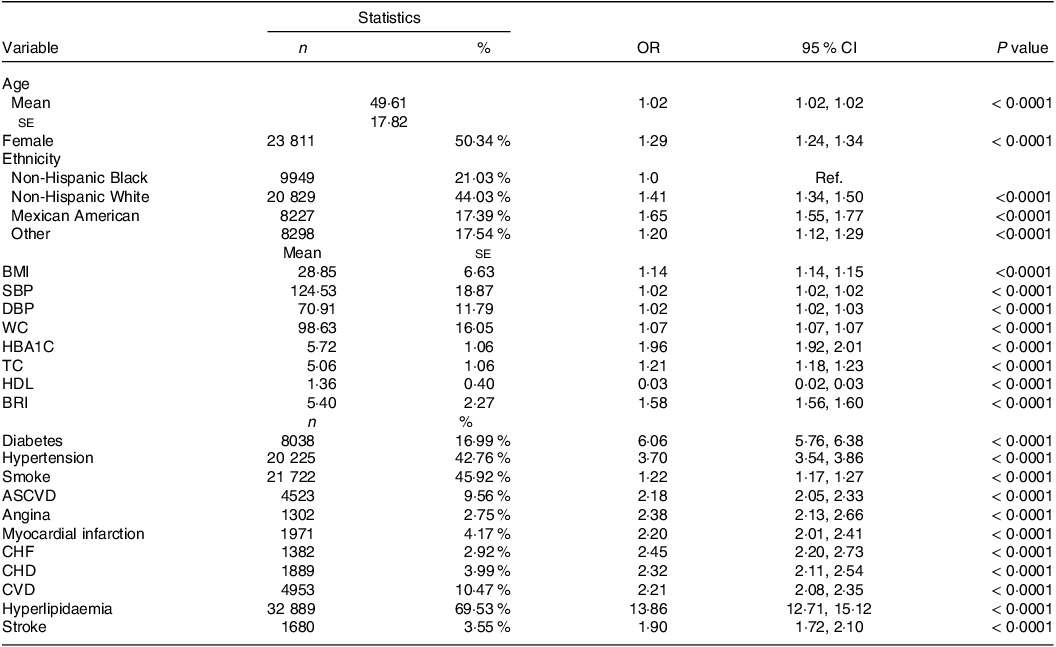
SBP, systolic blood pressure; DBP, diastolic blood pressure; WC, waist circumference; HBA1C, glycosylated Hb, Type A1C; TC, total cholesterol; BRI, body roundness index; ASCVD, atherosclerotic cardiovascular disease; CHF, congestive heart failure.
Association of metabolic syndrome with body roundness index in multivariate logistic regression analysis
Multivariate logistic regression analysis was performed on these indicators to identify independent risk factors for MetS, and statistically significant indicators were obtained (P < 0·001, Table 4). The BRI value was 1·20 (95 % CI 1·17, 1·22), 1·21 (95 % CI 1·19, 1·23) and 0·74 (95 % CI 0·71, 0·78) in models 1–3, respectively. In model 1 (unadjusted), the association of MetS with BRI was significant among subpopulation (OR: 8·12, 95 % CI: 7·33, 9·00 for tertile 1 vs. tertile 2; OR: 13·87, 95 % CI: 12·24, 15·72 for tertile 1 vs. tertile 3). In model 2 (adjusted by age, sex and ethnicity), the association of MetS with BRI was significant among subpopulations (OR: 7·24, 95 % CI: 6·53, 8·03 for tertile 1 vs. tertile 2; OR: 12·02, 95 % CI: 10·60, 13·64 for tertile 1 vs. tertile 3). In model 3 (adjusted by age, sex, ethnicity, DM, CVD, etc.), the association of MetS with BRI was significant among subpopulation (OR: 4·59, 95 % CI: 4·07, 5·17 for tertile 1 vs. tertile 2; OR: 6·33, 95 % CI: 5·45, 7·35 for tertile 1 vs. tertile 3).
Table 4. Multivariate logistic regression analyses for the association between BRI and MetS.
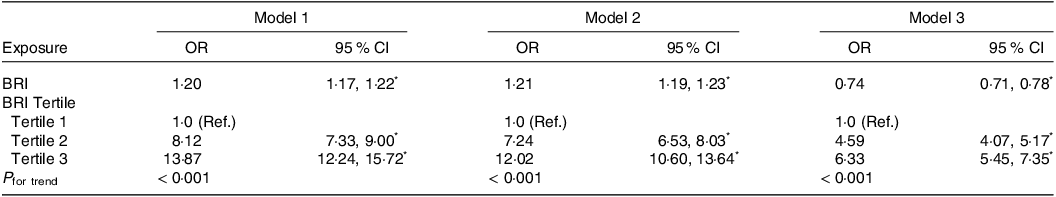
BRI, body roundness index; Ref, reference.
Model 1: unadjusted.
Model 2: adjusted for age, sex and ethnicity.
Model 3: age; sex; ethnicity; DM; hypertension; smoke; angina; ASCVD; CHF; CHD; CVD; MI; hyperlipidaemia; stroke; HbA1c; TC; HDL; BMI; WC; SBP; DBP.
* P < 0·001.
Body roundness index as a predictor for metabolic syndrome
A non-linear relationship was detected between BRI levels and the prevalence of MetS after adjusting for confounding variables (age, gender and ethnicity), where BRI > 3 and ≤ 6 were significantly and positively correlated with MetS (Fig. 2). In addition, BRI predicted MetS with an AUC of 0·7986 (95 % CI: 0·7946, 0·8027), specificity of 0·6238 and sensitivity of 0·8541 (Table 5 and Fig. 3), which was comparable to HDL (AUC: 0·7909, 95 % CI: 0·7863, 0·7955) and WC (AUC: 0·7848, 95 % CI: 0·7805, 0·7890), but which was greatest in anthropometric measures such as HbA1c (AUC: 0·7074, 95 % CI: 0·7946, 0·7129), TC (AUC: 0·5509, 95 % CI: 0·5448, 0·5569) and BMI (AUC: 0·7638, 95 % CI: 0·7594, 0·7683). This means that after adjusting for a range of confounding disturbances, an increase in BRI within a certain range shows a positive correlation with the risk of MetS. However, when its value exceeds a certain range, the risk of MetS does not increase with an increase in BRI. Thus, non-linear diagnostic methods have higher accuracy and reliability for better diagnosis and prediction of disease compared with linear diagnostic methods, and BRI can be better used to predict the occurrence of MetS.
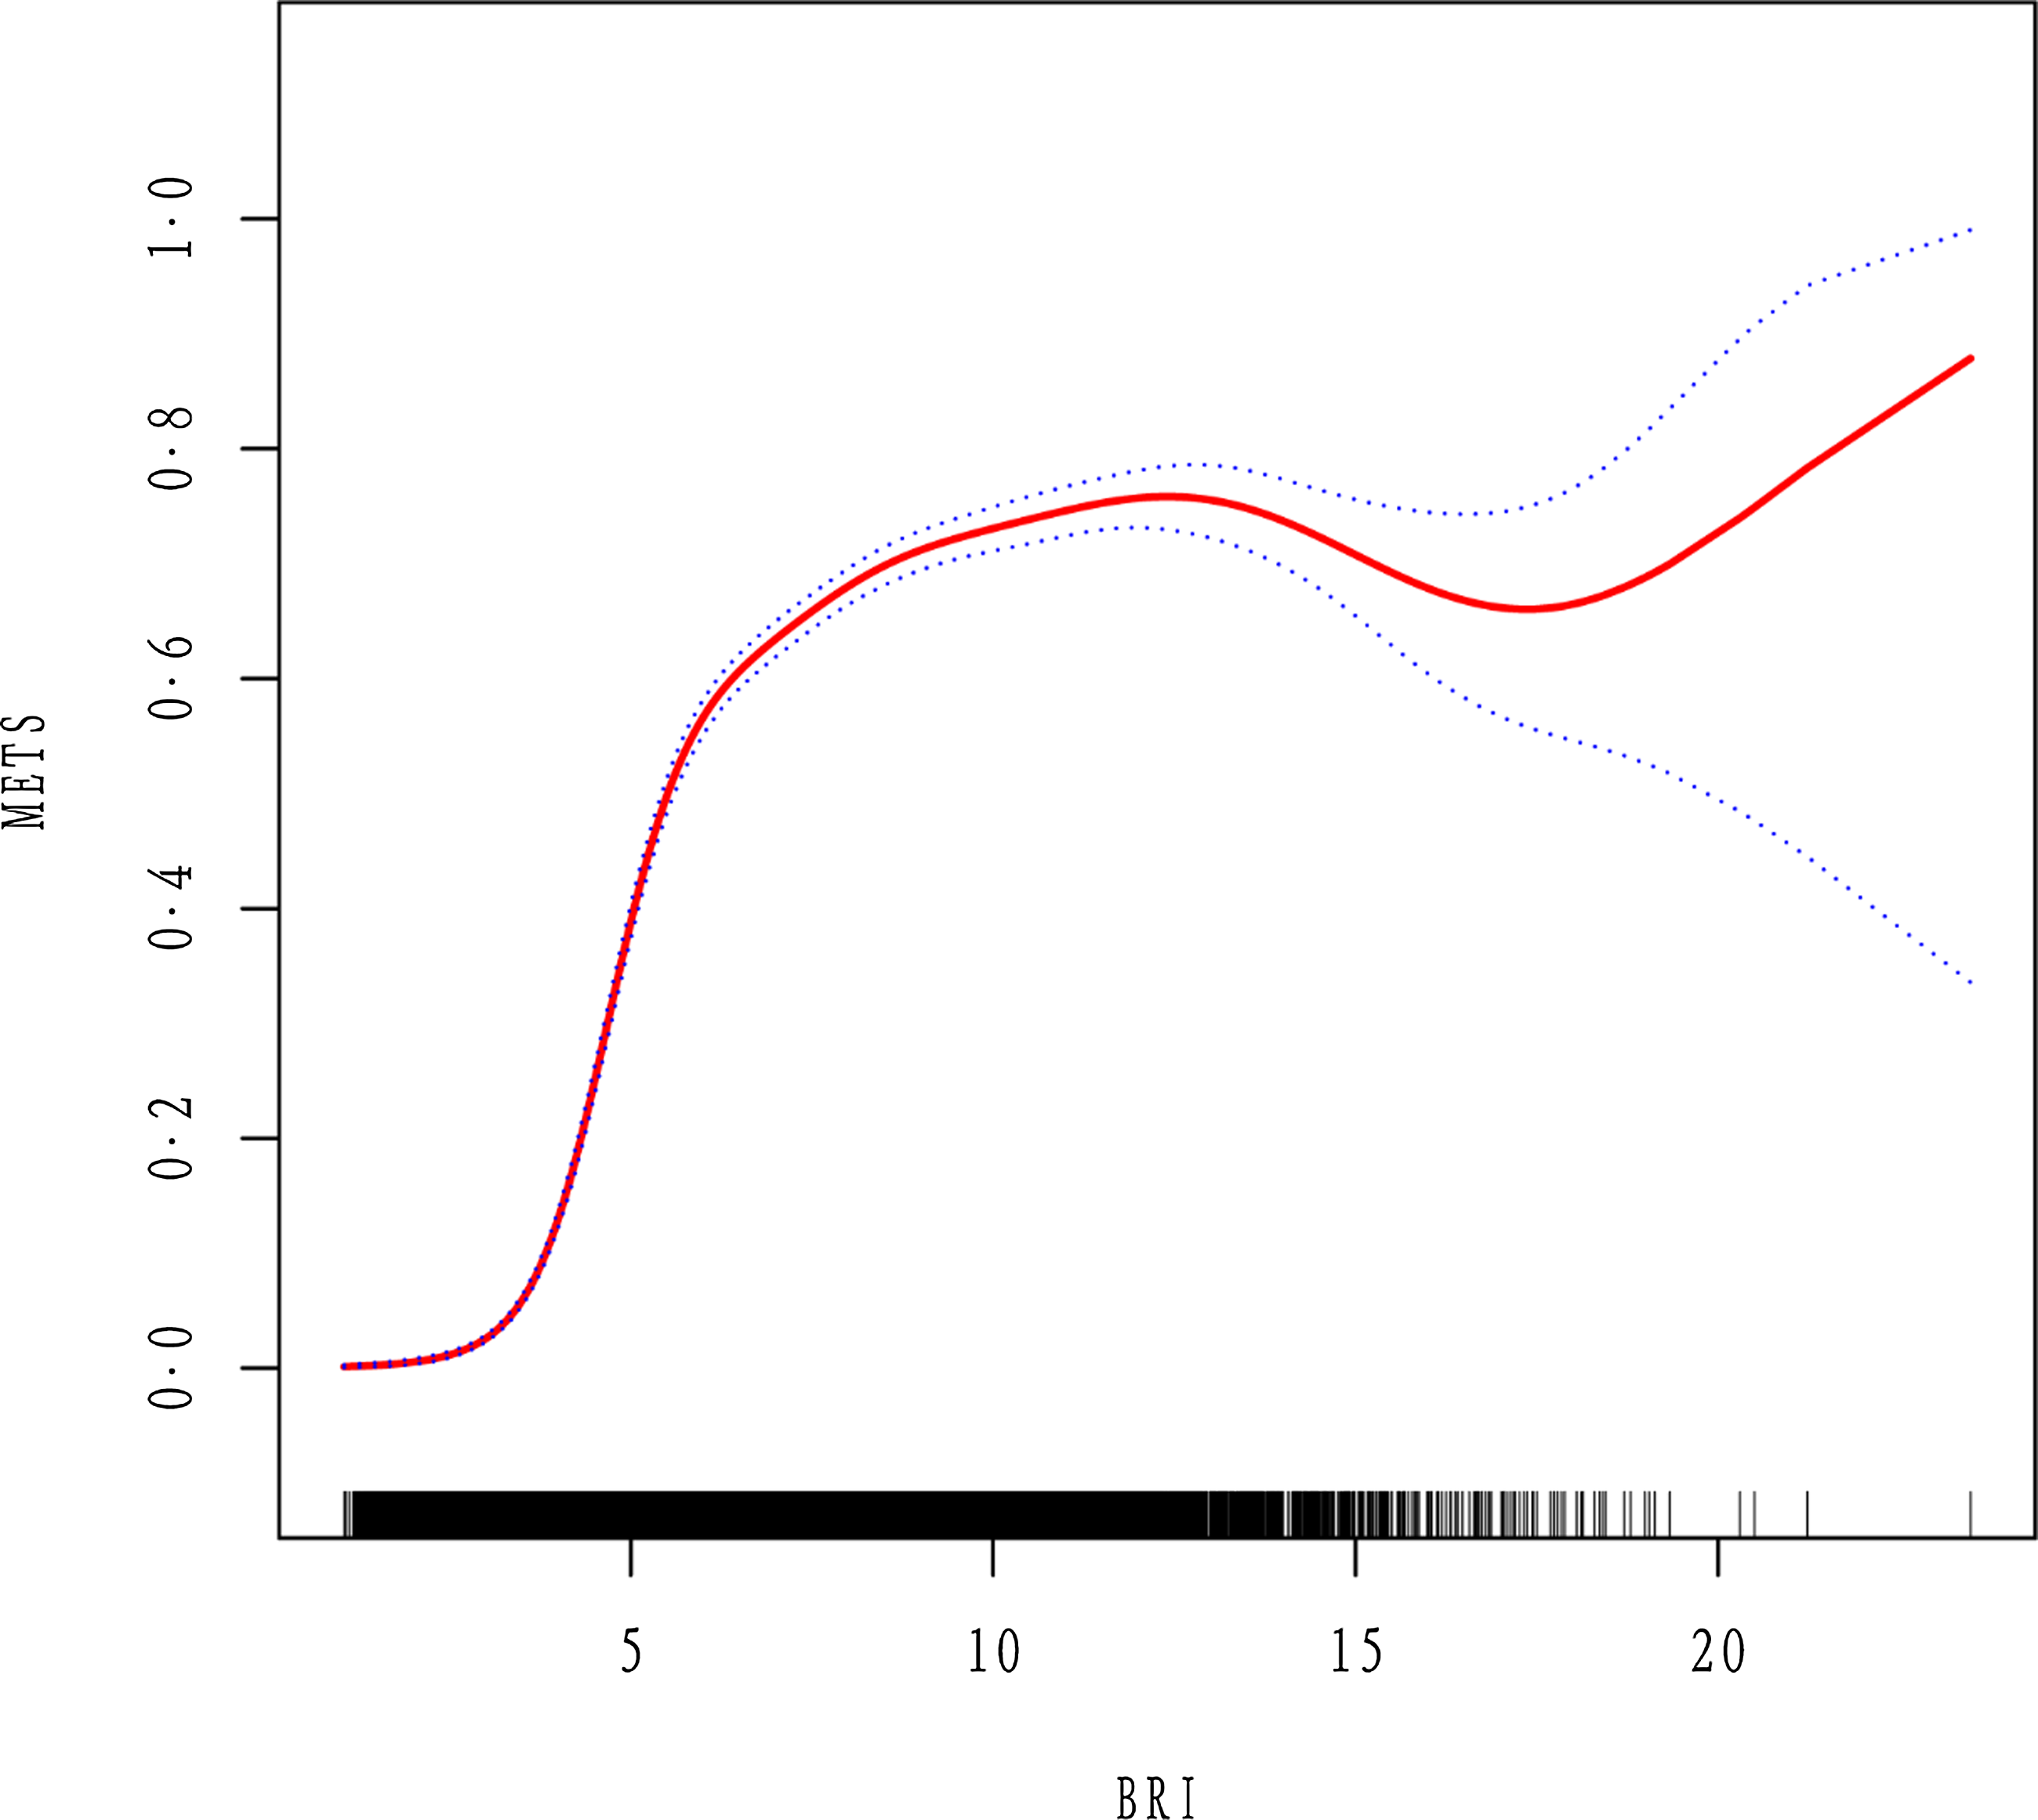
Fig. 2. The non-linear relationship between BRI and incident of MetS after adjusting for confound-ing variables.
Table 5. ROC analysis for continuous predictor.

BRI, body roundness index; HBA1C, glycosylated Hg, Type A1C; TC, total cholesterol; WC, waist circumference.
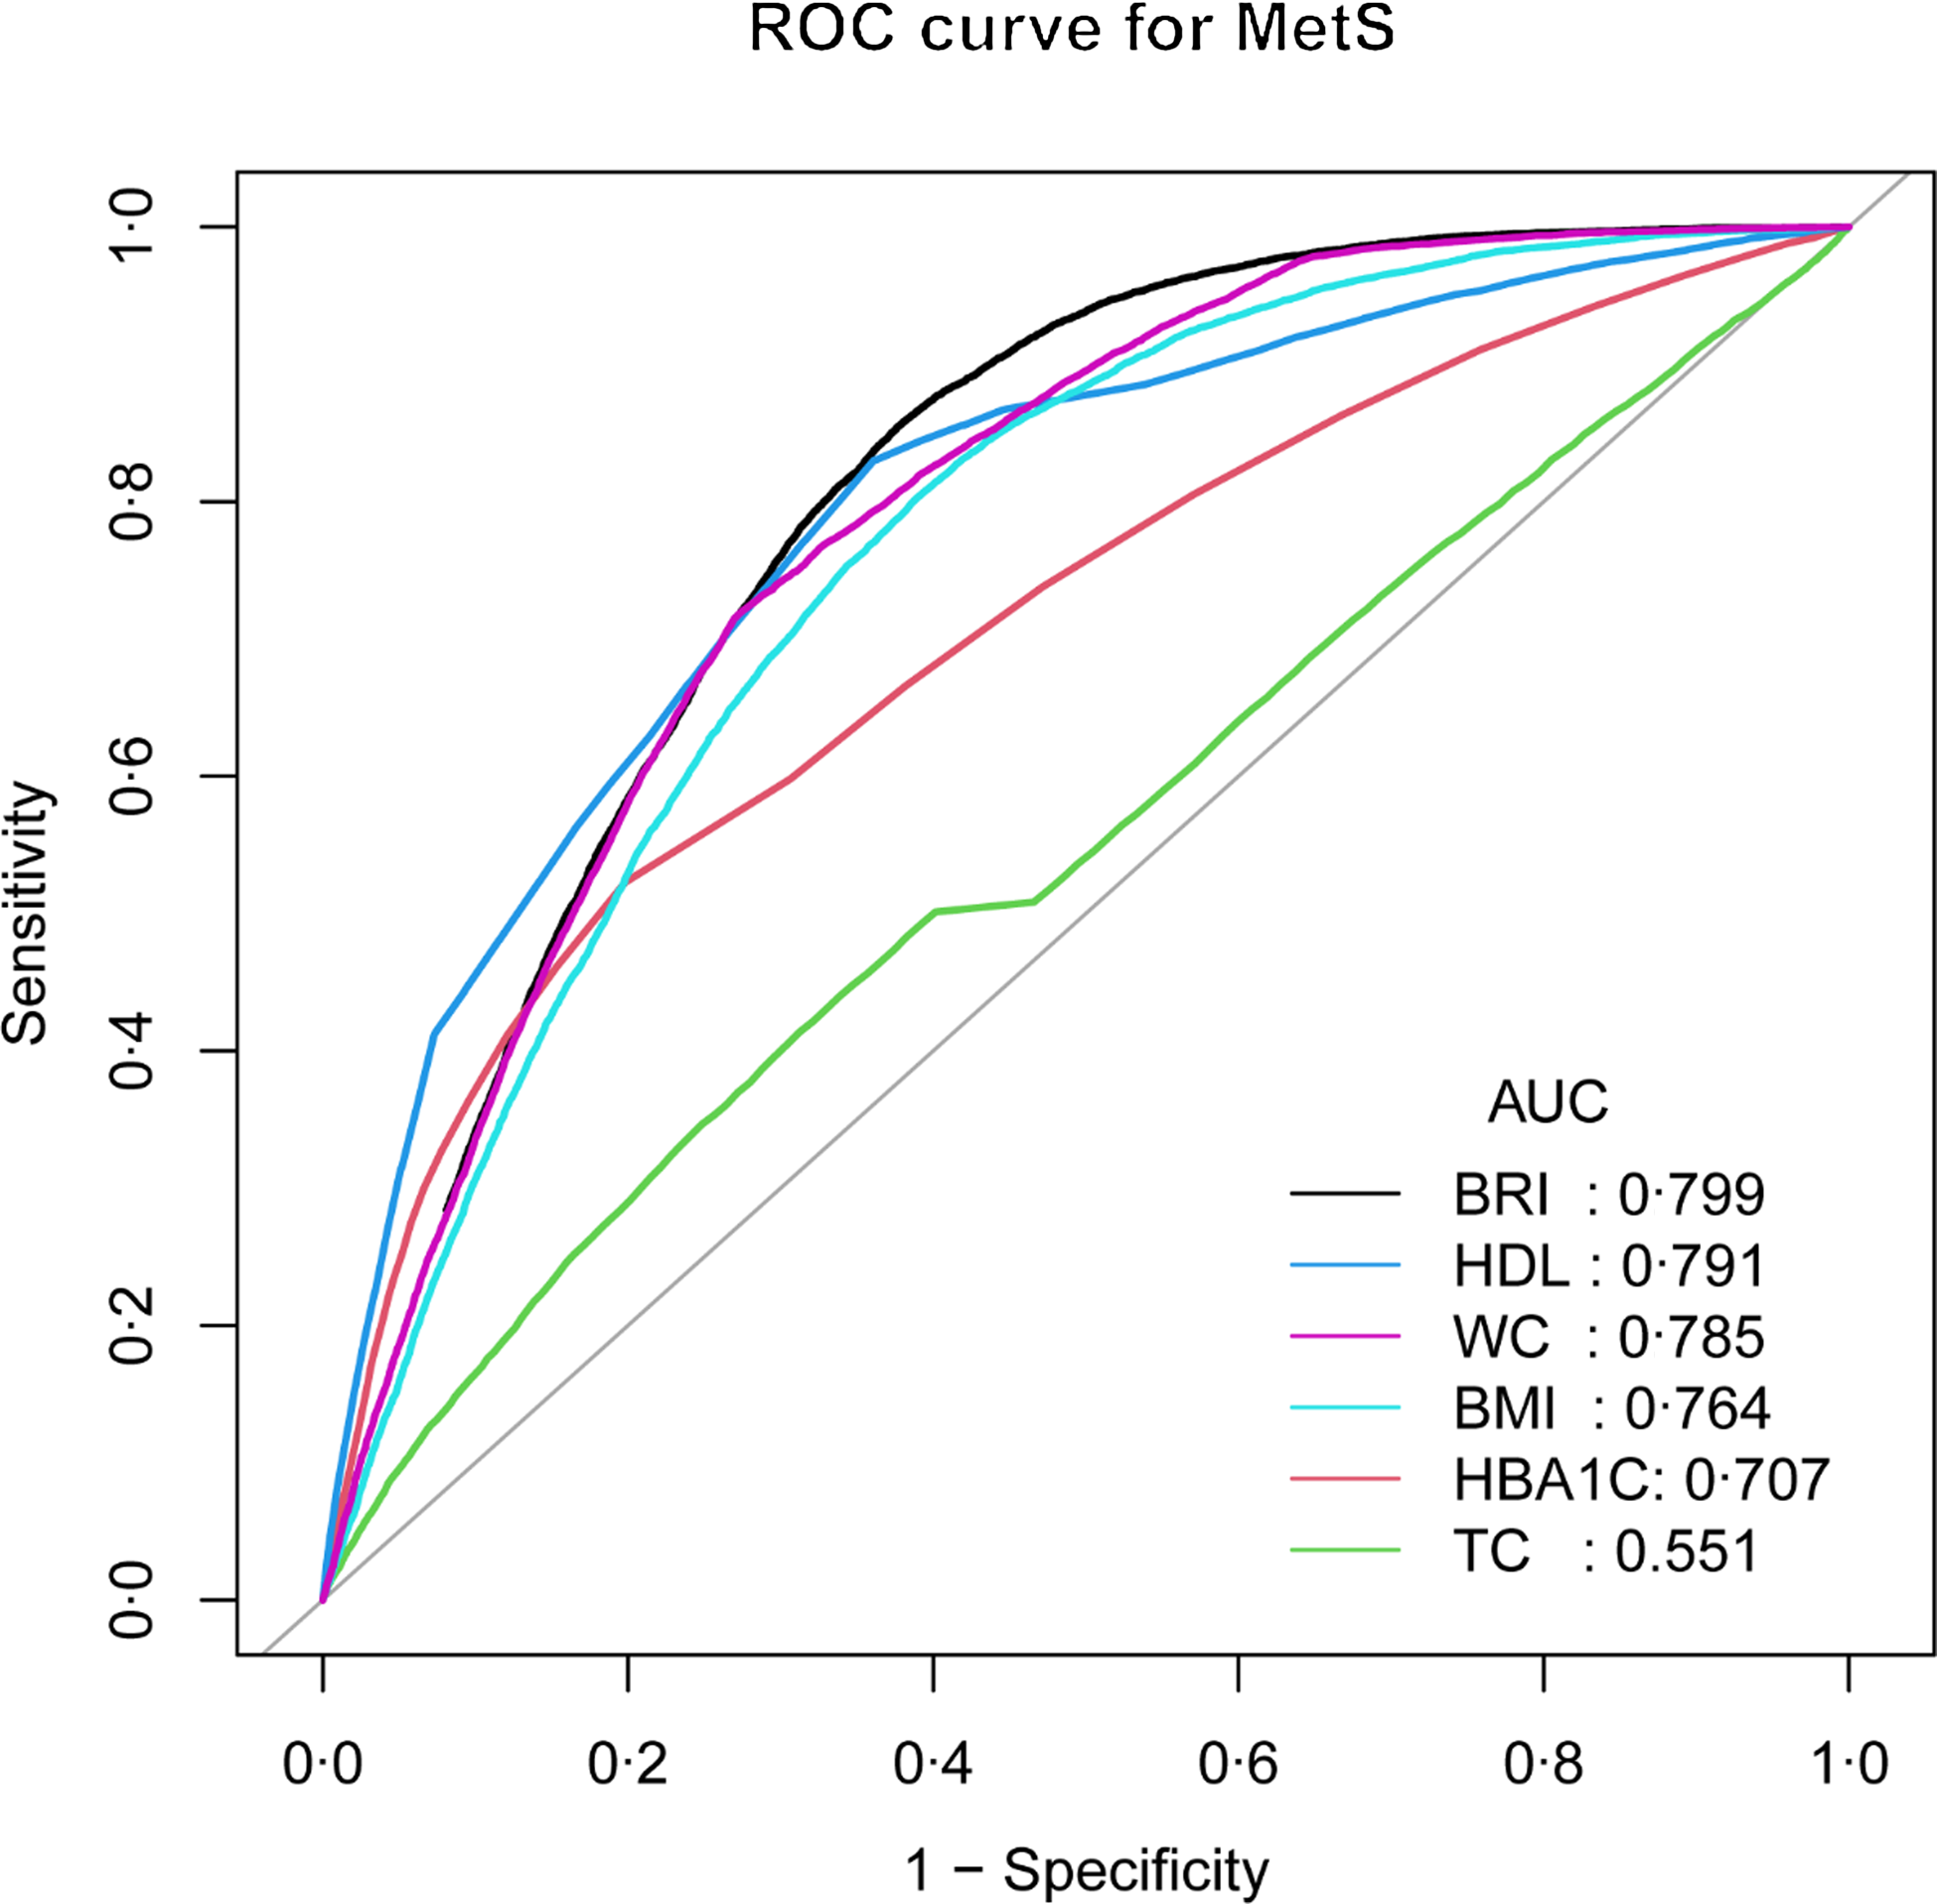
Fig. 3. BRI for predicting MetS in all participants by ROC analyses stratified by confounding variables.
Discussion
In this nationally representative data analysis, we determined the association of elevated BRI levels with the occurrence of MetS. The distribution of BRI was different across ethnic groups, with a gradual decrease in the proportion of non-Hispanic Whites and other races and an increase in the proportion of non-Hispanic Black and Mexican American as BRI increased. In addition, BRI was significantly associated with traditional cardiovascular risk factors, especially showing a high positive association with WC. Univariate regression analysis indicated BRI to be a moderate risk factor for MetS, and multivariate logistic regression analysis after adjusting for age, sex, race, DM and CVD found that BRI remained an independent risk factor for MetS. After adjusting for confounding variables (age, sex, SBP, DBP, smoking status, etc.), a non-linear relationship was found between BRI levels and the prevalence of MetS. More importantly, BRI predicted MetS with the largest AUC among anthropometric measures such as HbA1c, TC, HDL, BMI and WC. Noninvasive prediction of obesity-related indicators will be a simple and practical indicator of obesity, where BRI estimates human body shape as an ellipse using the relationship between waist circumference and height for predicting the percentage of body fat and visceral adipose tissue(Reference Gu, Li and He19–Reference Aguilar-Morales, Colin-Ramirez and Rivera-Mancía22). Its advantage over BMI and WHtR is considered to be its improved ability to predict body fat and visceral adipose tissue, which is closely associated with MetS(Reference Suliga, Ciesla and Głuszek-Osuch23–Reference Dong, Wang and Chu25). Although radiologic assessment of specific fat distribution in the body by instruments such as CT or MRI may have more accurate ratings, BRI is certainly a more economical and convenient operation for large-scale population screening. These data suggest that BRI can be used as a new anthropometric indicator for predicting MetS, providing clues for population screening and early clinical disease intervention.
The BRI is an obesity index based on WC and height, which is a better predictor of the amount of body fat and visceral adipose tissue than other anthropometric measures, including WC and BMI(Reference Wu, Zhu and Qiao11,Reference Li, Wu and Wu26,Reference Zhao, Zhang and Li27) . Stefanescu A’s team investigated the ability of anthropometric indicators (BRI, BMI, WC, a body shape index, etc.) to predict MetS in 1815 Peruvian adults and confirmed that BRI is a useful clinical predictor of MetS(Reference Stefanescu, Revilla and Lopez28). Liu PJ and Xu J’s team have both proposed that BRI could be used as a simple and cost-effective index to evaluate cardiometabolic risk factors in Chinese adults, which predictive ability is better than other anthropomorphic indices(Reference Liu, Ma and Lou29,Reference Xu, Zhang and Wu30) . Another study showed that the best critical and AUC values achieved by BRI and other anthropomorphic indices have a clinical approach to identifying MetS and its components among Southern-Indian adults(Reference Endukuru, Gaur and Dhanalakshmi31). Previous studies in the USA population did not explore a possible curve-like relationship between BRI and MetS, so this study is the first to analyse the non-linear relationship between BRI and MetS. In addition, our results suggest that BRI is equally effective as a clinical predictor of MetS in the USA population, which is consistent with previous studies in other populations.
Limitation
There are some limitations to this study. First, because our study only involved the USA population, the results of this study are not representative of other ethnic groups and regions. Second, this retrospective observational study provided an association between BRI and MetS onset, so these results need to be further validated by prospective studies. In addition, this study did not directly compare the association of BRI, BMI, WC, WHtR, WHR, ABSI and BAI with an increased risk of MetS, which may need to be strengthened in future studies.
Conclusions
Our study suggested that the distribution of BRI is different among ethnic groups in the USA, that there is a non-linear relationship between BRI and MetS and that BRI, as a new anthropometric indicator, is a better predictor of MetS than other traditional anthropometric indices.
Acknowledgements
This work was supported by the Chongqing Postdoctoral Innovative Talents Support Program Fund (CQBX202212 to Zhenhan Li), the Chongqing Natural Science Foundation (CSTB2022NSCQ-BHX0690 to Zhenhan Li), the Chongqing Municipal Science and Health Joint Medical Research Project (2023QNXM002 to Zhenhan Li) and the Clinical Research Project of Tongji Hospital of Tongji University (Grant No. ITJ(QN)2203 to Jun Qian).
Conceptualisation, J. Q. and Z. L.; methodology, C. F.; software, J. Q.; validation, X. Y.; data curation, C. F. and J. H.; writing – original draft preparation, Z. L.; writing – review and editing, Z. L. and J. Q.; supervision, Z. C. and X. Y.; project administration, J. Q. All authors have read and agreed to the published version of the manuscript.
The authors have no conflicts of interest to disclose.
The data that support the findings of this study are openly available in (NHANES) at (https://www.cdc.gov/nchs/nhanes/index.htm).
NHANES protocol approved by NCHS Research Ethics Review Board and obtained informed consent from all participants.


