


Introduction
With an increasingly long time-series of parameters from the upper atmosphere, it is becoming viable to investigate climatology. Upper atmosphere trends or change can reflect corresponding ones in the troposphere (Hall et al., Reference Hall, Brekke and Cannon2007; Roble & Dickinson, Reference Roble and Dickinson1989), but at an altitude not directly influenced by local short-term effects. One endeavours to establish the mechanisms responsible for observed trends, one contender being solar forcing: the focus of this study and that of Lastovicka (Reference Lastovicka2019). Once this effect has been removed, it may be possible to identify others, including anthropogenic causes, if any.
Objective
The results of Lastovicka (Reference Lastovicka2019) do not include observations from the auroral region nor from earlier than 1980. The observations in Tromsø (69.6°N, 19.2E) going back to the 1930s provide these additions, thus supplementing Lastovicka's study.
Methods
The parameters used here are obtained from the ionosonde located near Tromsø, Norway (69.6°N, 19.2E) and in particular the local noon critical frequencies of the ionospheric E- and F2-layers (“foE” and “foF2” respectively, in MHz). The instrument is fully described by Hall and Hansen (Reference Hall and Hansen2003). The underlying physics of the ionosphere is reliably described by Ratcliffe (Reference Ratcliffe1972). The principles of ionosonde operation are fully accessible in Reinisch (Reference Reinisch, Kohl, Rüster and Schlegel1996) and references therein. The international standard reference for scaling ionograms in order to determine foE and foF2 is the URSI handbook of ionogram scaling and reduction available here:
http://www.sws.bom.gov.au/IPSHosted/INAG/uag_23a/uag_23a.html (accessed 2020.02.28).
Corresponding sunspot numbers as yearly totals were obtained from the World Data Center SILSO, Royal Observatory of Belgium, Brussels. Lastovicka (Reference Lastovicka2019) used F10.7 rather than the sunspot-number. However, the dataset presented here goes further back in time than the available F10.7, hence the choice of sunspot number.
Linear regressions were performed on running 11-year periods for foE and foF2 and corresponding periods of sunspot numbers (identical to the method used by Lastovicka).
Results
In Figure 1, the results are grouped as two parameters, foE (MHz) and foF2 (MHz). For each, the annual means are portrayed and with a 3-year running median applied to remove misleading spikes. In both cases the 11 year periodicity of the solar cycle is very evident (sunspot number is not shown explicitly in here as it is readily available elsewhere). The time series show results from the start of regular operation in 1938. For each parameter, the solar dependence is demonstrated by a linear regression including the 95% confidence limits (Working & Hotelling, Reference Working and Hotelling1929): 2.1 ± 0.1 MHz/100 sunspots, for foF2 and a high degree of confidence; 0.2 ± 0.1 MHz/100 sunspots, for foE and a considerably lower degree of confidence. The latter, foE, demonstrates the much weaker dependence compared with foF2 as shown by Lastovicka (Reference Lastovicka2019), but considerably more variable, reflecting the mechanisms in the auroral zone. A caveat here is that sunspot-number can be used as a proxy for f10.7 flux, although Lastovicka (Reference Lastovicka2019) suggests this may not be as well defined as hitherto assumed.
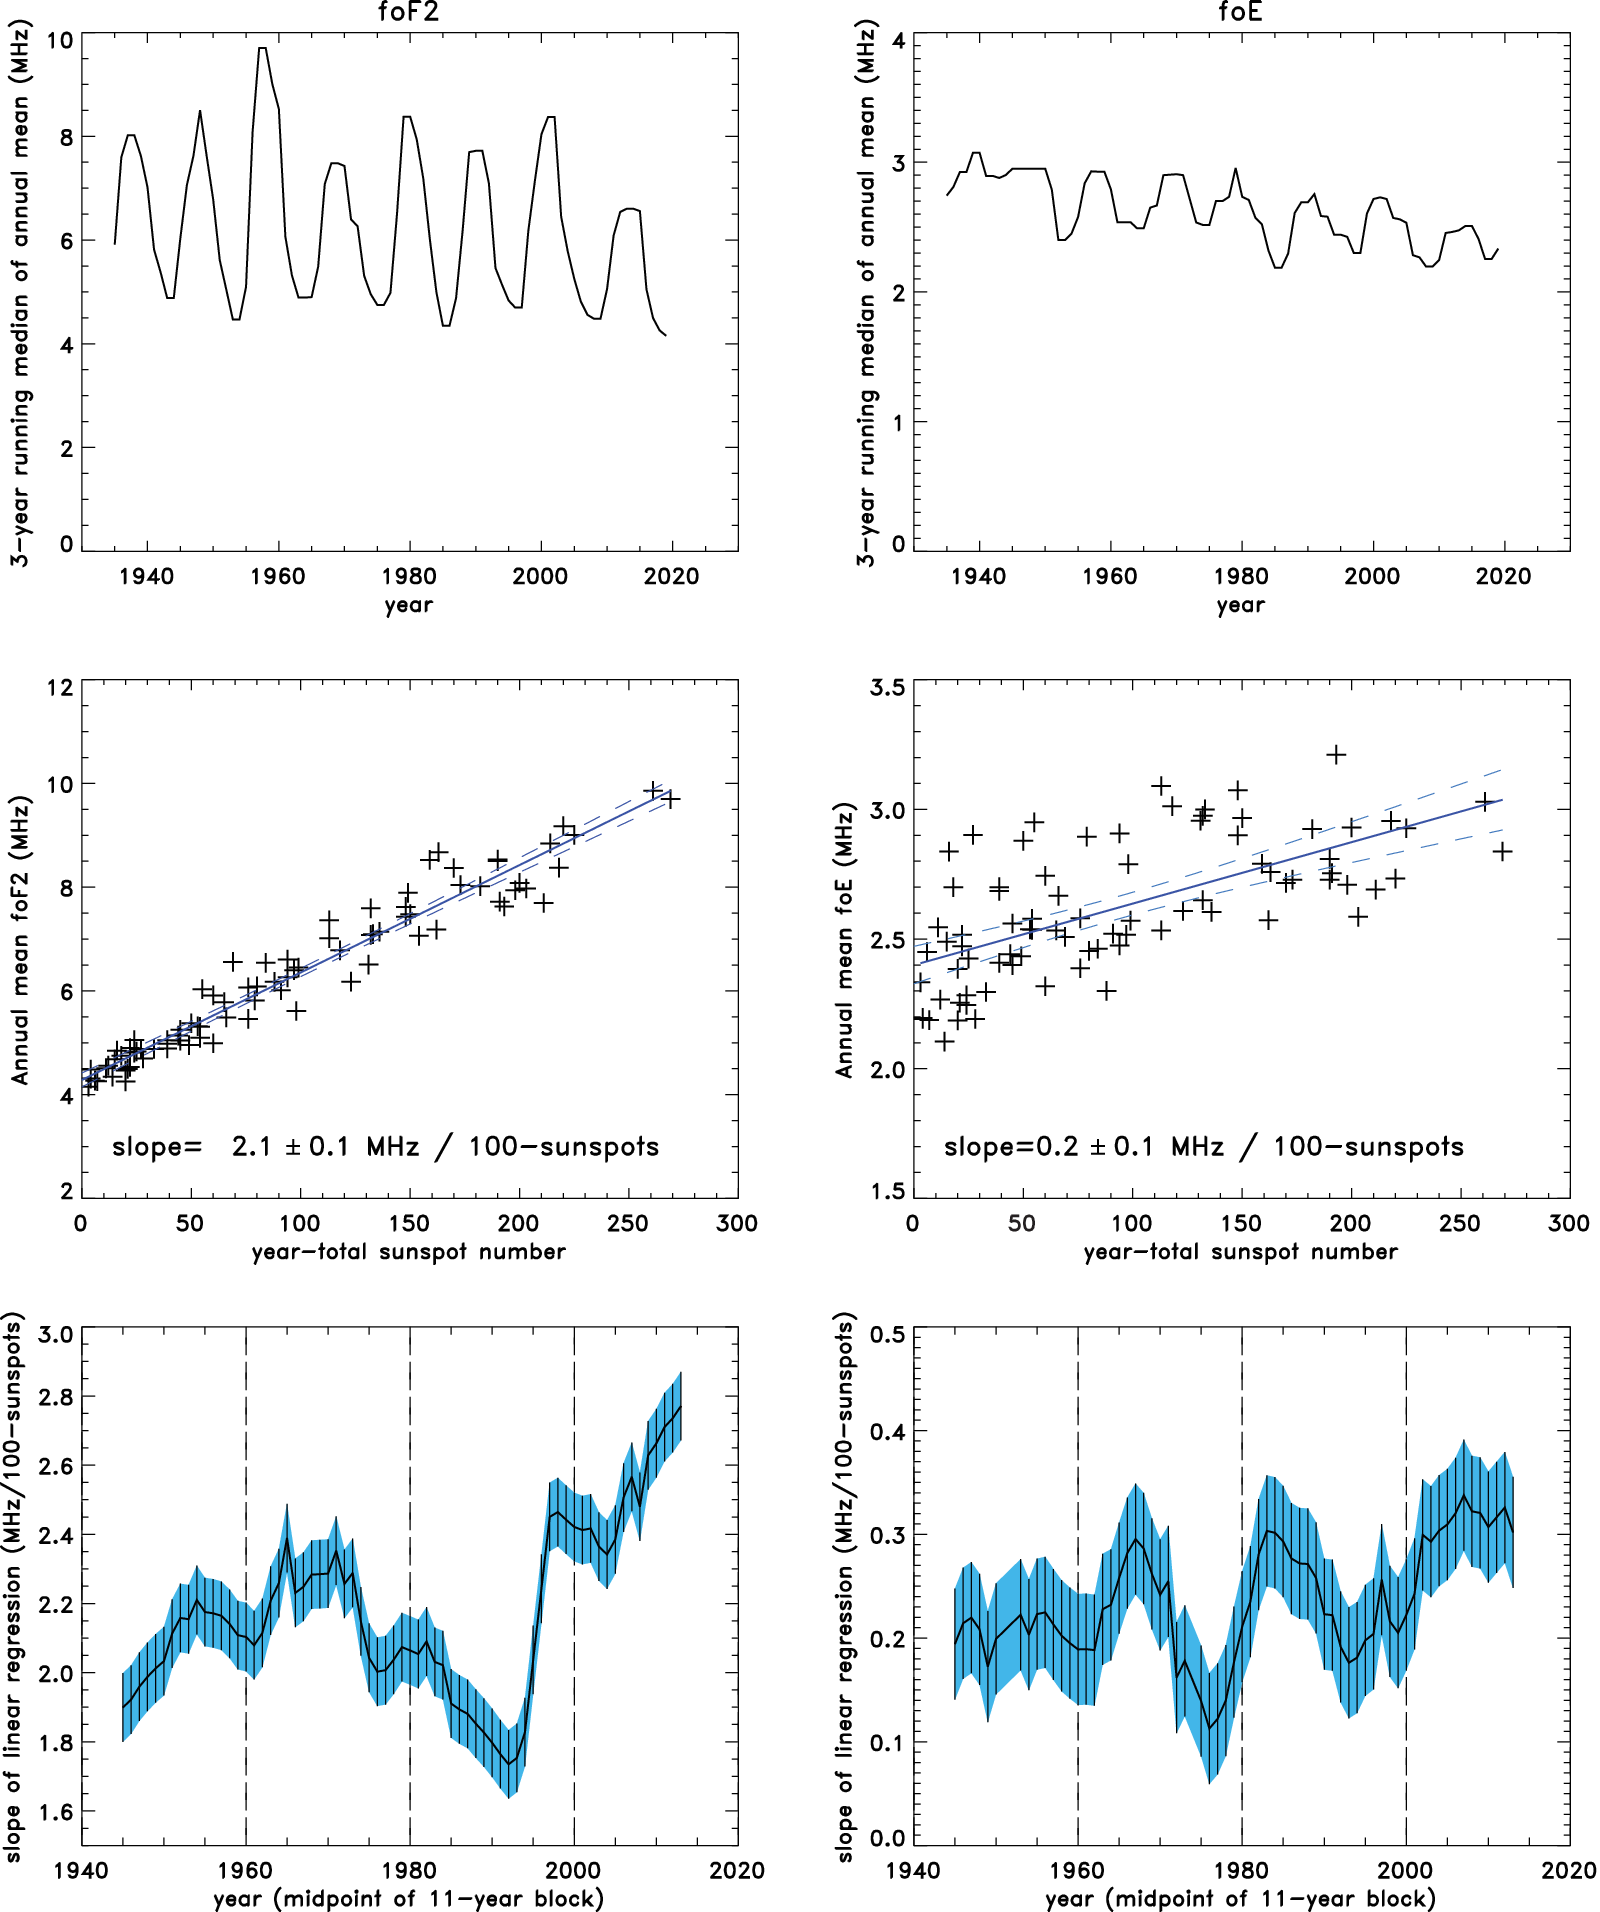
Figure 1. Underlying data and subsequent analyses of the foF2 and foE time series. Left-hand column: foF2; right-hand column: foE. Top row: annual means of local noon observations, and with a 3-year running median filter to remove anomalous years (e.g. featuring instrument-changes etc.). Centre row: regressions on yearly total sunspot numbers obtained from WDC SILSO, Royal Observatory of Belgium; dashed lines show the 95% confidence limits and annotation shows the slopes of the regression and 1-σ uncertainty. Bottom row: 11-year running regression on corresponding sunspot number, replicating the approach of Lastovicka (Reference Lastovicka2019); vertical bars and shading indicate 1-σ uncertainties.
Discussions
The existence, of the F2 layer is due to a combination of electron production, loss and advection, not necessarily in that order. The E-region, on the other hand is characterised as a typical Chapman phenomenon with ionisation and recombination occupying shorter timescales (e.g. Hargreaves, Reference Hargreaves1992). Solar forcing is responsible for initial ionisation, but thereafter observations of the F2-layer do not necessarily reflect that forcing of the local ionosphere; on the other hand, presence of the E-region is the result of solar origins above the geographic location of the observation. It is not surprising, therefore that the respective responses of foF2 and foE to sunspot number are very different. Compounding this, E-layer production in the auroral zone is considerably influenced by energetic precipitation originating from enhanced solar activity compared with equatorward latitudes (Qian et al., Reference Qian, Wang, Burns, Chamberlin and Solomon2020).
Conclusions
For the high-latitude F2-layer, there is a distinct increase in dependence of critical frequency on sunspot-number in 1996, in full agreement with similar observations at mid-latitude (Lastovicka, Reference Lastovicka2019). A somewhat gradual decrease in dependence can be seen between 1960 and 1995. For the corresponding E-layer, however, the increase reported by Lastovicka (Reference Lastovicka2019) for 2000 is not at all obvious, whereas the dependence since 1960 is more characterised by large fluctuations; we attribute this difference to processes in the auroral region not present at lower latitudes.
Funding Information
This research received no specific grant from any funding agency, commercial or not-for-profit sectors.
Conflict of interest
There is no conflict of interest – the contribution is purely supplementary to a publication.
Data availability
Data used in this study are available from Tromsø Geophysical Observatory as part of its national obligation, and as a department of UiT – The Arctic University of Norway – https://en.uit.no/startsida.


 Open access
Comments
Comments to the Author: The paper is well organized It is suitable for Experimental Results Journal I think the introduction is too short