


1. Introduction
The performance of the U.S. dairy industry has a far-reaching influence on the economic conditions in many segments of the broader agricultural sector. This is especially the case for markets of crops used as feed since feed comprises the largest share of dairy operating costs (Mark et al., Reference Mark, Burdine, Cessna and Dohlman2016). Changes in feed demand and prices in turn greatly affect dairy operation profitability. The milk-over-feed (MF) margin, which is the difference between the milk price and a composite price for common dairy feeds (e.g., hay, corn, soybeans), is a common proxy for dairy profitability in the literature (Wolf, Reference Wolf2010). The MF margin is also important from a policy perspective. Since 2008, payment criteria for programs designed to provide income support for dairy farmers established within Congressional agricultural policies (i.e., Farm Bills), have been based on the MF margin (Mark et al., Reference Mark, Burdine, Cessna and Dohlman2016). The most recent Farm Bill of 2018 established the Dairy Margin Coverage (DMC), a variation of the 2014 Farm Bill’s Margin Protection Program (MPP)Footnote 1 . Under the DMC, the MF margin used to determine indemnity payments is calculated using the national all-milk price, national prices of corn and alfalfa hay, and soybean meal prices from Decatur, Illinois, USA (USDA-FSA, 2019). The MF margin is also important for other risk management tools such as forward contracting, which allow dairy producers to manage both output and input price risk based on an MF margin target (Wolf and Olynk Widmar, Reference Wolf and Olynk Widmar2014).
Since dairy support programs are national in scope, there is an issue regarding whether the national MF margin reflects actual conditions due to substantial regional variation in the MF margin as determined by local market conditions (Mark et al., Reference Mark, Burdine, Cessna and Dohlman2016). Results in a recent study by Skevas et al. (Reference Skevas, Thompson, Brown and Cabrera2020) show that there is not a strong relationship between the national MF margin and actual MF margins of dairy farms in Wisconsin. The primary objective of this study is to explain why there can be variation in the actual MF margins across regions and over time. Focus is placed on changes in hay market conditions across Western U.S. states, where the use of hay for dairy feed is commonplace (Klonsky, Reed, and Putnam, Reference Klonsky, Reed, Putnam, Summers and Putnam2007). Conditions in hay markets are of interest because hay is grown in more than 42 states (Hopper, Peterson, and Burton Jr., Reference Hopper, Peterson and Burton2004), possibly inferring that some local demand is met with local supply in virtually all regional markets in the U.S.
The focus of this article is on the relationship between hay and milk prices in states that have experienced substantial growth in their dairy industry in recent years. It is hypothesized that the expansion of the dairy industry may lead to an increase in hay demand and cause demand to become more price inelastic. The increase in demand and greater price inelasticity is coupled with “tighter” hay markets, such that quantities of marketable hay are lower in most periods than was the case without the larger dairy industry. When hay markets are tight, there is a greater likelihood for substitution among alternative feed crops (e.g., barley, corn silage, wheat), thus leading to a lower (dynamic) relationship between hay and milk prices. One measure of market tightness is the stocks-to-use ratio. Low stocks-to-use ratios imply that there is little supply available for sale, which can cause increased price responsiveness to demand-related factors (Hatzenbuehler, Abbott, and Foster, Reference Hatzenbuehler, Abbott and Foster2016). Such occurrences are more likely when feed substitution is not possible or available than when it is. Another important factor that can exacerbate hay market tightness is the demand for hay exports (Tejeda, Kim, and Feuz, Reference Tejeda, Kim and Feuz2019). The effects of such demand changes from exports on hay markets are seemingly greater when there already is a low marketable supply.
The empirical analysis focuses on hay market conditions in three U.S. states that have experienced the greatest dairy industry growth since 2000: California, Idaho, and New Mexico. For these states, the hay-to-milk price relationship was estimated to determine if there is greater responsiveness in this relationship after a dairy industry expansion than before an expansion. Moreover, additional hay-to-milk responsiveness models that included particular hay market demand characteristics factors were also estimated. The specific factors considered were low stocks-to-use ratios and higher-than-normal exports. In periods when these factors are relevant, it was expected that hay-to-milk price responsiveness is likely different than for periods of normal stocks or exports.
The results provide support for the main hypothesis of increased hay-to-milk price responsiveness after dairy industry expansion for each of the analyzed states. Conversely, the effects on hay market tightness from studied factors varied across states. There is statistical evidence of less hay-to-milk price responsiveness during periods of low stocks-to-use conditions in California and New Mexico. This effect was not statistically significant for Idaho. There is also statistical evidence of reduced hay-to-milk price responsiveness in periods of higher-than-normal hay exports for California, but not for Idaho nor New Mexico. Lower hay-to-milk price responsiveness under these considered factors or conditions is most plausibly due to feed substitution.
2. Background: Dairy Industry Expansion Effects on Hay Markets
Since 2000, substantial growth in dairy production has occurred in some U.S. states while it has been either stable or declining in others. Figure 1 shows a plot of milk cow inventories for 2000–2019 for the top five milk-producing states, based on 2019 dairy industry cash receipts as recorded by USDA-ERS. These states, in order from highest to lowest, are California, Wisconsin, Idaho, New York, and Texas. The data indicate that dairy cow inventories were higher in 2019 than in 2000 for California, Idaho, and Texas, but lower for Wisconsin and New York. Moreover, rapid expansion periods are observed for California in the early 2000s, Idaho for the early to mid-2000s, and Texas for the mid-2010s to 2019. Table A1 in the online supplementary appendix shows the rates of growth in cow inventories for the top 10 states considering dairy industry cash receipts from USDA-ERS for 2002–2019. In addition to California, Idaho, and Texas, another state with substantial dairy industry growth during this observation period is New Mexico. The remaining large dairy-producing states have not had as notable trends of substantial growth. However, Michigan and Washington have had a few years of relatively high growth.

Figure 1. Dairy cow inventories for top five (as of 2019) dairy-producing U.S. states, 2000–2019.
Source: USDA-NASS and USDA-ERS.
The substantial growth in the dairy industries observed in California, Idaho, and New Mexico can have substantial effects on linked markets, especially those for feed. The United States Department of Agriculture (USDA) does not demarcate among hay consumption segments, the main of which are feed, stocks, and exports, in its reports, as it does for corn. Estimation of hay consumption for feed is difficult given the tendency of dairy producers to substitute across feed types based on nutritionists’ preferences, market conditions, and/or other factors. However, to illustrate these effects, feed ration parameters established by the National Research Council (NRC) help to describe plausible changes in hay consumption for feed under a dairy industry expansion. The dairy feed-related parameters are about 20 kg of dry matter intake (DMI) per day per cow, with the ratio of forage (hay or corn silage) to concentrate at 3:2 (NRC, 2001). These parameters imply that the share of hay production used for dairy feed may experience growth rates like those of dairy cow inventories during a considerable dairy industry expansion.
Of the primary components of hay consumption, export demand is likely more price elastic than that for feed and stocks because foreign buyers can substitute among export competitors (Abbott, Reference Abbott2013). By comparison, commercial dairies tend to make adjustments in input purchase strategies, including those for feed, over longer periods of time (Wolf, Reference Wolf2010). This implies relatively price inelastic feed demand in comparison to that for exports.
The hay market is unique to those of other feed crops in several ways. First, trade on international markets is generally not a substantial share of total use or production, so market conditions are more driven by national and regional supply and demand factors (Wolf, Reference Wolf2010). California is an exceptional case regarding this, and export volumes vary across years for all analyzed states (see Table 1). Additionally, while there are several feed crop sources for the fiber component of dairy rations, there are few substitutes for alfalfa hay as a source of crude protein among forages (Hopper, Peterson, and Burton Jr., Reference Hopper, Peterson and Burton2004; Chahine, Reference Chahine2020).Footnote 2 This means that a substitute dairy ration for hay requires the substitution of the fiber and protein sources (NRC, 2001). Such determinations are likely different and complex depending on the region, and so use of substitute feeds may occur out of necessity such as during a lack of hay availability, hay expected availability, or of funding (cash flow) availability during periods of unusual market conditions.
Table 1. Summary statistics for dairy industry expansion, exports, hay stocks-to-use ratios, and prices for 2002–2019

Figure 2 is a theoretical representation of a regional hay market in the U.S. before and after a dairy industry expansion. It builds on the theory of the U.S. corn market during the “ethanol boom” of 2006–2008 developed by Abbott (Reference Abbott2013). During the “ethanol boom,” the corn market was impacted by expanding ethanol production capacity and by intermittently binding capacity constraints in the ethanol industry (Abbott, Reference Abbott2013). The top left panel characterizes the conditions before dairy industry expansion. The two principal components related to demand are stocks and feed. Total demand is the sum of demand for stocks and feed. Consistent with the theory explained in Wright (Reference Wright2011), stocks demand is very price inelastic. Demand for feed is also price inelastic, but becomes more elastic at higher demand levels because alternative substitute feeds may become convenient at greater feed levels. Total demand at quantities greater than the short-run supply level ( ${S_{SR}}$
) is perfectly price elastic because substitution becomes mandatory due to lack of availability. The last element of the top left panel assumes there is an increase in demand, perhaps due to exports. In such a case, demand shifts from
${S_{SR}}$
) is perfectly price elastic because substitution becomes mandatory due to lack of availability. The last element of the top left panel assumes there is an increase in demand, perhaps due to exports. In such a case, demand shifts from ${D_{total}}$
to D'total
, and the price increases from
${D_{total}}$
to D'total
, and the price increases from ${p_0}$
to p'0
(Δ
0).
${p_0}$
to p'0
(Δ
0).

Figure 2. Representation of a regional hay market before and after dairy industry expansion.
Source: Authors.
Note: Δ for change.
The top right panel of Figure 2 shows the conditions in the hay market after a dairy industry expansion. The demand for stocks and feed is greater for both stocks and feed, which implies higher total demand. The shift in total demand to the higher level increases the base hay level price to ${p_1}$
, where
${p_1}$
, where ${p_1} \gt {p_0}$
.
${p_1} \gt {p_0}$
.
The bottom panel of Figure 2 introduces the situation in which there is an increase in demand for hay in the period after the dairy expansion, once again considering an increase in exports. In such a case, demand shifts outward from ${D_{total}}$
to
${D_{total}}$
to $D{'_{total}}$
, where the market equilibrium (
$D{'_{total}}$
, where the market equilibrium ( ${Q_s} = {Q_d}$
) is now at the very price inelastic portion of the hay demand curve. This results in a price increase from
${Q_s} = {Q_d}$
) is now at the very price inelastic portion of the hay demand curve. This results in a price increase from ${p_1}$
to
${p_1}$
to $p{'_1}$
(
$p{'_1}$
( ${\Delta _1}$
), where
${\Delta _1}$
), where ${\Delta _1} \gt {\Delta _0}$
. Any excess quantity demanded (
${\Delta _1} \gt {\Delta _0}$
. Any excess quantity demanded ( $Q{'_d}$
) is met through substitution to other feed types.
$Q{'_d}$
) is met through substitution to other feed types.
There are several takeaways from Figure 2. First, the increased demand for stocks after the dairy industry expansion makes the overall hay market tighter. That is, for future feed purposes, there is less hay available for sale after the dairy industry expansion than was the case before. Second, with the increased demand and more inelastic demand associated with the dairy expansion, the price effects from changes in demand due to other factors are larger than they were prior to the dairy industry expansion. Third, excess demand beyond short-run supply is perfectly price elastic, where excess feed demand is fully met with substitutes.
The implications regarding the dairy industry expansion for the hay and milk price relationship are as follows. First, after the dairy industry expansion in which the hay market may be tighter, milk price changes would have a greater effect on hay prices than in the case prior to expansion. That is, in the post-expansion case, an increase (decrease) in the milk price would be more likely to translate to an increase (decrease) in the hay price than before the expansion because hay market equilibrium more plausibly occurs where demand is relatively price inelastic. Thus, hay and milk prices are expected to have a closer or higher dynamic relationship after the dairy expansion than before. Second, after the dairy expansion has occurred, other irregular “shocks” to demand, such as an unanticipated change from normal demand for exports, would have a greater influence on hay-to-milk price responsiveness than observed before the expansion.
Given this theoretical background, it is hypothesized that the extent to which hay and milk prices move together has varied over time. Specifically, there has likely been greater hay price responsiveness to milk prices after the high dairy industry growth period of the early 2000s for the analyzed states than before. Figure 3 includes plots of hay and milk prices for California, Idaho, and New Mexico for 2002–2019. The plots show that hay prices in each of these states had distinct trends and variations over time. Moreover, hay price levels were generally higher in the 2010s than in the 2000s for all states. These observations seem to support the conjecture that local market conditions are important for determining outcomes in hay markets but that some shared or similar exogenous factors also have effects. For the case of the milk price series, more similarity in trends and variability is apparent across states than in the case of hay. For Idaho and New Mexico, it appears that the trends in hay and milk prices were more similar in the latter part of the 2000s through 2019 than during the early 2000s.

Figure 3. California, Idaho, and New Mexico hay and milk prices, 2002–2019.
Source: USDA-NASS.
While the data appear to show that the hay-to-milk price responsiveness has changed over time, questions remain about whether our hypothesized factors regarding hay market demand characteristics help explain such changes. The objectives for the empirical analysis are to test whether the following theory-derived hypotheses are consistent with the data:
-
1. Hay price variation is explained more by variation in the milk price after the dairy expansion than was the case before expansion.
-
2. The hay and milk relationship is different in periods when stocks-to-use ratios are low and there is higher-than-normal export demand than under normal stocks and export conditions.
3. Data and Estimation Method
The price data are monthly observations covering the period of January 2002–December 2019 from the USDA-NASS. They are the hay prices received in $/ton and milk prices received in $/cwt, for California, Idaho, and New Mexico, respectively. January 2002 was chosen as the start date for the analysis based on the availability of state-level export data.
USDA-NASS data on annual dairy cow inventories were used to identify periods of rapid dairy industry expansion in the analyzed states. A dummy variable representing the period after rapid dairy industry expansion (post-expansion) was created. For this variable, the post-expansion period begins in the year in which the year-to-year growth rate was lower than the previous value, and the subsequent year growth values were also lower. Thus, these variables have a value of 1 for all months in years after the period of rapid dairy industry expansion, and a value of 0 otherwise. The post-expansion periods for each state were as follows: California, 2004–2019; Idaho, 2007–2019; and New Mexico, 2007–2019. The growth rates for cow inventories for the “expansion” and “post-expansion” as defined are included in the summary statistics (Table 1). A more technically accurate name for the variable is a “post-rapid expansion” since growth occurred in some years in the “post-expansion” period as defined. However, “post-expansion” is used for brevity since the variable for all analyzed states represents a similar change in hay market demand conditions from before and after a considerable dairy industry expansion.
Hay exports data for each state were obtained from the U.S. Census Bureau USA Trade Online data set. The data obtained were annual values in U.S. dollar (USD) termsFootnote 3 . These values were converted to quantities (tons) by dividing the annual USD value by the average marketing year price for each state. A “higher-than-normal exports” year was identified as one in which export values were one standard deviation greater than the mean value. These years are as follows for the respective states: 2015–2017 for California; 2009 and 2012–2013 for Idaho; and 2004 and 2018 for New Mexico. Dummy variables for each state were created to represent these periods. These variables had a value of 1 for all months in the years with higher-than-normal export volumes and a 0 otherwise.
USDA-NASS production and stocks data were used to calculate stocks-to-use ratios for each state, the Western regionFootnote 4 , and the U.S. Specifically, the “stocks” portion of the stocks-to-use ratio is the stocks level for May. To calculate the “use” piece of the ratio, the December stocks levels for the previous year and estimated production for the current year were added, and then the current year December stocks value was subtracted off of that summed value.
Based on the hay market being primarily influenced by local rather than external factors in most states (Wolf, Reference Wolf2010), it was expected that the stock levels at the local or regional (Western region) level would be more informative for market conditions. Stocks-to-use levels associated with each geographic area were included in the analysis for each state to investigate this conjecture. Regarding the annual stocks-to-use ratios, if the observed value was one standard deviation below the mean, then it was considered a “low stocks-to-use” year. In the econometric models that are described next, dummy variables for each state, the Western region, and the U.S., were included to represent low stocks-to-use years. These variables had a value of 1 for all months in years with low stocks-to-use conditions, and 0 otherwise. The low stocks-to-use thresholds were as follows: California, 2%; Idaho, 6%; New Mexico, 5%; West, 8%; and the U.S., 13%.
Summary statistics for dairy industry expansion, hay exports, hay, and milk prices, and stocks-to-use ratios data for California, Idaho, and New Mexico for 2002–2019 are shown in Table 1. It is apparent that the growth rates regarding dairy cow inventories differed substantially between the early 2000s and the mid-2000s to 2019. Additionally, average hay exports from California are far greater and less variable than those in Idaho and New Mexico. Mean stocks-to-use ratios are lower and more variable in California than in Idaho and New Mexico. Average hay prices were higher and less variable in New Mexico than in California and Idaho. Milk prices were relatively less variable than hay prices for all analyzed states, and mean milk prices were more similar across these states than was the case for hay prices. The main takeaway from Table 1 is that there was substantial variation regarding hay market conditions across California, Idaho, and New Mexico, while milk market conditions were relatively similar.
The above-described variables were included in econometric models analyzing the hay-to-milk price relationship. These models are price transmission versions of time series cointegration models, for which the literature is vast and is discussed in detail by Baffes (Reference Baffes1991). The cointegration framework was chosen based on the observed close linkages between the dairy and hay markets, and because the prices of other feed crops (e.g., barley, corn, and wheat) are determined outside of regional markets in most cases. Thus, it is expected that in the presence of a substantial dairy industry expansion hay and milk prices move together over the long run. This does not mean that the milk price is the only factor that influences hay prices. Recent studies such as Cann (Reference Cann2014) and Li (Reference Li2016) that seek to explain variation in hay prices include many potential factors, including milk prices, other dairy feed prices, and exports. The goal of this empirical analysis is not to explain all variation in hay prices. Rather, it is to test whether the relationship between hay and milk prices is stronger after a rapid dairy industry expansion than it is before the expansion. Given these goals, the cointegration framework is most appropriate for this study, after having tested positive for non-stationarity of the series. Since the cointegration framework is well known in the literature, a detailed discussion of technical details and series stationarity test results are included only in the online supplementary appendix.
The initial estimated models include the hay price for each month, ${p_{H,t}}$
, as the dependent variable, and the monthly milk price,
${p_{H,t}}$
, as the dependent variable, and the monthly milk price, ${p_{M,t}}$
, as the independent variable. The resulting price level regression model representing the hay and milk price relationship for a given month, t, for each state of California, Idaho, and New Mexico has the following form:
${p_{M,t}}$
, as the independent variable. The resulting price level regression model representing the hay and milk price relationship for a given month, t, for each state of California, Idaho, and New Mexico has the following form:
 $${p_{H,t}} = \alpha + {\rm{\;}}\beta {p_{M,t}} + {u_t,}$$
where $\alpha $
is the intercept,
$\alpha $
is the intercept, $\beta $
is the long-run price responsiveness parameter, and
$\beta $
is the long-run price responsiveness parameter, and ${u_t}$
is a random error. Stationarity of the residuals obtained from the estimation of equation (1),
${u_t}$
is a random error. Stationarity of the residuals obtained from the estimation of equation (1), ${ {\hat u}_t}$
, imply that the prices are cointegrated (Phillips and Ouliaris, Reference Phillips and Ouliaris1990). Evidence of cointegration means that the variables move together over the long run. Another indicator of cointegration is the statistical significance of the error correction mechanism (ECM) parameter in a regression that includes the estimated lagged residuals from the estimation of equation (1),
${ {\hat u}_t}$
, imply that the prices are cointegrated (Phillips and Ouliaris, Reference Phillips and Ouliaris1990). Evidence of cointegration means that the variables move together over the long run. Another indicator of cointegration is the statistical significance of the error correction mechanism (ECM) parameter in a regression that includes the estimated lagged residuals from the estimation of equation (1), ${ {\hat u}_{t-1}}$
, and the first difference of the milk price on the right-hand side with the first differenced hay price as the dependent variable (Banerjee et al., Reference Banerjee, Dolado, Galbraith and Hendry1993). In the results, the Dickey–Fuller (DF) and Phillips–Perron (PP) tests of stationarity of residuals and statistical significance level of the ECM parameters are reported as evidence regarding cointegration.
${ {\hat u}_{t-1}}$
, and the first difference of the milk price on the right-hand side with the first differenced hay price as the dependent variable (Banerjee et al., Reference Banerjee, Dolado, Galbraith and Hendry1993). In the results, the Dickey–Fuller (DF) and Phillips–Perron (PP) tests of stationarity of residuals and statistical significance level of the ECM parameters are reported as evidence regarding cointegration.
The main objective of the empirical analysis is to test whether the degree to which the hay and milk prices move together changes with a rapid expansion of the dairy industry in the state. Specifically, it is hypothesized that the price responsiveness parameter ( $\beta $
) is greater in the post-dairy expansion period than before and may also be different during periods of higher-than-normal exports and low stocks-to-use ratios. To test whether there is evidence to support these hypotheses, the base-level models from equation (1) were adjusted to account for the factors that affect the characteristics of hay market demand. The adjusted models build upon the methods developed by Hatzenbuehler, Abbott, and Foster (Reference Hatzenbuehler, Abbott and Foster2016) based on the cointegration theory of Gregory and Hansen (Reference Gregory and Hansen1996). The resulting regression models for each state had the following form:
$\beta $
) is greater in the post-dairy expansion period than before and may also be different during periods of higher-than-normal exports and low stocks-to-use ratios. To test whether there is evidence to support these hypotheses, the base-level models from equation (1) were adjusted to account for the factors that affect the characteristics of hay market demand. The adjusted models build upon the methods developed by Hatzenbuehler, Abbott, and Foster (Reference Hatzenbuehler, Abbott and Foster2016) based on the cointegration theory of Gregory and Hansen (Reference Gregory and Hansen1996). The resulting regression models for each state had the following form:
 $${p_{H,t}} = {\alpha _0} + {\alpha _j}{I_{j,t}} + {\rm{\;}}{\beta _0}{p_{M,t}} + {\beta _j}\left( {{p_{M,t}}{\rm{*}}{I_{j,t}}} \right) + {\varepsilon _t,}$$
where the prices and parameters ${\alpha _0}$
and
${\alpha _0}$
and ${\beta _0}$
are interpreted like the analogous parameters in equation (1)
${\beta _0}$
are interpreted like the analogous parameters in equation (1) $;\;{I_{j,t}}$
is a generic dummy variable that represents periods of different hay market demand characteristics such that j represents either post-dairy expansion, higher-than-normal exports, or low stocks-to-use ratio periods. The parameters
$;\;{I_{j,t}}$
is a generic dummy variable that represents periods of different hay market demand characteristics such that j represents either post-dairy expansion, higher-than-normal exports, or low stocks-to-use ratio periods. The parameters ${\alpha _j}$
and
${\alpha _j}$
and ${\beta _j}$
are the intercept and price responsiveness parameters associated with such periods, respectively, and
${\beta _j}$
are the intercept and price responsiveness parameters associated with such periods, respectively, and ${\varepsilon _t}$
is a random error. The models were estimated considering (i) only one of the j hay market demand characteristic change factors, i.e. three models estimated and (ii) with all factors included in an expanded model.
${\varepsilon _t}$
is a random error. The models were estimated considering (i) only one of the j hay market demand characteristic change factors, i.e. three models estimated and (ii) with all factors included in an expanded model.
The expectation of greater milk-to-hay price transmission in the period post-dairy industry expansion than the period preceding it implies an estimated price responsiveness parameter that is greater than 0 ( ${ {\widehat \beta}_j > 0}$
). Regarding the periods of higher-than-normal exports and low stocks-to-use ratios, the expected sign of the estimated price responsiveness parameter associated with these periods is uncertain. This is because, depending on the amount of marketable hay and other substitute feed supply available, a milk price change may enhance or dampen hay price responsiveness.
${ {\widehat \beta}_j > 0}$
). Regarding the periods of higher-than-normal exports and low stocks-to-use ratios, the expected sign of the estimated price responsiveness parameter associated with these periods is uncertain. This is because, depending on the amount of marketable hay and other substitute feed supply available, a milk price change may enhance or dampen hay price responsiveness.
4. Results
The first step in the estimation of cointegration models is to determine whether the series is stationary. Stationarity test results for the series level and in first differences are provided in Table A2 in the online supplementary appendix. Results indicate that for both hay and milk prices, the hypothesis of non-stationarity cannot be rejected for the variable level, but is rejected when first differenced.
Estimation results for the base-level models from equation (1) are displayed in Table 2. It is observed that the responsiveness of the hay price to milk prices was stronger in California than in Idaho and New Mexico over the observation period as evidenced by the higher price responsiveness parameter of 10.49 relative to those of Idaho at 8.14 and New Mexico at 8.23. Moreover, the residuals for both the California and Idaho models indicate stationarity, while this is not the case for New Mexico. These results imply that, despite similarities regarding dairy industry expansion, there are substantial differences in the extent to which hay prices respond to milk price changes in the analyzed states.
Table 2. Estimation results for base-level models
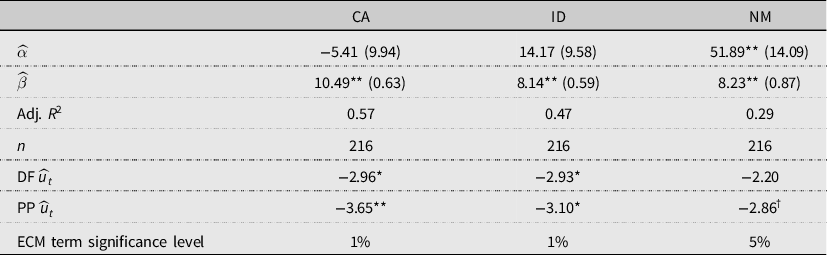
Notes: Critical values for the stationarity tests for the estimated level model residuals are in Fuller (Reference Fuller1996). ** and * denote statistical significance at the 1% and 5% levels, respectively. † denotes statistical significance at the 10% level.
The main results of this study are from the level models that account for the hay market tightening factors. These results are shown in Table 3. The results are presented such that each of the hypothesized hay market demand factors of dairy expansion, higher-than-normal hay exports, and low stocks-to-use conditions, respectively, are estimated separately (versions a, b, and c) and then all factors are included in one comprehensive model (version d). The issue regarding the appropriate regional scope of hay stocks-to-use ratios was investigated by estimating the models for each state with stocks-to-use variables that represent conditions at the state, regional, and the U.S. levels, respectively. These results are included in Table A3 in the online supplementary appendix. The results show that the models with the highest goodness-of-fit statistics were those that included stocks-to-use ratio variables associated with the Western region for California and Idaho, and the U.S. for New Mexico. The results from models that include these variables applied to each state are shown in Table 3.
Table 3. Estimation results for the level models that account for hay market tightening factors

Notes: The adjusted- ${R^2}$
values for the base-level models were for CA, 0.57; for ID, 0.47; for NM, 0.27 (Table 2). Critical values for the stationarity tests for the estimated level model residuals are in Fuller (Reference Fuller1996).**, *, denote statistical significance at the 1% and 5% levels, respectively.
${R^2}$
values for the base-level models were for CA, 0.57; for ID, 0.47; for NM, 0.27 (Table 2). Critical values for the stationarity tests for the estimated level model residuals are in Fuller (Reference Fuller1996).**, *, denote statistical significance at the 1% and 5% levels, respectively.
The results for the estimated models that account for the hay market demand characteristic change factors show that the adjusted ${R^2}$
values were higher than the base-level models that do not (Table 2). The increase in the adjusted
${R^2}$
values were higher than the base-level models that do not (Table 2). The increase in the adjusted ${R^2}$
values in comparison to the base models were largest for the New Mexico set. The main hypothesis was that hay-to-milk price responsiveness is higher in the post-expansion period than before. The results from model d, which account for all factors, show statistically significant evidence in support of this hypothesis for all analyzed states. For model d, the price responsiveness parameter representing the post-expansion was positive and statistically significant at the 1% level for Idaho and New Mexico and the 5% level for California. For these same models, the parameter associated with higher-than-normal hay export periods was negative and statistically significant at the 1% level for California, but not statistically significant for Idaho nor New Mexico. The negative sign associated with this parameter implies that California hay prices were less responsive to milk prices during periods of higher-than-normal hay exports than in other periods. For model d, the parameter representing hay price responsiveness during periods of low stocks-to-use ratios was statistically significant and negative for California and New Mexico. The analogous parameter in the Idaho model was also negative but not statistically significant. For the models that accounted separately for the change factors in hay market demand characteristics, the highest adjusted
${R^2}$
values in comparison to the base models were largest for the New Mexico set. The main hypothesis was that hay-to-milk price responsiveness is higher in the post-expansion period than before. The results from model d, which account for all factors, show statistically significant evidence in support of this hypothesis for all analyzed states. For model d, the price responsiveness parameter representing the post-expansion was positive and statistically significant at the 1% level for Idaho and New Mexico and the 5% level for California. For these same models, the parameter associated with higher-than-normal hay export periods was negative and statistically significant at the 1% level for California, but not statistically significant for Idaho nor New Mexico. The negative sign associated with this parameter implies that California hay prices were less responsive to milk prices during periods of higher-than-normal hay exports than in other periods. For model d, the parameter representing hay price responsiveness during periods of low stocks-to-use ratios was statistically significant and negative for California and New Mexico. The analogous parameter in the Idaho model was also negative but not statistically significant. For the models that accounted separately for the change factors in hay market demand characteristics, the highest adjusted ${R^2}$
values were those that accounted for low stocks-to-use conditions in California and post-dairy expansion in Idaho and New Mexico. These results imply that the hay-to-milk price responsiveness is greater in all states in the post-expansion period, but that the responsiveness can be disrupted during periods of higher-than-normal hay exports and low stocks-to-use conditions. The nonstatistical significance of the parameters associated with higher-than-normal hay exports and low stocks-to-use periods in model d for Idaho implies that these factor effects are not as critical as they are in California and New Mexico.
${R^2}$
values were those that accounted for low stocks-to-use conditions in California and post-dairy expansion in Idaho and New Mexico. These results imply that the hay-to-milk price responsiveness is greater in all states in the post-expansion period, but that the responsiveness can be disrupted during periods of higher-than-normal hay exports and low stocks-to-use conditions. The nonstatistical significance of the parameters associated with higher-than-normal hay exports and low stocks-to-use periods in model d for Idaho implies that these factor effects are not as critical as they are in California and New Mexico.
5. Conclusions
The objectives of this paper were to determine whether the responsiveness of hay-to-milk prices is greater in the period after a rapid expansion of a dairy industry in a state than it was before such an expansion, and whether other hay market demand characteristic factors (low hay stocks-to-use ratios and higher-than-normal hay exports) also change this responsiveness. This issue was investigated for the cases of California, Idaho, and New Mexico from 2002 to 2019. Each of these states had a rapid dairy industry expansion in the beginning part of this period. Cointegration models that accounted for the hypothesized hay market demand characteristics factors were estimated for these purposes.
There are several findings in this study. First, the substantial expansion of the dairy industry in California, Idaho, and New Mexico, which was especially rapid in the early 2000s, was found to coincide with greater hay-to-milk price responsiveness. Second, the hay-to-milk price responsiveness was lower in California during periods of higher-than-normal exports and low stocks-to-use ratios. Similar results were found for low stocks-to-use ratios for New Mexico, but not for exports. The effects of low stocks-to-use ratios and exports were not statistically significant for Idaho, although the estimated coefficients had the same sign as for California and New Mexico. Hay exports are substantially greater in California than in Idaho and New Mexico, and it appears that these relatively greater trade volumes may translate into larger price effects in the California hay market.
The implications of increased hay market tightness (i.e., lower (quantity) levels of marketable hay) on hay-to-milk price responsiveness were described in the background and theoretical discussion and can help explain the empirical results. Findings of greater price responsiveness due to demand factor changes under increased market tightness are supportive of those in Wright (Reference Wright2011) and Hatzenbuehler, Abbott, and Foster (Reference Hatzenbuehler, Abbott and Foster2016) for other crop(s) markets.
There are several policy implications of these findings for the DMC program and similar future programs designed to provide support to dairy producers based on changes in market conditions. First, the results imply that the likelihood that program payments, which are currently based on a ratio of national milk to feed (hay, corn, and soybean) prices, occur during periods of actual negative changes in dairy profitability in a region is dependent on the status of dairy industry expansion in that region. Since most of the rapid dairy expansion observed occurred during the early 2000s for the analyzed states, this appears as a more auspicious time to implement the DMC in its current form than it would have been while the rapid dairy expansion was still occurring. However, rapid dairy industry expansion conditions may still apply for Texas, so the correspondence between the national MF margin for DMC payments and changes in Texas dairy profitability may not be high if the rapid expansion there persists. Thus, alternative programs may be needed to support Texas dairies during the growth and stabilization period. Additionally, the general case of greater milk-to-hay price correspondence after a dairy expansion appears not to apply when low stocks-to-use ratios and/or higher-than-normal hay exports exist. Therefore, dairy farms in regions with generally high use of hay in feed rations and that commonly experience tight hay market conditions likely need risk management tools beyond the DMC to provide coverage for changes in external factors that change hay market demand characteristics.
Supplementary material
To view supplementary material for this article, please visit https://doi.org/10.1017/aae.2021.3.
Acknowledgments
We are grateful for the helpful feedback and comments provided by seminar participants at the 2019 Western Agricultural Economics Association annual meeting in Coeur d’Alene, Idaho, USA from June 30 to July 2, 2019.
Financial Support
This work was supported by the University of Idaho Agricultural Experiment Station with funding from the Hatch Act (Accession No. 1019181) through the USDA National Institute of Food and Agriculture.
Conflict of Interest
Patrick L. Hatzenbuehler, Hernan Tejeda, Steven Hines, and Joel Packham have no conflicts of interest to declare.
Data Availability Statement
The data used were obtained from publicly available sources and are available from the corresponding author, PLH, upon request.


 Open access