


1. Introduction
In this work, we assess the potential of deep neural networks (DNNs, see LeCun, Bengio & Hinton Reference LeCun, Bengio and Hinton2015) to perform non-intrusive sensing, that consists of using measurable quantities in a fluid flow to reconstruct its behaviour in another location in the domain or to predict its dynamics in the future, without using probes that affect the flow itself. For instance, it is possible to accurately measure time-resolved quantities at the wall, such as the wall-shear stress or the pressure, and then correlate these measurements with the flow farther away. A reliable flow estimation is typically a prerequisite for closed-loop control applications, where the actuation is applied with the aim of suppressing the effect of certain structures in the flow (Choi, Moin & Kim Reference Choi, Moin and Kim1994). In order to effectively perform closed-loop control it is necessary to monitor the instantaneous state of the flow so as to devise the best way to affect it, however, characterizing the flow state can be extremely challenging, particularly at very high Reynolds numbers where the near-wall structures become progressively smaller.
Before the appearance of DNNs, flow-field predictions were performed mainly through linear methods. Among them, the linear stochastic estimation (LSE) introduced by Adrian (Reference Adrian1988) stands out. Recently Suzuki & Hasegawa (Reference Suzuki and Hasegawa2017) and Encinar & Jiménez (Reference Encinar and Jiménez2019) have used LSE to reconstruct the velocity field on a wall-parallel plane in a turbulent channel flow employing wall measurements. The latter study showed that LSE can only reconstruct the large wall-attached eddies in the outer part of the logarithmic region. An extension of the LSE method in the spectral domain (Tinney et al. Reference Tinney, Coiffet, Delville, Hall, Jordan and Glauser2006) was shown to be more suitable for noisy predictions in turbulent flows. More recently, Baars & Tinney (Reference Baars and Tinney2014) proposed a method based on proper orthogonal decomposition (POD) to improve the spectral-LSE approach. Borée (Reference Borée2003) reported the possibility of projecting a synchronized field on the POD temporal modes of another quantity; this method is known as extended POD (EPOD). The correlation matrix between the temporal POD coefficients of two given quantities can be used to predict one based on the other. The work of Borée (Reference Borée2003) proved EPOD to be equivalent to LSE when all modes are retained in the reconstruction. Using remote probes, EPOD has been used to provide predictions in turbulent jets (Tinney, Ukeiley & Glauser Reference Tinney, Ukeiley and Glauser2008), channel flows (Discetti, Raiola & Ianiro Reference Discetti, Raiola and Ianiro2018), pipe flows (Discetti et al. Reference Discetti, Bellani, Örlü, Serpieri, Sanmiguel Vila, Raiola, Zheng, Mascotelli, Talamelli and Ianiro2019) and wall-mounted obstacles (Bourgeois, Noack & Martinuzzi Reference Bourgeois, Noack and Martinuzzi2013; Hosseini, Martinuzzi & Noack Reference Hosseini, Martinuzzi and Noack2016). Note, however, that, in the latter work, quadratic terms are included in the model of the POD coefficient dynamics, hinting at the need of nonlinear estimation even for a relatively simple, predominantly oscillatory flow. In this regard, Sasaki et al. (Reference Sasaki, Vinuesa, Cavalieri, Schlatter and Henningson2019) recently assessed the capabilities of both linear and nonlinear transfer functions with single and multiple inputs to provide turbulent-flow predictions. They documented a significant improvement in the predictions when the transfer functions were designed to account for nonlinear interactions between the inputs and the flow field. The improved prediction capabilities of nonlinear methods over linear ones were also reported by Mokhasi, Rempfer & Kandala (Reference Mokhasi, Rempfer and Kandala2009) and Nair & Goza (Reference Nair and Goza2020).
DNNs are nonlinear models that have found application in many research areas (Jean et al. Reference Jean, Burke, Xie, Davis, Lobell and Ermon2016; De Fauw et al. Reference De Fauw2018; Norouzzadeh et al. Reference Norouzzadeh, Nguyen, Kosmala, Swanson, Palmer, Packer and Clune2018; Ham, Kim & Luo Reference Ham, Kim and Luo2019; Udrescu & Tegmark Reference Udrescu and Tegmark2020; Vinuesa et al. Reference Vinuesa, Azizpour, Leite, Balaam, Dignum, Domisch, Felländer, Langhans, Tegmark and Fuso Nerini2020). Due to their potential applications in flow modelling, identification of turbulence features and flow control, DNNs have recently received extensive attention in the fluid-mechanics research community (Kutz Reference Kutz2017; Jiménez Reference Jiménez2018; Duraisamy, Iaccarino & Xiao Reference Duraisamy, Iaccarino and Xiao2019; Brunton, Noack & Koumoutsakos Reference Brunton, Noack and Koumoutsakos2020). Here, we provide a brief overview of the recent neural-network applications in fluid mechanics, before coming back to the flow estimation problem we investigated in this work. In the case of turbulence modelling, DNNs have been reported to improve the results of Reynolds-averaged Navier–Stokes (Ling, Kurzawski & Templeton Reference Ling, Kurzawski and Templeton2016; Wu, Xiao & Paterson Reference Wu, Xiao and Paterson2018) models and large-eddy simulations (Beck, Flad & Munz Reference Beck, Flad and Munz2019; Lapeyre et al. Reference Lapeyre, Misdariis, Cazard, Veynante and Poinsot2019; Maulik et al. Reference Maulik, San, Rasheed and Vedula2019). There are also a number of ongoing efforts towards including the constraints from the Navier–Stokes equations into prediction models through the so-called physics-informed neural networks (Wang, Wu & Xiao Reference Wang, Wu and Xiao2017; Raissi, Perdikaris & Karniadakis Reference Raissi, Perdikaris and Karniadakis2019). Furthermore, several artificial-intelligence-based solutions have been proposed to perform optimal control on different types of flows, such as the wake behind one or more cylinders (Rabault et al. Reference Rabault, Kuchta, Jensen, Réglade and Cerardi2019; Raibaudo et al. Reference Raibaudo, Zhong, Noack and Martinuzzi2020). Other promising applications of machine learning to fluid mechanics include generation of inflow conditions (Fukami et al. Reference Fukami, Nabae, Kawai and Fukagata2019b) and extraction of flow patterns (Raissi, Yazdani & Karniadakis Reference Raissi, Yazdani and Karniadakis2020).
DNNs have also been used in temporal prediction of dynamical systems. As an example, Srinivasan et al. (Reference Srinivasan, Guastoni, Azizpour, Schlatter and Vinuesa2019) compared the capabilities of the multi-layer perceptron (MLP, also known as a fully connected neural network) and several long–short-term memory (LSTM) networks to predict the coefficients of a low-order model for near-wall turbulence (Moehlis, Faisst & Eckhardt Reference Moehlis, Faisst and Eckhardt2004). While the most relevant flow features are captured by both architectures, the LSTM network outperformed the MLP in terms of ability to predict turbulence statistics and the dynamics of the flow. This work has been extended by Eivazi et al. (Reference Eivazi, Guastoni, Schlatter, Azizpour and Vinuesa2021), where the LSTM network has been compared with a Koopman-based framework which accounts for nonlinearities through external forcing. Although both approaches provide accurate predictions of the dynamical evolution of the system, the latter outperforms the LSTM in terms of time and data required for training. Similar temporal predictions of the near-wall model (Moehlis et al. Reference Moehlis, Faisst and Eckhardt2004) were conducted by Pandey, Schumacher & Sreenivasan (Reference Pandey, Schumacher and Sreenivasan2020) using echo state networks. Moreover, nonlinear autoregressive exogeneous networks have been used by Lozano-Durán, Bae & Encinar (Reference Lozano-Durán, Bae and Encinar2020) to exploit the relation between the temporal dynamics of the Fourier coefficients of a minimal turbulent channel flow. Their results showed accurate predictions of the bursting events in the logarithmic layer from buffer-region data. Other related work, in the context of control of the Kuramoto–Sivashinsky chaotic system, was recently conducted by Bucci et al. (Reference Bucci, Semeraro, Allauzen, Wisniewski, Cordier and Mathelin2019). Note, however, that the use of temporal sequences implies a high computational cost to generate well-resolved temporal data. Furthermore, longer sequences require higher memory requirements in order to predict the future behaviour. For these reasons, several neural-network-based models that learn spatial relations have been proposed in the literature. Convolutional neural networks (CNNs) have become increasingly popular during the last years due to the hierarchical structure of their input (Fukushima Reference Fukushima1980, Reference Fukushima1988; LeCun et al. Reference LeCun, Boser, Denker, Henderson, Howard, Hubbard and Jackel1989; Lecun et al. Reference Lecun, Bottou, Bengio and Haffner1998). For instance, Fukami, Fukagata & Taira (Reference Fukami, Fukagata and Taira2019a, Reference Fukami, Fukagata and Taira2021); Güemes et al. (Reference Güemes, Discetti, Ianiro, Sirmacek, Azizpour and Vinuesa2021) have shown that flow fields from the laminar wake of a cylinder and a turbulent channel can be reconstructed from extremely coarse data with remarkable success. CNNs have also been used to investigate the dynamical features of the flow without a priori knowledge, as shown by Jagodinski, Zhu & Verma (Reference Jagodinski, Zhu and Verma2020).
Neural networks are mathematical models which exhibit very appealing properties, such as being universal approximators (Hornik, Stinchcombe & White Reference Hornik, Stinchcombe and White1989). This means that they can potentially represent any continuous function with the adequate model parametrization, even though there is no guarantee that it is possible to infer the value of the parameters from data sampled from the original function. Nonetheless, neural-network parameters are typically tuned through data-driven training, and as such they have been compared and used together with other data-driven methods. For instance, the relationship between POD (see Lumley Reference Lumley1967) and the MLP is well documented in the literature (Bourlard & Kamp Reference Bourlard and Kamp1988; Baldi & Hornik Reference Baldi and Hornik1989). These works showed that a MLP with a single hidden layer is equivalent to POD if a linear activation function is used. One of the early applications on a fluid-dynamics dataset was proposed by Milano & Koumoutsakos (Reference Milano and Koumoutsakos2002), who compared the results of POD-based neural networks with linear and nonlinear functions for the prediction of near-wall velocity fields, showing that nonlinear POD has significantly better predictive capabilities. More recently, the emergence of autoencoder architectures has motivated a renewed interest in the application of neural networks for dimensionality reduction. Hinton & Salakhutdinov (Reference Hinton and Salakhutdinov2006) proposed the use of deep autoencoders to obtain a low-order representation of high-dimensional data, showing that this approach is able to retain more information than POD. It is interesting to note that this work avoids the inherent difficulty of optimizing weights in deep autoencoders by training each layer with a restricted Boltzmann machine. Murata, Fukami & Fukagata (Reference Murata, Fukami and Fukagata2020) used an autoencoder with convolutional layers to obtain a low-order representation of the flow around a cylinder. Their results suggest that CNN autoencoders with linear activation functions reproduce the same dimensionality reduction as POD, while the use of nonlinear activation functions improves the reconstruction performance. On a related note, flow reconstruction based on shallow neural networks was studied by Erichson et al. (Reference Erichson, Mathelin, Yao, Brunton, Mahoney and Kutz2020) in several fluid-mechanics examples.
This work is not the first in which neural networks are used to perform non-intrusive sensing in wall-bounded flows: in a seminal study over 20 years ago, Lee et al. (Reference Lee, Kim, Babcock and Goodman1997) tested a two-layer neural network (with a single nonlinear activation function) to predict the wall actuation, based on the wall-shear-stress components, in order to reduce the drag at the wall. Guzmán Iñigo, Sipp & Schmid (Reference Guzmán Iñigo, Sipp and Schmid2014) predicted the velocity field in a transitional boundary-layer flow using wall-shear measurements, by projecting the velocity fields on a POD basis and using a dynamic observer to predict the dynamics of the flow. More recently, Kim & Lee (Reference Kim and Lee2020) used the two wall-shear-stress components to predict the instantaneous wall-normal heat flux with satisfactory results. The same wall information was used by Guastoni et al. (Reference Guastoni, Encinar, Schlatter, Azizpour and Vinuesa2020) to predict the instantaneous streamwise flow fields at several wall-normal positions using convolutional networks. Their results show that these neural networks provide better predictions than linear methods (see below) in terms of instantaneous predictions and second-order statistics. The predictions were limited to one velocity component and to a low Reynolds number. In this work, all the velocity components are predicted and a higher  $Re$ is investigated as well. Furthermore, in the work by Güemes, Discetti & Ianiro (Reference Güemes, Discetti and Ianiro2019) the information of the most-energetic scales was encoded into a POD basis, and a CNN was used to predict that information at different wall-normal locations from streamwise wall-shear-stress measurements. Their results demonstrated that CNNs can significantly outperform linear methods in the prediction of POD time coefficients for low-order reconstruction of the velocity fields. Their convolutional network would predict only one POD temporal coefficient at a time, in this work all the coefficients are computed at the same time thanks to the implementation of an improved network architecture.
DNNs perform best when training and test data are taken from the same distribution, i.e. for the same flow and at the same Reynolds number in our case. However, in a real-world application the flow conditions will be continuously varying and/or it might be unfeasible to perform a full training at exactly the same conditions. If the flow behaviour at the Reynolds number of interest is roughly the same as the training Reynolds number and if the neural network can successfully approximate it, then the model should be able to perform consistently across the different Reynolds numbers, as shown in active flow control applications by Tang et al. (Reference Tang, Rabault, Kuhnle, Wang and Wang2020). In order to improve the performance at a different Reynolds number, it would then be possible to exploit initial training at a certain flow condition and transfer this knowledge to another one. Such knowledge transfer could reduce significantly the amount of data needed for training and improve the network applicability for industrial applications. Transfer learning (Pan & Yang Reference Pan and Yang2009) is the suitable learning framework to address this issue, and it is discussed in detail below.
The methods proposed by Guastoni et al. (Reference Guastoni, Encinar, Schlatter, Azizpour and Vinuesa2020) and Güemes et al. (Reference Güemes, Discetti and Ianiro2019), henceforth referred to as fully convolutional network (FCN) and FCN-POD respectively, are extended in the present study. Both models are able to provide a nonlinear characterization of the relation between wall features and the flow on wall-parallel planes. The purpose of this work is to provide a detailed comparison of the two aforementioned nonlinear methods regarding their capabilities in predicting turbulent flow fields from wall information. Their improvement over linear methods is measured using EPOD as a reference. Furthermore, transfer learning was applied to the FCN approach with the purpose of evaluating to what extent a network trained at one Reynolds number can be used at a different one.
The remainder of this article is organized as follows. Section 2.1 describes the numerical databases used for training and testing the neural networks and § 2.2 provides a brief comparison between the considered models. The FCN and FCN-POD methods are further detailed in § 2.4 and § 2.5, respectively, while EPOD is discussed in § 2.3. Results from the considered prediction methods are presented and compared in § 3, including instantaneous fields in § 3.1, second-order statistics in § 3.2 and spectra in § 3.3. Furthermore, an assessment of transfer learning between different Reynolds numbers is presented in § 4. Finally, the main conclusions of the work are presented in § 5. Two appendices are provided containing additional information about the training of the neural-network-based models and regarding the predicted instantaneous flow fields.
2. Methodology
2.1. Datasets
All the DNN variants in this study have been trained using the data generated from direct numerical simulations (DNS) of a turbulent open-channel flow. Periodic boundary conditions are imposed in the x- and z-directions (which are the streamwise and spanwise coordinates, respectively), and a no-slip condition is applied at the lower boundary ( $y=0$, where $y$ is the wall-normal coordinate). Differently from a standard channel-flow simulation, a symmetry condition is imposed at the upper boundary. In standard channel flows, the wall-attached coherent structures may extend beyond the channel centreline, thus affecting the other wall (Lozano-Durán, Flores & Jiménez Reference Lozano-Durán, Flores and Jiménez2012). On the other hand, in open-channel flows there is no upper wall. This makes the simulation more suitable to investigate to which extent the neural networks are able to learn the dynamics of near-wall turbulence, since the interaction of the large scales with both walls is not present.
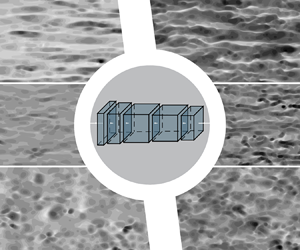
The simulation is performed using the pseudo-spectral code SIMSON (Chevalier et al. Reference Chevalier, Schlatter, Lundbladh and Henningson2007) with constant mass flow rate, in a domain  $\varOmega = L_x \times L_y \times L_z = 4{\rm \pi} h \times h \times 2{\rm \pi} h$ (where $h$ is the channel height), as shown in figure 1. Two friction Reynolds numbers $Re_{\tau }$ (based on $h$ and the friction velocity $u_{\tau }=\sqrt {\tau _w/\rho }$, where $\tau _w$ is the wall-shear stress and $\rho$ is the fluid density) are considered, as summarized in table 1. The flow field is represented with $N_y$ Chebyshev modes in the wall-normal direction and with $N_x$ and $N_z$ Fourier modes in the streamwise and spanwise directions, respectively. The instantaneous fields are obtained at constant time intervals from the time-advancing scheme, which is a second-order Crank–Nicholson scheme for the linear terms and a third-order Runge–Kutta method for the nonlinear terms. Dealiasing using a standard 3/2 rule is employed in the wall-parallel Fourier directions. The velocity fields to be used as ground truth for training and testing are sampled at the following inner-scaled wall-normal coordinates: $y^{+}=15,\,30,\,50$ and $100$. Note that ‘+’ denotes viscous scaling, i.e. in terms of the friction velocity $u_{\tau }$ or the viscous length $\ell ^{*}=\nu / u_{\tau }$ (where $\nu$ is the fluid kinematic viscosity). A dataset is defined as a collection of samples, each consisting of the shear-stress and pressure fields at the wall as inputs, along with the corresponding velocity fields at the target wall-normal locations as outputs. The training/validation dataset at $Re_{\tau } = 180$ consists of 50 400 instantaneous fields, with a sampling period of $\Delta t^+_{s} = 5.08$. The sampling period at $Re_{\tau } = 550$ is set to $\Delta t^+_{s} = 1.49$ and the training/validation dataset includes 19 920 fields. The resolution in viscous units of the individual fields is the same in both $Re_{\tau }$ datasets. This is necessary to represent all the flow features; however, this also implies that the number of Fourier modes in the wall-parallel directions is higher at $Re_{\tau }=550$, as shown in table 1, even if the domain $\varOmega$ is the same. A higher number of modes corresponds to a higher number of spatial locations in which the different quantities are sampled from the DNS and this partially compensate the lower number of fields since the two proposed neural-network-based methods act locally on the input data, as will be shown in § 2.2.

Figure 1. Computational domain and frame of reference for the DNS of the turbulent open channel considered in this study.
Table 1. Description of the DNS datasets used for computing the EPOD and training/testing the CNN-based models. The number of fields refers to the number of training and validation fields.

In both  $Re_{\tau }$ cases, the dataset is split into training and validation sets, with a ratio of $4\,{:}\,1$. The training and validation sets are obtained from a group of randomly initialized simulations. With the number of samples chosen for our investigation at either $Re_{\tau }$, there is a simulation whose samples are used both for training and for validation. Note that there is no temporal overlapping between the two datasets, as the first samples from the ‘shared’ simulation are sequentially added to the training set until the required number of training samples is reached. The remaining samples are then added to the validation set. This is done to reduce the correlation between the two datasets. While using the separate groups of simulations or adding an additional time separation between the last sample of the training set and the first sample of the validation would have further reduced the correlation, this was not enforced, since the validation error is only used during training to tune the network hyperparameters and avoid overfitting the training dataset. If the training provides satisfactory results, it is common practice to use both training and validation sets for the training of the final models. This was not implemented in our case, but it allows the model to make use of all the available data to improve its performance. The validation error may be significantly different from the one computed during testing, hence all the comparisons in this work are based on the error computed on the test dataset. The predictions used to assess the performance of the trained models were obtained from additional simulations. This is done both at $Re_{\tau } = 180$ and $Re_{\tau } = 550$, and it is necessary to ensure that the training and test datasets are completely uncorrelated, both in space and time. Test samples were taken from simulations initialized with a random seed, different from that of the training-data simulation. The correlation between training simulations and between training and test simulations was checked with the cross-correlations $\rho _{ij}(h)$, defined as (Makarashvili et al. Reference Makarashvili, Merzari, Obabko, Siegel and Fischer2017)
 \begin{equation} \rho_{ij}(h) = \frac{\gamma_{ij}(h)}{\sqrt{\gamma_{i}(0)\gamma_{j}(0)}}, \end{equation}
where  $h$ is the time lag and $\gamma _{ij}(h)=\mathbb {E}[(x_{i,t+h}-\mu _i)(x_{j,t}-\mu _j)]$ are the cross-covariances. $i$ and $j$ refer to the two simulations and $x$ is the considered quantity, in this case one of the velocity components at a given wall-normal location. By computing $\rho _{ij}(0)$, it was possible to verify that the simulations had run sufficiently long to ensure that they are overall statistically uncorrelated, before starting the sampling to build the datasets.
The size of the test dataset (more than 3000 fields for both  $Re_{\tau }$) is sufficient to achieve convergence of the turbulence statistics from the predicted flow, and then these are compared with the reference values from the DNS.
2.2. Summary of the methods
In this study we consider three different data-driven methods to estimate the instantaneous two-dimensional fields of the velocity fluctuations, at a given wall-normal distance. The velocity-fluctuation fields are obtained from the sampled DNS fields by subtracting the mean flow, averaged in time and in the two spatially homogeneous directions. Two models (FCN and FCN-POD) are introduced and compared with the EPOD method, which is used as a baseline model, highlighting the capabilities (and limitations) of linear estimation. Despite using the same input data and predicting the same output quantities, the three models leverage different tools in order to extract the information from the inputs and estimate the outputs. Here, we briefly review the differences and similarities between the models, each method is described in detail in the dedicated sections.
The three methods mainly differ when it comes to the use of POD (see Lumley Reference Lumley1967) on the input and output data, as well as the presence of a neural network in the prediction model. These differences are summarized in table 2, but it is important to note that the use of these mathematical tools can substantially differ from one method to the other, as detailed later. EPOD and FCN-POD use POD, which has the advantage of allowing us to filter out the noise content represented by small and uncorrelated scales, taking advantage of the energy optimality of POD modes. Additionally, spatial and temporal dynamics are separated.
Table 2. Summary of the properties from each method.

EPOD decomposes both the input and the output: the flow field at a certain wall-normal distance is reconstructed as a linear combination of orthogonal modes  $\boldsymbol {\phi }_i(\boldsymbol {x})$
 \begin{equation} \boldsymbol{u}(\boldsymbol{x},t) \approx \sum^{N_m}_{i=1}\psi_i(t)\sigma_i\boldsymbol{\phi}_i(\boldsymbol{x}), \end{equation}
where  $N_m$ is the total number of POD modes, $\psi _i(t)$ is the temporal POD coefficient corresponding to mode $i$ and $\sigma _i$ is its corresponding root-squared energy contribution. While the orthogonal modes are computed from a POD of the training dataset, the temporal coefficients are estimated by decomposing input wall quantities using POD and assuming a linear correlation between the known temporal modes of the wall quantities $\psi _{w,i}(t)$ and the temporal modes $\psi _i(t)$ of the output flow field of the test dataset. Further details are provided in § 2.3. On the other hand, FCN-POD applies POD only on the output flow fields, using the spatial modes from the training set and predicting the corresponding temporal coefficients using a neural network. This is a development of the model used by Güemes et al. (Reference Güemes, Discetti and Ianiro2019), note, however, that, in that study, the domain employed and reconstructed provided a compact POD eigenspectrum, here, the availability of a larger domain in the streamwise and spanwise directions spreads the energy content over a wider set of POD modes. This makes the predictions of temporal coefficients more difficult, especially those associated with the least energetic modes. To address this issue, the large instantaneous flow fields were subdivided into $N_{s_x}\times N_{s_z}$ smaller regions (henceforth referred to as subdomains). The neural network predicts the temporal coefficients for all subdomains at the same time.
The FCN and FCN-POD models consider the instantaneous two-dimensional fields of the streamwise and spanwise wall-shear-stress components and of the wall pressure as inputs. In the physical coordinates representation of these fields, the presence of coherent features motivates the use of convolutional layers in our neural-network models to process the information. In these layers, the inputs are processed at the same time, hence a convolution in three dimensions is performed and it is defined as
 \begin{equation} F_{i,j} = \sum_l \sum_m \sum_n I_{i-m,j-n,l}K_{m,n,l}, \end{equation}
following Goodfellow, Bengio & Courville (Reference Goodfellow, Bengio and Courville2016), where  $\boldsymbol {I} \in \mathbb {R}^{d_1 \times d_2 \times d_3}$ is the input, $\boldsymbol {K} \in \mathbb {R}^{k_1 \times k_2 \times k_3}$ is the so-called kernel (or filter) containing the learnable parameters of the layer and the transformed output $\boldsymbol {F}$ is the feature map. Note that we consider $d_3 = k_3$, meaning that the resulting feature map is two-dimensional. Multiple feature maps can be stacked and sequentially fed into another convolutional layer as input. This allows the next layer to combine the features individually identified in each feature map, enabling the prediction of larger and more complex features for progressively deeper convolutional networks. Note that a convolutional layer can be rewritten as a matrix multiplication, hence it is mathematically equivalent to a fully connected layer (Ma & Lu Reference Ma and Lu2017). If we assume that the input features are spatially localized, using a convolutional layer allows translational equivariance to be enforced in both periodic directions. Furthermore, since $k_i \ll d_i\ \forall i\neq 3$, the use of kernels greatly reduces the number of parameters that need to be learned during training (in comparison with fully connected MLP networks).
Both neural-network-based models use fully convolutional neural network (hence FCN in the names). This architecture is similar, but conceptually different from, CNNs, which typically have several convolutional layers followed by one or more fully connected layers (which are the building blocks of MLP networks). In CNNs, the localized information processed by the individual convolutional kernels is combined to obtain a global prediction, whereas in FCNs only convolutional layers are present and the network architecture is based on the assumption that the relation between input and output variables is spatially localized. The input region from which a single point of the output can draw information is called receptive field and it can be computed based on the network architecture, as described by Dumoulin & Visin (Reference Dumoulin and Visin2016). In the FCN model, the instantaneous two-dimensional velocity fluctuations are directly predicted from the input fields by using the fully convolutional neural network. Additional details are provided in § 2.4. On the other hand, the neural network in the FCN-POD model predicts the temporal coefficients for each of the  $N_{s_x}\times N_{s_z}$ subdomains at once, as described in § 2.5.
2.3. Extended POD
EPOD provides a linear relation between input and output and it is the reference method for all the following comparisons. Doing so, it is possible to assess the prediction improvement with nonlinear, neural-network-based methods in the context of wall-bounded turbulence. Wall quantities at each instant can be rearranged as a row vector and used to assemble a snapshot matrix
 \begin{equation} \boldsymbol{\mathsf{W}}=\begin{bmatrix} \left.\dfrac{\partial u}{\partial y}\right|_{x_1}^{t_1} & \cdots & \left.\dfrac{\partial u}{\partial y}\right|_{x_{N_p}}^{t_1} & \left.\dfrac{\partial w}{\partial y}\right|_{x_1}^{t_1} & \cdots & \left.\dfrac{\partial w}{\partial y}\right|_{x_{N_p}}^{t_1} & p_{x_1}^{t_1} & \cdots & p_{x_{N_p}}^{t_1}\\ \vdots & \ddots & \vdots & \vdots & \ddots & \vdots & \vdots & \ddots & \vdots \\ \left.\dfrac{\partial u}{\partial y}\right|_{x_1}^{t_{N_t}} & \cdots & \left.\dfrac{\partial u}{\partial y}\right|_{x_{N_p}}^{t_{N_t}} & \left.\dfrac{\partial w}{\partial y}\right|_{x_1}^{t_{N_t}} & \cdots & \left.\dfrac{\partial w}{\partial y}\right|_{x_{N_p}}^{t_{N_t}} & p_{x_1}^{t_{N_t}} & \cdots & p_{x_{N_p}}^{t_{N_t}} \end{bmatrix}. \end{equation}
Here,  $\, N_t$ refers to the total number of snapshots (equal to the number of instantaneous flow fields $N_f$ for the EPOD) and $N_p$ refers to the total number of grid points in one field. Such formulation applies for regular grids; for non-regular grids, the snapshot matrix should be adapted to take into account the area associated with each grid point. Using the method proposed by Sirovich (Reference Sirovich1987), it is possible to decompose this matrix into POD modes as
 \begin{equation} \boldsymbol{\mathsf{W}}=\boldsymbol{\varPsi}_w\boldsymbol{\varSigma}_w\boldsymbol{\varPhi}_w, \end{equation}
with  $\boldsymbol {\varPsi }_w \in \mathbb {R}^{N_f\times N_f}$ and $\boldsymbol {\varPhi }_w \in \mathbb {R}^{N_f\times 3N_p}$ being the temporal and spatial mode matrices, respectively, and $\boldsymbol {\varSigma }_w \in \mathbb {R}^{N_f\times N_f}$ being a diagonal matrix containing the singular values. Note that we perform an economy-size decomposition, such that the size of the square matrix $\boldsymbol {\varSigma }_{w}$ is $\min (N_f, 3N_p)$. The EPOD modes (Borée Reference Borée2003), corresponding to the projection of the wall quantities on the flow-field temporal basis, are defined as
 \begin{equation} \boldsymbol{\mathsf{L}}=\boldsymbol{\varPsi}_w^T\boldsymbol{\mathsf{U}}, \end{equation}
where  $\boldsymbol{\mathsf{U}}$ is the snapshot matrix in which the instantaneous velocity fluctuations in the three directions are rearranged
 \begin{equation} \boldsymbol{\mathsf{U}}=\begin{bmatrix} u_{x_1}^{t_1} & \cdots & u_{x_{N_p}}^{t_1} & v_{x_1}^{t_1} & \cdots & v_{x_{N_p}}^{t_1} & w_{x_1}^{t_1} & \cdots & w_{x_{N_p}}^{t_1}\\ \vdots & \ddots & \vdots & \vdots & \ddots & \vdots & \vdots & \ddots & \vdots \\ u_{x_1}^{t_{N_t}} & \cdots & u_{x_{N_p}}^{t_{N_t}} & v_{x_1}^{t_{N_t}} & \cdots & v_{x_{N_p}}^{t_{N_t}} & w_{x_1}^{t_{N_t}} & \cdots & w_{x_{N_p}}^{t_{N_t}} \end{bmatrix}. \end{equation}
 If the dataset is sufficiently large to reach statistical convergence, the matrix  $\boldsymbol{\mathsf{L}}$ describes the relationship between the temporal POD coefficients of a certain distribution of wall features, and those of the corresponding flow field. Once the temporal correlation matrix is known, an out-of-sample flow field $\boldsymbol {u}$ can be reconstructed using $\boldsymbol{\mathsf{L}}$ and the instantaneous realization of wall features as follows:
 \begin{equation} \boldsymbol{u}=\boldsymbol{\psi}_{w}\boldsymbol{\mathsf{L}}, \end{equation}
where  $\boldsymbol {\psi }_{w}$ is the vector containing the temporal coefficients of the wall fields used for prediction. Note that $\boldsymbol {\psi }_{w}$ is retrieved by projecting the out-of-sample wall field $\boldsymbol {w}$ on the POD basis: $\boldsymbol {\psi }_{w}=\boldsymbol {w}\boldsymbol {\varPhi }_{w}^T \boldsymbol {\varSigma }_{w}^{-1}$, where $\boldsymbol {\varPhi }_{w}^T \boldsymbol {\varSigma }_{w}^{-1}$ is readily available from the training dataset.
An important remark is that, due to the homogeneity in the streamwise and spanwise directions and the very large number of fields for the lower Reynolds number  $Re_{\tau } = 180$, the wall-based matrix $\boldsymbol {\varSigma }_{w}$ is ill conditioned. In fact, due to the correlation between subsequent time-resolved snapshots, the rank of $\boldsymbol {\varSigma }_{w}$ is smaller than $N_f$, which is the number of snapshots (here smaller than $N_p$). A well- or ill-conditioned matrix is based on the condition number: if the condition number is large the matrix is ill conditioned, while if it is small the matrix is well conditioned. Defining the condition number as $\kappa (\varSigma _w)={\max (\varSigma _w)}/{\min (\varSigma _w)}$, the large difference between the first and the last POD modes leads to an ill-conditioned matrix, which is difficult to be inverted numerically. To address this issue, a reduced-order representation of the matrix $\boldsymbol {\varSigma }_w$ is employed, using a number of modes equal to the rank of the matrix. The energy contribution of the excluded modes is zero, and thus the predictions are numerically equivalent to a full-rank estimation. Differently from the $Re_{\tau } = 180$ case, the singular values matrix at the wall $\boldsymbol {\varSigma }_{w}$ has a lower condition number for $Re_{\tau } = 550$ case, possibly because of the smaller number of snapshots that are used in this case. As a result, it is not necessary to resort to a reduce-order representation in order to invert the matrix $\boldsymbol {\varSigma }_{w}$. Even when $\boldsymbol {\varSigma }_w$ has rank equal to $N_f$, it might be convenient to truncate the matrix $\boldsymbol{\mathsf{L}}$ (Discetti et al. Reference Discetti, Raiola and Ianiro2018). Decomposing the flow quantities as $\boldsymbol{\mathsf{U}}=\boldsymbol {\varPsi }\boldsymbol {\varSigma }\boldsymbol {\varPhi }$, similarly to what is done for the wall quantities in (2.5), it can be observed that the product of the two matrices $\boldsymbol {\varPsi }\boldsymbol {\varPsi }_{w}^{T}$ in (2.6) returns a unitary-norm matrix with rank equal to those of $\boldsymbol {\varPsi }$ and $\boldsymbol {\varPsi }_{w}^{T}$, which are bases in the $\mathbb {R}^{N_f}$ vector space. As a consequence, a certain $j$th wall mode, uncorrelated with any field mode, would not result in a corresponding null row or column. To ensure the removal of the uncorrelated content from the matrix $\boldsymbol {\varPsi }\boldsymbol {\varPsi }_{w}^{T}$, Discetti et al. (Reference Discetti, Raiola and Ianiro2018) proposed to set to zero all the entries of the matrix with absolute values smaller than a threshold proportional to the matrix standard deviation. This operation reduces the expressivity of the EPOD, reducing the number of modes that can be used to represent the output fields. On the other hand, for the predictions in this work, we have found a mean-squared error reduction of approximately 10 percentage points with respect to the standard EPOD procedure. Despite this, since the EPOD is used as a benchmark for the performance of linear methods with respect to the FCN-based approaches proposed herein, the filtered EPOD by Discetti et al. (Reference Discetti, Raiola and Ianiro2018) is not included in this comparison for brevity.
2.4. Fully convolutional neural-network predictions
Fully convolutional networks are commonly used in applications where the input and output domains have structural similarities. Image segmentation (Long, Shelhamer & Darrell Reference Long, Shelhamer and Darrell2015) is one such case, since the output has the same spatial dimension as the input, as in our predictions of two-dimensional flow fields. The inputs of the network are the wall-shear-stress components in the streamwise and spanwise directions, as well as the pressure at the wall. Each of the inputs of the network is normalized using the respective mean and standard deviation, as computed from the training/validation set. The predictions are performed using the same mean and standard deviation values on the test dataset inputs. The outputs are the instantaneous velocity fluctuations, denoted as  $u$,
$u$,  $v$ and $w$ (corresponding to the streamwise, wall-normal and spanwise velocities, respectively), at a given distance from the wall. Note that the predictions are carried out at the same time as the input fields. In our previous work (Guastoni et al. Reference Guastoni, Encinar, Schlatter, Azizpour and Vinuesa2020), a similar FCN was used to predict the streamwise component of instantaneous flow fields. In the present study the predictions are extended to the wall-normal and spanwise components, however, the back-propagation algorithm that is used to train the networks works best when the error in the prediction of three outputs (i.e. the three velocity components) has a similar magnitude for all of them. Thus, the fluctuations are scaled as follows:
 \begin{equation} \hat{u} = u, \quad \hat{v} = v \frac{u_{rms}}{v_{rms}}, \quad \hat{w} = w \frac{u_{rms}}{w_{rms}}, \end{equation}
where  $rms$ refers to root-mean-squared (r.m.s.) quantities. During inference (i.e. when the predictions are computed from the inputs in the test dataset), the outputs of the network are re-scaled back to their original magnitude. The network is trained to minimize the following loss function:
 \begin{equation} \mathcal{L}_{{FCN}}(\boldsymbol{\hat{u}}_{FCN};\boldsymbol{\hat{u}}_{DNS})=\frac{1}{N_x N_z} \sum_{i=1}^{N_x} \sum_{j=1}^{N_z} \left | \boldsymbol{\hat{u}}_{FCN}(i,j) - \boldsymbol{\hat{u}}_{DNS}(i,j)\right |^{2}, \end{equation}
which is the mean-squared error (MSE) between the instantaneous prediction  $\boldsymbol {\hat {u}}_{FCN}$ and the true velocity fluctuations $\boldsymbol {\hat {u}}_{DNS}$, as computed by the DNS and scaled in the same way as the network outputs. Training details are further discussed in Appendix A. The FCN architecture is shown in figure 2. Each convolution operation (except for the last one) is followed by batch normalization (Ioffe & Szegedy Reference Ioffe and Szegedy2015) and a rectified-linear-unit (ReLU, see Nair & Hinton Reference Nair and Hinton2010) activation function.

Figure 2. Schematic representation of the considered FCN architecture. The input fields are on the left (from top to bottom: streamwise wall-shear stress, spanwise wall-shear stress and wall pressure) and the outputs are on the right (from top to bottom: streamwise, wall-normal and spanwise fluctuations). The numbers indicate the number of kernels applied to each of the layers. The kernels (not represented in the figure) have size  $(5\times 5)$ in the first convolutional layer, and $(3\times 3)$ in the subsequent layers. A darker colour corresponds to a higher value of the represented quantity.
The chosen inputs and outputs allow the FCN to learn only the spatial relation between the quantities at the wall and the fluctuations farther away from it. Note that it would also be possible to consider predictions in time, and in that case convolutional neural networks could be used (van den Oord et al. Reference van den Oord, Dieleman, Zen, Simonyan, Vinyals, Graves, Kalchbrenner, Senior and Kavukcuoglu2016) treating time as another spatial coordinate, or it would be possible to use recurrent networks, specifically designed to learn temporal sequences as we have recently shown with LSTM networks (Guastoni et al. Reference Guastoni, Srinivasan, Azizpour, Schlatter and Vinuesa2019; Srinivasan et al. Reference Srinivasan, Guastoni, Azizpour, Schlatter and Vinuesa2019). In both cases, the need for multiple samples in time makes the model less flexible than one that relies only on spatial correlations, both during training and testing. These models usually assume a constant sampling time for the data sequence, which might be difficult to enforce, for example if the fields are taken from a numerical simulation with an adaptive timestep. During inference, models that work with sequences would require input fields at different times to perform the prediction. On the other hand, a single input sample is sufficient for the FCN to predict the output.
Input and output fields of the FCN model are obtained from a simulation with periodic boundary conditions in the streamwise and spanwise directions. Such constraints could be added to the loss function, however, this would imply that periodicity would only be satisfied in a least-square sense and for this reason they are not used in the present study. Instead, in our implementation we are able to strictly enforce periodicity in both wall-parallel directions by leveraging the fact that the convolutional-network output is deterministic and influenced only by the local information in the receptive field. In other words, if the network receives a certain local input, the local output value will always be the same, regardless of the local position within the input field. In order to have the same values on both edges of the domain, the inputs fields are padded in the periodic directions, i.e. they are extended on both ends, using the values from the other side of the fields. The padding procedure is exemplified in figure 3, which highlights how the information in the receptive field at the two ends of the domain is indeed the same. The receptive field for this architecture is  $15 \times 15$ points, hence 16 points are added to each field in both streamwise and spanwise directions. Note that this padding would determine a network output size that is slightly larger than the size of the velocity fields from the DNS, and therefore the network output is cropped to match the size of the reference flow fields. The padding involves a computational overhead due to the increased size of the input fields, however, it is important to highlight that the padding is architecture dependent and not input dependent, meaning that the input is $\approx 17\,\%$ bigger with a $192 \times 192$ field resolution (at $Re_{\tau } = 180$), but only $\approx 6\,\%$ bigger when the fields have a size of $512 \times 512$ (at $Re_{\tau } = 550$).

Figure 3. Example of padding of the input streamwise wall-shear-stress field. The solid blue line indicates the size of the original field. The orange boxes show the information available to the FCN for the reconstruction of a single point of the output fields, at both edges of the domain. A darker colour corresponds to a higher value of the represented quantity.
2.5. POD-based predictions with convolutional neural networks
The FCN-POD model is built upon the previous work by Güemes et al. (Reference Güemes, Discetti and Ianiro2019). In the present work a different neural-network architecture, a fully convolutional one, is used instead of a CNN. The network takes as inputs the wall-shear-stress and wall-pressure fields as sampled from the DNS to predict the temporal coefficients of the POD modes in each of the  $N_{s_x}\times N_{s_z}$ subdomains in which the output velocity-fluctuation field is divided. The advantage of this approach compared with directly decomposing the full field lies in the fact that, in these subdomains, the first POD modes contain a very large fraction of the total energy content. This is a direct consequence of including the energy of the structures larger than the domain into the first POD mode (Liu, Adrian & Hanratty Reference Liu, Adrian and Hanratty2001; Wu Reference Wu2014). As a result, a lower number of modes is needed in each subdomain to reconstruct a large fraction of the total energy, as shown in figure 5(a,c). The same amount of energy would have been spread over a larger number of modes if the entire field had been considered at once. The number of subdomains in each homogeneous direction, as well as the other parameters of the POD for the two $Re_{\tau }$ cases are reported in table 3. Further details regarding the subdomain choice are provided at the end of this subsection.
Table 3. Description of the POD settings for the subdomain decomposition. Note that only the training set has been used to compute the POD modes.

Similarly to what was done for EPOD in § 2.3, the snapshot matrix  $\boldsymbol{\mathsf{U}}$ is assembled. The most important difference is that in this case the total number of snapshots $N_t$ is equal to the number of instantaneous flow fields $N_f$ times the number of subdomains per each flow field ( $N_{s_x}\times N_{s_z}\times N_f$), and $N_p$ refers to the total number of grid points in one subdomain. This organization of the snapshots implies that the spatial modes are assumed to be the same for each individual subdomain. These POD spatial modes can be computed solving the eigenvalue problem of the spatial correlation matrix $\boldsymbol{\mathsf{C}}$ as follows:
 \begin{equation} \boldsymbol{\mathsf{C}}=\boldsymbol{\mathsf{U}}^T\boldsymbol{\mathsf{U}}=\boldsymbol{\varPhi}^T\boldsymbol{\varLambda}\boldsymbol{\varPhi}, \end{equation}
where  $\boldsymbol {\varPhi }$ is a matrix the rows of which contain the spatial POD modes, while $\boldsymbol {\varLambda }$ is a diagonal matrix with elements $\lambda _i=\sigma _i^2$, which represent the variance content of each mode. The POD coefficients $\psi _i(t)$ are obtained by projecting the flow fields on the spatial POD modes computed with (2.11).
The economy-size decomposition just described returns a number of POD modes  $N_m=3N_p$. This implies that the flow field in each subdomain is represented with $N_m$ modes without approximation. On the other hand, the FCN-POD only predicts the POD temporal coefficients corresponding to a limited number of modes, so each turbulent-flow field is encoded using a tensor of size $N_{s_x}\times N_{s_z}\times N_r$, where $N_{r}< N_{m}$ is the number POD modes to be predicted on each subdomain, as illustrated in figure 4. This tensor contains a set of $N_r$ temporal POD coefficients for each subdomain in which the output flow field is divided. Even if the spatial modes are the same for all the subdomains, the temporal coefficient can have different values on the individual subregions, in order to provide a faithful local reconstruction of the flow. In this regard, it is important to note that the temporal coefficients for the subdomains are predicted together, and each subdomain is receiving information from the surrounding ones through the convolutional operations. This is a significant difference with the implementation in Güemes et al. (Reference Güemes, Discetti and Ianiro2019), where subdomains were not required, having considered a smaller flow field. Furthermore, in the previous cited work a different network is used to predict each mode, while in this study a single network is used to predict the full set of POD coefficients.

Figure 4. Schematic representation of the encoding of turbulent-flow fields into target tensors of the network, containing the temporal POD coefficients. When  $Re_\tau =180$, the flow field is divided into $12\times 12$ subdomains in the streamwise and spanwise directions respectively; a three-dimensional tensor is built, where the first two dimensions correspond to the streamwise and spanwise position of the subdomain, while the third one accounts for the number of POD modes to be predicted.
The FCN-POD architecture considered here blends the FCN shown in figure 2 and the network used by Güemes et al. (Reference Güemes, Discetti and Ianiro2019) (see figure 1 in that work). As in the FCN approach, each convolution operation (except for the last one) is followed by batch normalization (Ioffe & Szegedy Reference Ioffe and Szegedy2015) and a ReLU (Nair & Hinton Reference Nair and Hinton2010) activation function. After each activation function a max pooling layer is added. Differently from what was done in the FCN approach, here and in the EPOD approach the output velocity components were not scaled before the decomposition, in order to keep the physical encoding based on the turbulent kinetic energy (TKE) of the flow. Note that by modifying the relative contribution of the velocity components to the energy norm, the modes would have been sorted based on a norm different from the TKE. The network is trained to minimize the loss function
 \begin{equation} \mathcal{L}_{{FCN\text{-}POD}}(\psi_{POD};\psi_{DNS})=\frac{1}{N_{s_x} N_{s_z} N_r} \sum_{i=1}^{N_{s_x}} \sum_{j=1}^{N_{s_z}} \sum_{k=1}^{N_r} \left | \psi_{POD}(i,j,k) - \psi_{DNS}(i,j,k)\right |^{2}, \end{equation}
which is the MSE between the predicted and the actual POD temporal coefficients of the DNS data. Similarly to the FCN, the predictions are performed at the same instant as that of the input fields, hence the neural network does not require the knowledge of the input at previous timesteps. Parameter settings for training are detailed in Appendix A.
During inference, the velocity-fluctuation fields need to be reconstructed from the POD temporal coefficients. For each subdomain, the  $N_r$ predicted POD temporal coefficients are used to reconstruct the local fluctuation field within the subdomain. This is done with the orthonormal basis functions retrieved from the training data, even at test time. The underlying assumption is ergodicity, i.e. both the training and test datasets share the same statistical features and, consequently, the same spatial modes. This requires a sufficiently large training dataset to ensure convergence of the spatial modes, which is generally ascribed to the convergence of second-order statistics. Once the velocity-fluctuation fields are reconstructed within each subdomain, they are assembled together to provide the full-domain prediction. Note that the tiling of the subdomains does not provide any guarantee of smoothness across the edges of the subdomains because of the finite number of modes that are used to reconstruct the flow and because of the prediction error in the temporal coefficients.
As mentioned earlier, dividing the output velocity-fluctuation fields in subdomains allows us to represent the flow in these subregions with a compact orthogonal basis, as shown in figure 5(a,c). The energy distribution reported for the two  $Re_{\tau }$ cases is very similar, only the energy distribution at $y^+=15$ becomes slightly more compact for the low- $Re_{\tau }$ case. The size of the subdomains in the streamwise and spanwise directions is roughly $h\times 0.5h$ for the $Re_{\tau }=180$ case, and $0.4h\times 0.2h$ at $Re_{\tau }=550$. This is smaller than the domain considered in the previous work by Güemes et al. (Reference Güemes, Discetti and Ianiro2019), where the domain had size of $h\times h$. The choice of the size of the subdomains is the result of a compromise between network capability of reconstructing the majority of the energy content of the flow and compression of the information. In particular, it is important to reconstruct a significant portion of the total energy using a reduced number of modes. As shown in figure 5(b,d), the first 64 POD modes account for $90\,\%$ of the total energy at $Re_{\tau }=180$, while 128 modes are needed at $Re_{\tau }=550$ to retain a similar amount of energy. Therefore our predictions are truncated at $N_{r}=64$ and $128$ for $Re_{\tau }=180$ and $550$, respectively. As larger and larger subdomains are considered, an increasing number of modes would be needed to represent the same amount of energy. This would increase the number of coefficients that have to be predicted by the FCN and since the temporal coefficients of the less-energetic modes are difficult to correlate with the wall quantities used as input, the use of larger subdomains can effectively hinder the network learning process.

Figure 5. Distribution of (a,c) POD eigenvalues  $\lambda _{i}=\sigma _i^2$ (where $i$ denotes mode number) and (b,d) cumulative eigenspectra $\sum _{j=1}^{i}\lambda _j$ normalized with the cumulative sum of the eigenvalues $\sum _{j=1}^{N_m}\lambda _j$ of each case. The colour refers to the wall-normal locations described in § 2.1, where darker colours indicate larger distance from the wall. Note that (a,b) correspond to $Re_{\tau } = 180$, while (c,d) correspond to $Re_{\tau } = 550$. The solid black vertical lines in (b,d) refer to the number of modes selected for prediction in this study.
3. Results
The predictions of the trained models are compared with the data obtained from the DNS at  $Re_{\tau }=180$ and $550$. All the models use the same input data and predict the same output fields, in an effort to provide a fair comparison. Other metrics, such as the number of adjustable parameters, can be difficult to compare for different models. Furthermore, a higher number of parameters may not translate immediately to a better performance, as illustrated by Discetti et al. (Reference Discetti, Raiola and Ianiro2018) for the EPOD method. The performance assessment is carried out first from a qualitative point of view and subsequently from a quantitative perspective, based on predictions of instantaneous fields, turbulence statistics and spectra.
3.1. Instantaneous predictions
The predicted fluctuation fields are first qualitatively inspected. Note that the fluctuation flow fields are the direct output of the FCN models, while in the FCN-POD models the temporal coefficients need to be processed to reconstruct the fluctuations, as outlined above. In this work, the sampling period in the simulation is fixed, however, we showed in our previous work (Guastoni et al. Reference Guastoni, Encinar, Schlatter, Azizpour and Vinuesa2020) that using less correlated samples during training (i.e. larger sampling period, that corresponds to a longer sampled time for the same number of samples gathered) can effectively improve the quality of the instantaneous predictions of the FCN method, provided that the neural-network capacity is sufficient to generalize over the training dataset.
In figure 6, the predictions of an instantaneous field of streamwise velocity fluctuations based on the various methods (namely FCN, FCN-POD and EPOD) are compared with the reference DNS. The predictions of the wall-normal and spanwise fluctuations at the same instant are shown in Appendix B. At  $y^+=15$ all the methods provide accurate results, although the EPOD overestimates the fluctuations from the high-speed streaks. At $y^+=30$ such overestimation is reduced, although EPOD does not seem to reach a level of accuracy comparable to the other two models. The CNN-based methods start to exhibit some deviations with respect to the reference at $y^+=50$, where the FCN-POD field is smoother and the FCN is slightly noisier than the DNS. Farther from the wall, the footprint of the large scales at the wall (through linear superposition, see Dogan et al. Reference Dogan, Örlü, Gatti, Vinuesa and Schlatter2019) is less pronounced, and therefore the ability of EPOD (which is a linear method) to predict the flow in this region is significantly reduced. In fact, the fields predicted through EPOD at $y^{+}>15$ are qualitatively very similar to the DNS, although the fluctuations become increasingly attenuated at larger $y^{+}$. Furthermore, the FCN-POD method tends to merge neighbouring regions with high- or low-velocity fluctuations, predicting more elongated streak-like patterns than in the reference field. This is more evident at $y^+=100$, leading to an overestimation of the amplitude of the regions in the flow where the velocity fluctuations are higher. At this location, the FCN is not able to provide a reliable prediction of the flow field, capturing only the regions in which the magnitude of the fluctuations is higher. The corresponding structures probably have a distinct footprint at the wall, which allows the FCN to identify them.

Figure 6. Comparison of the streamwise fluctuation fields at  $Re_{\tau } = 180$, scaled with the corresponding $u_{rms}$, from EPOD (a–d), FCN-POD (e–h), reference DNS (i–l) and FCN (m–p). Results at $y^+=15$ (a,e,i,m), $y^+=30$ (b,f ,j,n), $y^+=50$ (c,g,k,o) and $y^+=100$ (d,h,l,p).
As discussed in § 2.5, the FCN-POD approach does not guarantee flow smoothness across the edges of the subdomains. Close inspection of the predictions from the FCN-POD method reveals the edges of the subdomains at all  $y^+$, and the tiling is more evident in the streamwise direction because of the discontinuities located at the same spanwise location, orthogonally to the main flow structures. Despite these limitations we can observe that the velocity fields are generally smooth, without steep discontinuities at the edges of the subdomains: the variations of the velocity magnitude at the edges are of the same order as the fluctuations at the corresponding wall-normal distance. These observations can be explained by the combination of two concurring elements. On one hand, the first POD modes of each subdomain contain the energy of all the structures that are larger than the individual subdomain. On the other hand, the temporal coefficients of the POD modes are predicted for all the subdomains at the same time. These two factors allow the FCN-POD network to predict the turbulent structures larger than a single subdomain, also providing smooth transitions at the edges of the subdomains.
The qualitative observations discussed above are complemented with a quantitative assessment of the instantaneous prediction performance, by analysing the MSE  $\mathcal {L}$ between the instantaneous predictions (denoted by ’Pred’) and the reference (defined for each of the fluctuations independently), as shown in figure 7. The error in the streamwise velocity fluctuations is defined as
 \begin{equation} \mathcal{L}(u_{{Pred}};u_{{DNS}})=\frac{1}{N_x N_z} \sum_{i=1}^{N_x} \sum_{j=1}^{N_z} \left | u_{{Pred}}(i,j) - u_{{DNS}}(i,j)\right |^{2}, \end{equation}
and similarly for the wall-normal and spanwise fluctuations. Note that the velocity-fluctuation fields need to be reconstructed from the temporal coefficients in POD-based models (FCN-POD and EPOD). Both neural-network models (FCN and FCN-POD) are trained using a stochastic algorithm and, in order to show the robustness of the optimal configuration, the statistics at each  $y^+$ are averaged over 3 different models, with different initial random weight initializations. Since the EPOD algorithm is completely deterministic, one single prediction is needed. The neural-network-based models consistently provide a lower error than the EPOD, with the FCN yielding a slightly better instantaneous performance closer to the wall than the FCN-POD approach. The gap between the two is reduced when moving away from the wall, where the prediction error of the streamwise fluctuations is approximately the same for both models at $y^+=50$, and it is slightly higher for the FCN at $y^+=100$.

Figure 7. Mean-squared error in the instantaneous fields (scaled with the corresponding r.m.s. components) predicted by the three models at  $Re_{\tau } = 180$, for the streamwise (a), wall-normal (b) and spanwise (c) velocity fluctuations.
The FCN architecture reported by Guastoni et al. (Reference Guastoni, Encinar, Schlatter, Azizpour and Vinuesa2020) would only predict the streamwise velocity component of the velocity field at the target  $y^+$. The addition of the two other components implies that the FCN has multiple outputs that need to be optimized at the same time. We note that adding the two additional fluctuating components as outputs leads to slightly less accurate predictions with respect to those reported by Guastoni et al. (Reference Guastoni, Encinar, Schlatter, Azizpour and Vinuesa2020) for one single output. This is not surprising, since the capacity of the network remained unchanged, however, we tested a variation of the model architecture based on this observation, in order to have more layers dedicated to the prediction of each individual component. This network variation has a common part, identical to the original FCN up to the fourth convolutional layer, in which the weights are optimized using the information from the error gradients computed for all the outputs. The last two convolution operations are replicated for each velocity component and the weights of these layers are updated only with the error associated with the respective output. Such a network, despite its higher capacity, provided worse predictions. A strong causal relation between the different components of the velocity (Lozano-Durán et al. Reference Lozano-Durán, Bae and Encinar2020) can be a possible explanation for this result, which shows that updating all the weights with information from the three components at the same time can be beneficial for the quality of the predictions. Note that it is not trivial to design an architecture able to provide the best trade-off between single-component predictions and usage of the information from all the components, and obtaining such an architecture would require further investigation. For the FCN-POD model the multiple-component predictions were obtained as discussed by Güemes et al. (Reference Güemes, Discetti and Ianiro2019). The temporal POD coefficients can be projected on spatial POD modes involving the three velocity components, thus requiring only one output to predict the three fluctuations. The network architecture is different than the one used by Güemes et al. (Reference Güemes, Discetti and Ianiro2019), since it predicts directly all the needed time coefficients for each snapshot. While the final fully connected layer included in the network architecture by Güemes et al. (Reference Güemes, Discetti and Ianiro2019) improves the robustness of the prediction, the FCN-POD implementation used here has a much smaller number of weights, thus significantly reducing the computational cost, and retains a larger number of POD modes (and thus more energy).
Predictions of the streamwise fluctuation fields from the various methods at  $Re_{\tau } = 550$ are shown in figure 8, while the results for the wall-normal and spanwise components are presented in Appendix B. Despite the higher friction Reynolds number, the FCN maintains a performance similar to the one achieved for $Re_{\tau }=180$, at all wall-normal locations. Note that the FCN has the same architecture as the lower-Reynolds-number case, i.e. it has the same number of trainable parameters, while in the case of the FCN-POD approach, the network was modified to reconstruct approximately the same amount of energy as at $Re_{\tau }=180$. Despite the higher number of employed subdomains, the tiling is more apparent at $Re_{\tau }=550$. The prediction performance of the FCN-POD model degrades less quickly than the FCN when moving away from the wall, however, the latter still performs better at $y^+=50$, as shown in figure 9. On the other hand, the EPOD also exhibits similar error levels as those reported for $Re_{\tau }=180$, except at $y^+=15$, where the reconstruction of the streamwise fluctuation field is significantly worse.

Figure 8. Comparison of the streamwise fluctuation fields at  $Re_{\tau } = 550$, scaled with the corresponding $u_{rms}$, from EPOD (a–d), FCN-POD (e–h), reference DNS (i–l) and FCN (m–p). Results at $y^+=15$ (a,e,i,m), $y^+=30$ (b,f ,j,n), $y^+=50$ (c,g,k,o) and $y^+=100$ (d,h,l,p).

Figure 9. Mean-squared error in the instantaneous fields (scaled with the corresponding r.m.s. components) predicted by the three models at  $Re_{\tau }=550$, for the streamwise (a), wall-normal (b) and spanwise (c) velocity fluctuations.
3.1.1. Inclination of coherent structures
The coherent structures in wall-bounded turbulence are inclined (Marusic & Heuer Reference Marusic and Heuer2007), with a slope that can be computed by finding the maximum spatial correlation  $\mathcal {R}_{ij}(\delta x)$ between the inputs at the wall (index $i$) and the outputs (index $j$), with $\delta x$ representing the distance in the streamwise direction at which the correlation is computed. By including a streamwise shift in the output fields, it is possible to obtain the maximum correlation at $\delta x=0$, ensuring that the footprint of the coherent structure is included in the receptive field of the output. The use of such a shift was also discussed by Sasaki et al. (Reference Sasaki, Vinuesa, Cavalieri, Schlatter and Henningson2019) in a similar context. By considering the maximum correlation between the wall-shear stress in the streamwise direction and the streamwise velocity at a certain $y^+$, we obtain an angle
 \begin{equation} \theta_{{shift}} = \tan^{{-}1}\left(\frac{\arg\,\max_{\delta x} R_{11}(\delta x)}{\delta y}\right) \approx 11^{{\circ}}, \end{equation}
at  $Re_{\tau }=180$, where $\delta y$ indicates the considered distance from the wall. The obtained value is slightly lower than previous observations (Marusic & Heuer Reference Marusic and Heuer2007; Sasaki et al. Reference Sasaki, Vinuesa, Cavalieri, Schlatter and Henningson2019), possibly because of the low Reynolds number. The inclusion of the shift information has been tested using two alternative implementations: first, by modifying the target output field, i.e. considering a field that has been sampled later in the simulation, although the accuracy of the introduced shift is limited by the value of the sampling period. The second approach makes use of the periodicity of the output fields, which are translated in the streamwise direction until the maximum correlation is obtained at $\delta x=0$. This approach allows us to more accurately introduce the shift, however, in this case the underlying hypothesis is that the shift is sufficiently small so that the temporal dynamics modifies the flow in a negligible manner. None of the two shift implementations provided the expected improvement, and we observed a significant degradation of the prediction performance. These results could possibly be explained by the fact that coherent structures of different size have different inclinations, and imposing a single value is detrimental for the overall network performance, despite having chosen the angle that provides the maximum spatial correlation. Furthermore, the quality of the predictions is measured using the MSE between the prediction and the reference: this error indicator considers all wavelengths at the same time, without considering how the different wavelengths are affected by the shift. Further investigation of this aspect, also at higher $Re_{\tau }$, will be conducted in future work.
3.2. Predictions of turbulence statistics
By averaging over the fields obtained from the neural-network models and EPOD, it is possible to evaluate the turbulence statistics of the predicted flow. First we consider the dataset at  $Re_{\tau }=180$: the predicted r.m.s. fluctuations of the three components are shown in figure 10, together with the reference DNS profiles. The error in these statistical quantities is defined as
 \begin{equation} E_{rms}^+(u) = \frac{\left| u_{rms,Pred}^+{-} u_{rms,DNS}^+ \right|}{u_{rms,DNS}^+}, \end{equation}
for the streamwise component, and similarly for the other two components. As above, the subscripts ‘DNS’ and ‘Pred’ refer to the reference and predicted profiles, respectively. An important premise is that neither of the neural-network-based models is explicitly optimized to reproduce the statistics of the original simulation. This prevents the neural networks from learning only the average behaviour of the flow, however, the predictions may be less statistically accurate, with the aim of maximizing the instantaneous performance. Note that here we favor instantaneous performance because our motivation is to use non-intrusive sensing for closed-loop flow control.

Figure 10. Comparison between the DNS (solid line) and the predictions of streamwise (a), wall-normal (b) and spanwise (c) velocity fluctuations at  $Re_{\tau } = 180$.
The prediction errors in the various r.m.s. profiles are summarized in table 4, and they are averaged over the different training runs for the FCN and FCN-POD models. Note that the average is performed over the fluctuation-intensity values and not on the predictions, because that would alter the statistical properties of the predicted flow fields. The comparison of the errors from the different models shows that the statistical performance mimics the one observed for the instantaneous predictions at  $y^+=15$ and $y^+=30$, with the FCN performing better than the FCN-POD and EPOD models. Furthermore, the FCN model provides a similar performance for the fluctuations of all three velocity components, while POD-based methods are more accurate in the predictions of $u_{rms}^+$. This is related to the choice of not scaling the different velocity components in the FCN-POD and EPOD approaches, and the fact that near the wall the most energetic dynamical structures of the flow are in the streamwise direction. Taking into account the standard deviation in the results of the neural-network-based methods, the three models provide similar error levels at $y^+=50$. At $y^+=100$ the scenario is opposite to what we observed close to the wall: the FCN exhibits the highest errors, while the EPOD provides the best results. The error in the prediction of $u_{rms}^+$ from the FCN-POD model is between those of the two other models, while the wall-normal and spanwise intensities are closer to the errors from the FCN, due the reasons outlined above.
Table 4. Percentage error in the prediction of the various r.m.s. fluctuations at the different wall-normal locations. Results at  $Re_{\tau } = 180$.

The statistical analysis is repeated also for the models trained at  $Re_{\tau } = 550$, with the predicted r.m.s. fluctuations shown in figure 11 and the relative error with respect to the reference simulation in table 5. FCN-based models do not show a significant variation in the prediction of the streamwise fluctuations with respect to the results at $Re_{\tau }=180$, whereas the EPOD exhibits higher errors at this Reynolds number (also in the other two fluctuating components). The FCN has a consistent behaviour also for the fluctuations in the y- and z-directions, however, the FCN-POD performs slightly worse than before, following the same trend but with higher error levels. The FCN-POD method outperforms the FCN approach only at $y^+=100$, confirming the results of the instantaneous performance at $Re_{\tau } = 550$.

Figure 11. Comparison between the DNS (solid line) and the predictions of streamwise (a), wall-normal (b) and spanwise (c) velocity fluctuations at  $Re_{\tau } = 550$.
Table 5. Percentage error in the prediction of the various r.m.s. fluctuations at the different wall-normal locations. Results at  $Re_{\tau }=550$.

3.3. Predictions of power-spectral density
The energetic scales present in the predicted fields, as well as their associated energy, are compared with those in the reference DNS data through spectral analysis. In figure 12 we show the pre-multiplied two-dimensional power-spectral density of the streamwise, wall-normal and spanwise fluctuations (denoted by  $\phi _{uu}$, $\phi _{vv}$ and $\phi _{ww}$, respectively) at $Re_{\tau }=180$, where $\lambda _{x}$ and $\lambda _{z}$ denote the streamwise and spanwise wavelengths, whereas $k_{x}$ and $k_{z}$ are the corresponding wavenumbers. These results confirm the observations made in § 3.1: at $y^+=15$, all the considered models are able to correctly predict the energy content of the flow at all wavelengths, with the FCN slightly outperforming the two POD-based approaches. Note that the FCN-POD model is able to reconstruct the energy content of the flow at wavelengths that are longer than the size of the subdomains, proving that this is not a limiting factor for the model. However, a small jump, probably due to a lack of smoothness at the edges of the subdomains, can be observed in the streamwise wavelength for the 10 %-energy level in the wall-normal and spanwise components. These jumps are found at a wavelength $\lambda _x^+ \approx 180$, corresponding to the subdomain size. At $y^+=30$ there is a slight energy attenuation which becomes increasingly more noticeable when the predicted flow is farther away from the wall. At $y^+=100$ the POD-based methods perform better than the FCN model, a fact that can be explained by considering two concurring aspects: the first is that POD methods only predict the temporal dynamics of the system, thus the overall energy-scale distribution stored in the POD spatial modes does not need to be predicted. This allows reconstruction of more than $50\,\%$ of the flow fields, at least in the streamwise component. The second aspect is the fact that the receptive field from the FCN method, while sufficient for planes closer to the wall, is not large enough to reproduce the large scales present at larger $y^{+}$.

Figure 12. Pre-multiplied two-dimensional power-spectral densities for  $Re_{\tau }=180$. The contour levels contain 10 %, 50 % and 90 % of the maximum DNS power-spectral density. Shaded contours refer to the reference data, while contour lines refer to (orange dashed dotted line) FCN, (blue dashed line) FCN-POD and (green dotted line) EPOD predictions, respectively.
Figure 13 reports the reference and predicted power-spectral densities at  $Re_{\tau }=550$. As opposed to what was observed for the instantaneous predictions and the turbulence statistics, the spectra highlight the differences and similarities between the models used for the two Reynolds numbers. As noted above, the FCN architecture is the same for both $Re_{\tau }$, however, this implies that the receptive field is smaller at higher Reynolds number when it is measured in outer units. This can potentially help in the prediction of the small scales, but it can also be detrimental for the larger scales. Note that the different size of the receptive field does not seem to affect the predicted energy content of the FCN, which shows the same trends as for the low- $Re_{\tau }$ case. On the other hand, the spectra of the FCN-POD with $12\times 12$ subdomains (the same amount as in the low- $Re_{\tau }$ case, not shown) exhibit spurious periodic peaks due to the tiling. This observation motivated the increased number of subdomains considered at $Re_{\tau }=550$. As in the low- $Re_{\tau }$ case, the FCN-POD approach is able to reconstruct the scales larger than the subdomain size, but the contour line exhibits a small jump in the streamwise wavelength for the 10 %-energy level. This jump appears at a wavelength $\lambda _x^+ \approx 200$, corresponding to the subdomain size employed in the high- $Re_{\tau }$ case. This jump is also appreciated in the streamwise component at $y^+=15$. The POD-based approaches are outperformed by the FCN in the range of $y^+=15\text {--}50$. Farther from the wall, the accuracy of the FCN is matched by the FCN-POD method. It is interesting to note that the EPOD does not follow the same attenuation process as the FCN-based methods in the wall-normal and spanwise components. As one moves farther from the wall, the FCN-based methods fail to reproduce a wider range of small scales, whereas the EPOD exhibits more difficulties predicting the large scales. When it comes to the spectral peaks far from the wall, while the FCN-based methods produce noisier predictions than in the low- $Re_{\tau }$ case, the EPOD is not able to reproduce that part of the spectra. Taking inspiration from the FCN-POD approach, it might be possible to improve the EPOD performance by considering a local estimation on the subdomains, blended with a global estimation on the entire flow field. However, the way these two estimations should be combined is not trivial and this approach is left for future studies.

Figure 13. Pre-multiplied two-dimensional power-spectral densities for  $Re_{\tau }=550$. The contour levels contain 10 %, 50 % and 90 % of the maximum DNS power-spectral density. Shaded contours refer to the reference data, while contour lines refer to (orange dashed dotted line) FCN, (blue dashed line) FCN-POD and (green dotted line) EPOD predictions, respectively.
4. Transfer learning
A number of more advanced techniques have also started to be adopted from the specialized machine-learning literature and applied to fluid-dynamics research. One notable example is transfer learning (Pan & Yang Reference Pan and Yang2009), a method that allows the transfer of knowledge from one neural-network model to another one, thus reducing the amount data and time required for training. Guastoni et al. (Reference Guastoni, Encinar, Schlatter, Azizpour and Vinuesa2020) showed that the training time at a given wall-normal location may be significantly reduced if the network parameters are initialized using the optimized parameters of a previously trained network at another wall-normal location. Similarly, Kim & Lee (Reference Kim and Lee2020) used the convolutional network trained at a low Reynolds number to predict the flow at a higher Reynolds number.
Transfer learning represents an appealing solution for the main drawback of neural networks, which is the need to train them with a sufficient amount of data. Training typically requires specialized hardware and in our specific application the computational cost of generating the training and test datasets is not negligible. Furthermore, this cost grows as  $Re_{\tau }$ increases, making the generation of training data through DNS unfeasible at the Reynolds numbers that are relevant for engineering applications. In this regard, it is important to make an efficient use of the data and the trained models at our disposal. In this work, the possibility of transferring knowledge between models trained at different friction Reynolds numbers is investigated. At a fixed wall-normal distance, the weights of the FCN model trained on the dataset at $Re_{\tau } = 180$ are loaded before training the network with the higher- $Re_{\tau }$ dataset. This is possible because the network has the same number of trainable parameters in both cases, as noted above. The learning rate is the only parameter that needs to be modified: a lower value has to be set, in order to prevent the optimizer from diverging too quickly from the weight configuration used for initialization. While in Guastoni et al. (Reference Guastoni, Encinar, Schlatter, Azizpour and Vinuesa2020) we froze the first layers of the initialized network because the input was the same at the different wall-normal locations, in this case all the layers are trainable because the input distribution changes from one $Re_{\tau }$ to the other one.
The transfer-learning numerical experiments that follow are designed with two objectives in mind. First, we investigate the effect of using the parameters of previously trained model to initialize a model that will be trained at a different target  $Re_{\tau }$ than the first model. Second, we verify whether the non-random initialization that we described can potentially improve the training process, reducing the amount of data at higher $Re_{\tau }$ that is needed to achieve the same performance of a model trained from scratch, using the entire training/validation dataset, as we did in § 3. To this end, we initialized a FCN model with the parameters learnt on the $Re_{\tau }=180$ dataset and we trained such model on the full training/validation datasets at $Re_{\tau }=550$. Subsequently, the same initialization is used for models that are trained on a reduced dataset at $Re_{\tau }=550$, namely 25 % and 50 % of the full dataset. Differently from the previous sections, only one training run was performed for each case. In order to compare models trained with datasets of different sizes, we considered the number of weight updates through the optimization algorithm during training. In figure 14 the validation and test losses are compared for the models trained with the full dataset and a random initialization. When the initialized model is trained on the full dataset, the performance is consistently better than that of the random initialization, both in terms of validation and test loss. The improvement is more evident close to the wall, whereas at $y^+=100$ the two models provide approximately the same results after the first 150 000 updates. Transferring knowledge between different Reynolds numbers is then not only feasible, but also advantageous in terms of performance when the same amount of data is considered. Note that we kept the same ratio ( $4\,{:}\,1$) when dividing training and validation sets even when the size of the dataset was reduced. In particular, when 50 % or 25 % of the samples are used, the validation set becomes too small to provide a reliable estimate of the error. On the other hand, the size of the test dataset is the same as the previous experiments. Up to $y^+=50$, the initialized networks are able to provide a performance that is very similar to that of the reference model with the same number of updates, with significant savings in terms of amount of data needed to train the network. On the other hand, at $y^+=100$ a sufficient number of samples becomes a necessary condition to ensure the convergence to an optimal configuration: the loss of the network trained with 50 % of the training dataset does not improve after the first 100 000 updates, while with 25 % of the original dataset the network exhibits overfitting. The initialized models are able to provide a comparable accuracy also from the statistical point of view, as reported in table 6. We stress once again that the networks are not explicitly optimized to reduce the error in the statistics and that small variations in these error figures can be ascribed to the stochastic nature of the optimization algorithm. Overall, these results demonstrate the feasibility of knowledge transfer from models at different $Re_{\tau }$: with careful tuning of the hyperparameters it should be possible to substantially reduce the training time, as well as the amount of data needed for training. Although not tested, the transfer between different wall-normal locations described in Guastoni et al. (Reference Guastoni, Encinar, Schlatter, Azizpour and Vinuesa2020) is still applicable in this case, thus enabling a more efficient prediction of the flow at different wall-normal locations.
Table 6. Percentage error in the prediction of the various r.m.s. fluctuations at the different wall-normal locations from models initialized with parameters from the  $Re_{\tau }=180$ FCN. The statistics of the different initialized models are computed after 250 000 updates, and they are shown together the models with full dataset and random initialization, which is included as a reference. Results at $Re_{\tau }=550$.


Figure 14. Validation (solid line) and test (dashed line) loss in the FCN prediction at (from left to right, top to bottom):  $y^+=15$, 30, 50 and 100. Orange represents the models trained with the full dataset and random initialization, grey the models trained with the full dataset and initialized with previously trained networks, pink and brown represent models initialized with the parameters from the $Re_{\tau }=180$ network, trained with 50 % and 25 % of the original dataset, respectively.
5. Conclusions
In this work, we introduced and compared two different models based on fully convolutional neural networks, for prediction of the velocity fluctuations at a given wall-normal distance, using quantities measured at the wall as inputs. The FCN and FCN-POD models are improved versions of previous architectures, used by Guastoni et al. (Reference Guastoni, Encinar, Schlatter, Azizpour and Vinuesa2020) and Güemes et al. (Reference Güemes, Discetti and Ianiro2019), respectively. Both of them are able to provide predictions in very good agreement with the reference data, simulated by means of the pseudo-spectral DNS code SIMSON (Chevalier et al. Reference Chevalier, Schlatter, Lundbladh and Henningson2007), up to  $y^{+}=50$. Such an agreement is verified by comparing the error in instantaneous predictions, turbulence statistics (namely r.m.s. fluctuations) and the energy content at the different wavelengths (i.e. spectral analysis). Both models show better prediction capabilities than EPOD (which is a linear method) in almost all the wall-normal locations and investigated features, thanks to their ability to predict nonlinear scale interactions. Furthermore, we showed that these architectures can be used at two different friction Reynolds numbers ( $Re_{\tau }=180$ and 550) with minimal modifications, providing satisfactory results on both datasets.
The two models are designed under the assumption that local information at the wall is sufficient to predict the flow farther away, however, the FCN-POD model partially encodes further physical information of the system by using the spatial modes obtained through POD of the training dataset. On the other hand, features like the periodicity of the flow are enforced in the FCN by exploiting the mathematical characteristics of the model. These architectural differences are associated with performance discrepancies at the tested wall-normal locations; the FCN provides higher accuracy than the FCN-POD model closer to the wall, i.e. up to  $y^+=30$ at $Re_{\tau } = 180$ and up to $y^+=50$ at $Re_{\tau } = 550$. Farther from the wall, the FCN-POD method produces the most accurate predictions. The choice between these two models is motivated by the application into which the prediction model is integrated.
Despite the encouraging results discussed here, both models can be improved in terms of network architecture and training. An attempt to embed further physical information into the FCN did not result in improved predictions, as reported in § 3.1.1. The correct way of incorporating this information to enhance the predictions is an active area of research. As another example, the high-frequency noise in the FCN predictions could be reduced with appropriate filtering, possibly adding a trainable layer to the network to perform this operation. The FCN-POD model has a higher number of hyperparameters to be set, such as the number of predicted temporal modes or the size of the subdomains. A more thorough inspection of the hyperparameter space may provide a significant improvement in the prediction performance. Differently from the FCN, in the FCN-POD model the velocity components are not scaled to have the same magnitude: such a modification could help to predict the wall-normal and spanwise components of the velocity more accurately, even though it would also modify the POD mode sorting because of the different energy norm. Furthermore, the FCN-POD results exhibit lack of smoothness at the subdomain edges in the flow predictions. Finally, both models are trained to minimize a loss function based on the instantaneous error. Such a function could be modified to improve other physical characteristics of the predicted flow, for example the turbulence statistics and the spectral energy content.
To reduce the training time in view of industrial applications, the implementation of transfer learning was tested for the FCN model. Transfer learning can exploit a network trained at a lower Reynolds number to provide the weight initialization for training at a higher Reynolds number, thus reducing the requirements in terms of training time and data. The results are very encouraging, showing that it is possible to train the network with 50 % and even 25 % of the original training dataset, obtaining a performance similar to that of the reference model up to  $y^{+}=50$.
Once the neural networks are trained, they are computationally cheap to evaluate, and they can become even cheaper by pruning the parts that have a negligible contribution to the final result off the network. Such an operation is not possible a priori, since the training determines how the inputs have to be processed to obtain the output. By reducing the computational cost of the evaluation it is possible to deploy the model using low-powered hardware and/or potentially run it in real time. Thus, the proposed FCN-based methods could be used for non-intrusive sensing of the flow, which is needed for closed-loop control applications. Furthermore, since the FCN models are able to reproduce nonlinear interactions in wall-bounded turbulence, new promising avenues in turbulence research could be opened by the network interpretation (Fan et al. Reference Fan, Xiong, Li and Wang2021), as shown by Iten et al. (Reference Iten, Metger, Wilming, Del Rio and Renner2020), who demonstrated that neural networks can provide relevant physical insights.
Funding
The authors acknowledge the funding provided by the Swedish e-Science Research Centre (SeRC), the G. Gustafsson Foundation and the Knut and Alice Wallenberg (KAW) Foundation. The numerical simulations were carried out on resources provided by the Swedish National Infrastructure for Computing (SNIC) at PDC and HPC2N. Part of this study was conducted in the context of the 4th Madrid Turbulence Workshop, in the context of the COTURB project (Coherent Structures in Wall-bounded Turbulence), funded by the European Research Council (ERC), under grant ERC-2014.AdG-669505. S.D. and A.I were partially supported by the project ARTURO, ref. PID2019-109717RB-I00/AEI/10.13039/501100011033, funded by the Spanish State Research Agency.
Declaration of interests
The authors report no conflict of interest.
Data availability statement
The codes used to obtain the findings of this study are openly available on GitHub (https://github.com/KTH-FlowAI/FCN-turbulence-predictions-from-wall-quantities).
Appendix A
This appendix contains the training details of the neural-network models in the FCN and FCN-POD method. Both models introduced in § 2 need to be tuned to perform optimally on the chosen dataset. The networks were trained using the Adam (Kingma & Ba Reference Kingma and Ba2015) optimization algorithm for 50 epochs, with a scheduled exponential learning-rate decay. We used the optimizer hyperparameters suggested in the original paper, except the  $\hat {\epsilon }$ parameter that was set to 0.1 following TensorFlow recommendations (Abadi et al. Reference Abadi2016). The total number of trainable parameters in the FCN is 1 264 131 and it does not depend on the $Re_{\tau }$ of the dataset. On the other hand, this number is $Re_{\tau }$-dependent for the FCN-POD model, as the number of subdomains and reconstructed POD modes changes. For the $Re_{\tau }=180$ case the number of trainable parameters is 4 733 248, while for the $Re_{\tau }=550$ case it is 5 028 224.
For the FCN model the  $Re_{\tau }=180$ dataset, composed by input and output fields, has a size of about 70 GB per wall-normal distance, while the $Re_{\tau }=550$ dataset occupies 120 GB. Depending on the amount of available RAM it might not be possible to load the entire dataset in memory, however, our implementation does not require to load it at once, allowing training on less-performing computer as well. The training was performed on two different GPUs, namely NVIDIA K80 and NVIDIA RTX2080Ti. The former has 24 GB of GPU memory, whereas the latter only 12 GB. The turbulent field snapshots have a comparatively high resolution with respect to the samples used in image processing and the GPU memory can also be a limiting parameter. For a given dataset, the amount of memory that is allocated on the GPU depend on the batch size, that is the number of samples used to estimate the loss function gradient at each update of the learnable parameters of the network. In the $Re_{\tau }=550$, the batch size is limited to 2 samples when the faster RTX2080Ti is used. With this setting the gradient approximation might be too noisy and the training performance might be degraded, therefore we suggest using at least a batch size of 4, using two RTX2080Ti GPUs.
Due to the reduced-order nature of FCN-POD method, the size of the training/validation datasets is lower: 40 GB for  $Re_{\tau }=180$ dataset and 70 GB for $Re_{\tau }=550$ dataset. Thanks to the max pooling operations that are not present in the FCN model, the size of the tensors allocated on GPU is smaller and this allows training of the model with a batch size of 8 for both datasets.
Appendix B
This appendix contains the wall-normal and spanwise fluctuations corresponding to the fields shown in figures 6 and 8 for  $Re_{\tau }=180$ and 550, respectively. If we observe the wall-normal fluctuations at $Re_{\tau }=180$ in figure 15, the FCN model provides better predictions than POD-based methods at $y^+=15$. The tiling of the subdomains is more apparent in the FCN-POD predictions, while the EPOD predictions contain small features that are not present in the DNS reference field. Similar observations can be made at $y^+=30$. As we move farther away from the wall, at $y^+=50$, the accuracy of the neural-network-based models is similar. For the FCN-POD the flow features in the streamwise direction appear smoothed out with respect to the DNS fields; on the other hand, the same features have more jagged edges in the FCN predictions, possibly as a consequence of the localized nature of the predictions. As observed for the streamwise velocity fluctuations, the performance degrades as we move farther away from the wall. Note that some features are completely missing in the EPOD predictions, due to the fact that the three velocity components are predicted at the same time. From the observation of figure 16, which shows the spanwise fluctuation predictions, the behaviour of the three methods is similar to the one in the wall-normal components. Note, however, that, closer to the wall, the FCN-POD provides more accurate predictions for the spanwise fluctuation component than for the wall-normal component, as can be observed in figure 7.

Figure 15. Comparison of the wall-normal fluctuation fields at  $Re_{\tau } = 180$, scaled with the corresponding $v_{rms}$, from EPOD (a–d), FCN-POD (e–h), reference DNS (i–l) and FCN (m–p). Results at $y^+=15$ (a,e,i,m), $y^+=30$ (b,f ,j,n), $y^+=50$ (c,g,k,o) and $y^+=100$ (d,h,l,p).

Figure 16. Comparison of the spanwise fluctuation fields at  $Re_{\tau } = 180$, scaled with the corresponding $w_{rms}$, from EPOD (a–d), FCN-POD (e–h), reference DNS (i–l) and FCN (m–p). Results at $y^+=15$ (a,e,i,m), $y^+=30$ (b,f ,j,n), $y^+=50$ (c,g,k,o) and $y^+=100$ (d,h,l,p).

Figure 17. Comparison of the wall-normal fluctuation fields at  $Re_{\tau } = 550$, scaled with the corresponding $v_{rms}$, from EPOD (a–d), FCN-POD (e–h), reference DNS (i–l) and FCN (m–p). Results at $y^+=15$ (a,e,i,m), $y^+=30$ (b,f ,j,n), $y^+=50$ (c,g,k,o) and $y^+=100$ (d,h,l,p).

Figure 18. Comparison of the spanwise fluctuation fields at  $Re_{\tau } = 550$, scaled with the corresponding $w_{rms}$, from EPOD (a–d), FCN-POD (e–h), reference DNS (i–l) and FCN (m–p). Results at $y^+=15$ (a,e,i,m), $y^+=30$ (b,f ,j,n), $y^+=50$ (c,g,k,o) and $y^+=100$ (d,h,l,p).
When a higher Reynolds number is considered, the error trends of the neural-network-based models in figure 9 are comparable to the one observed at  $Re_{\tau }=180$, for the wall-normal and spanwise fluctuations. On the other hand, the EPOD predictions improve when moving from $y^+=15$ to $y^+=30$, before the performance starts degrading as we move farther from the wall. Additionally, figures 17 and 18 show that, close to the wall, the intensity of the fluctuations in the wall-normal and spanwise direction is significantly underestimated by the POD-based methods, when compared with FCN. As the wall-normal distance increases, the fluctuations range predicted by the FCN reduces as well and at $y^+=100$ the range is comparable for all three methods.


 Open access