


Dietary and lifestyle modifications have an important role in the prevention of many chronic diseases. Fruit and vegetables, rich in many nutrients and non-nutritive biologically active constituents, are generally considered an essential part of a healthy diet( 1 ). The 2015 Dietary Guidelines for Americans recommend a daily intake of fruit and vegetables of at least five servings (about 1050 g) per d( 1 ). Convincing evidence consistently supports that diets high in fruit and vegetables are associated with reduced risk of many chronic diseases such as CVD( Reference Oude Griep, Verschuren and Kromhout 2 , Reference Wang, Ouyang and Liu 3 ), type 2 diabetes( Reference Carter, Gray and Troughton 4 ) and some cancers( Reference Aune, Chan and Vieira 5 , Reference Lunet, Lacerda-Vieira and Barros 6 ). Furthermore, evidence supports that increased consumption of fruit and vegetables may reduce overweight or obesity( Reference Alinia, Hels and Tetens 7 ) and prolong life( Reference Wang, Ouyang and Liu 3 , Reference Bellavia, Larsson and Bottai 8 ).
The beneficial effects of fruit and vegetables on chronic diseases are thought to be through reducing oxidative stress and inflammation processes or diet-induced metabolic acidosis( Reference Byberg, Bellavia and Orsini 9 ), all of which influence bone health. Fruit and vegetables contain vitamins, minerals and other phytochemicals that are beneficial to bone( Reference Hamidi, Boucher and Cheung 10 ). Indeed, several cross-sectional and longitudinal studies demonstrate that elevated fruit and vegetable intake is associated with increased bone mass( Reference Chen, Ho and Woo 11 – Reference Movassagh, Kontulainen and Baxter-Jones 13 ) and lower risk of bone fracture( Reference Byberg, Bellavia and Orsini 9 , Reference Benetou, Orfanos and Feskanich 14 ). Contrary to the above findings, Feart et al.( Reference Feart, Lorrain and Ginder Coupez 15 ) found that adherence to a Mediterranean diet rich in fruit and vegetables was not associated with lower risk of fracture, and Hamidi et al.( Reference Hamidi, Boucher and Cheung 10 ) also found no clear benefits of fruit and vegetable intake on bone health for women aged 45 years or older.
Data from controlled intervention trials are lacking that support or refute observational evidence, suggesting a positive association between intake of fruit and vegetables and bone health. Moreover, there are scant clinical data providing insight into the mechanisms through which fruit and vegetables affect bone. Therefore, in the current study, we aimed to determine whether depletion and repletion intake of fruit and vegetables influence serum markers of bone turnover. We hypothesised that elevated fruit and vegetable intake improves serum markers of bone turnover. To test this hypothesis, we analysed bone biomarkers as secondary end points in serum samples collected from a 28-week single-arm experimental feeding intervention in which fruit and vegetable intake was increased for 8 weeks in a controlled feeding intervention.
Methods
Subjects and experimental design
The study used a 28-week single-arm, experimental feeding intervention design and was part of a larger trial designed to assess changes in skin carotenoid status and blood carotenoid concentrations during controlled dietary intake( Reference Jahns, Johnson and Mayne 16 ). This study was conducted according to the guidelines described in the Declaration of Helsinki, and all procedures involving human subjects and end point measurements were approved by the Institutional Review Board of the University of North Dakota. The parent study was powered solely to detect change in skin carotenoid status as measured by resonance Raman spectroscopy, and an n 26 was determined to provide 90 % power to detect a 20 % difference in skin carotenoid scores( Reference Jahns, Johnson and Mayne 16 ). The present research represents a secondary outcome of that study.
Subjects were recruited via flyers, newspaper advertisements and word of mouth from the area of Grand Forks, ND, USA. The protocol was explained verbally and in writing by the investigators, and written informed consent was obtained from each volunteer. Baseline characteristics such as age, height, weight, BMI, body composition and blood chemistry are shown in Table 1. Subjects were apparently healthy women and men. Inclusion criteria were as follows: age 18–65 years, a BMI (kg/m2) between 19 and 30, weight stability of ±2·7 kg within the past 2 months, willingness to refrain from smoking and the use of dietary supplements during the study period, willingness to maintain baseline weight and physical activity levels and willingness to complete study requirements, including consuming a provided diet. Subjects were excluded for gastrointestinal disorders, use of medications that could affect carotenoid metabolism, such as statins, current smoking, allergies or intolerances to foods used in the study or excessive alcohol use. Of the twenty-nine subjects who completed the study (Fig. 1), nine were male and twenty were female. Participants received a monetary stipend for completing the 28-week study.
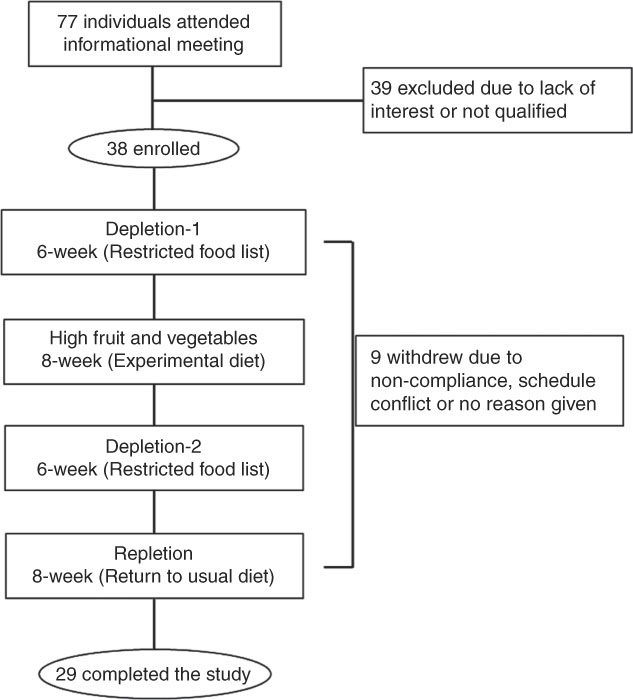
Fig. 1 Schematic of volunteer recruitment, experimental design and dietary treatments. In all, seventy-seven individuals attended information meeting and were screened for participation; twenty-nine completed the study.
Table 1 Characteristics and blood measurements of the study participants after an overnight fastFootnote * (Mean values with their standard errors; n 29 (nine male and twenty female))
a,b,c,d Mean values with unlike superscript letters were significantly different, P<0·05, among phases.
* Repeated-measures ANOVA where subject was a random effect was used to test for changes over phases of the study in blood parameters. Tukey contrasts were used for post hoc comparisons of means.
† To convert glucose in mg/dl to mmol/l, multiply by 0·0555; to convert cholesterol, HDL and LDL in mg/dl to mmol/l, multiply by 0·0259; to convert TAG in mg/dl to mmol/l, multiply by 0·0113.
Dietary treatments
The study consisted of four dietary treatment phases (Fig. 1). The first phase was a 6-week fruit and vegetable depletion phase (depletion-1) during which subjects were instructed to follow a low carotenoid diet (approximately 1 mg/d compared with the usual intake at the baseline, 12 mg/d). The second phase was an 8-week high-fruit and vegetable controlled intervention phase during which the subjects consumed a provided experimental diet with approximately 60 mg of total carotenoids per d from four to six cups of fruit and vegetables. Total carotenoids was defined as the sum of the six carotenoids (α-carotene, β-carotene, lycopene, β-cryptoxanthin, lutein/zeaxanthin), which are predominant in the US diet and in the bloodstream. The details of the experimental diet can be found in Table 1 of the publication by Jahns et al.( Reference Jahns, Johnson and Mayne 16 ). The third phase was the same as the first depletion phase (depletion-2) for 6 weeks. The fourth phase was an 8-week repletion phase (repletion) during which subjects were instructed to return to their usual diet as before entering the study.
Usual food intake was estimated from self-reported intakes by using the online version of the National Cancer Institute’s Diet History Questionnaire (DHQ II*Web)( 17 – 19 ), which was developed based on previously validated DHQ I( Reference Thompson, Subar and Brown 20 , Reference Subar, Thompson and Kipnis 21 ). The subjects were asked to report their usual food intake over the past month at the baseline and the end of depletion-1, depletion-2 and repletion phases. The subjects were also required to complete 3-d diet records after 1 week into depletion-1 and depletion-2, and during phase 4. The food records were then reviewed by a research dietitian and analysed with the US Department of Agriculture (USDA) National Nutrient Database for Standard Reference, release 23( 1 ), to ensure compliance with the dietary restrictions.
The experimental diet consisted of a 7-d rotating menu that was designed by registered dietitians and met the food-based recommendations of the Dietary Guidelines based on the example 2000-calorie food pattern menu ChooseMyPlate.gov( 22 ). The diet was designed to provide an average of six-cup equivalents of fruit and vegetables daily (fruit: 360–560 g; vegetables: 450–705 g). Fruit and vegetables were served cooked, raw and as 100 % juice. All foods were weighed to the nearest tenth of a gram. Some examples of provided foods high in carotenoids include baked sweet potato, winter squash soup, vegetable juice, red grapefruit, spinach salad, broccoli, cantaloupe, carrots and red bell pepper, apricots, pumpkin custard and fruit juice, although this is not an exhaustive list. During the high fruit and vegetable experiment diet phase, all food and beverages were provided. Compliance with the intervention was assessed by a brief compliance questionnaire administered each weekday morning. Compliance with the depletion phases was measured with 3-d diet records to ensure that participants were indeed following a low-carotenoid prescription and understood the instructions. The subjects consumed breakfast at the Grand Forks Human Nutrition Research Center during the week and the remaining foods elsewhere. Subjects took home coolers containing all foods for the weekend. The consumption of non-energetic beverages was not controlled. The subjects were allowed to consume up to one or two alcoholic drinks per d for women or men, respectively. To maintain body weights during the provided diet phases, body weights were obtained each weekday and energy intakes were adjusted if the mean of weekly weights changed by 2 %.
Energy and macronutrient intakes for each treatment phase were estimated based on 3-d diet records, except the high-fruit and vegetable experimental diet, which was derived from the USDA Nutrient Database for Standard Reference Release 23( 23 ). Dietary potential renal acid load (PRAL) was calculated based on the following formula developed by Remer et al.( Reference Remer, Dimitriou and Manz 24 ) as follows: PRAL (mEq/d)=(mg P/d×0·0366)+(g protein/d×0·4888)−(mg K/d×0·0205) − (mg Ca/d×0·0125)−(mg Mg/d×0·0263).
Blood chemistries, serum bone biomarkers and plasma carotenoid analyses
Blood samples were drawn after an overnight fast at the baseline and at the mid-point and end points of each treatment phase and stored at −80°C pending analysis.
Serum alanine aminotransferase, aspartate aminotransferase, glucose, high-sensitivity C-reactive protein and a lipid profile were measured with Cobas 400 plus, and insulin was measured with Cobas e 411 (Roche Diagnostic). Quality control was performed according to the manufacturer’s recommendation – that is with a kit provided by the manufacturer each time before the assay and whenever a new cassette of reagent was put in use or a calibration was performed.
Serum samples at the end of each phase were analysed for bone formation and resorption biomarkers with commercial ELISA kits from Immunodiagnostic Systems: osteocalcin (kit no. AC-11F1), bone-specific alkaline phosphatase (BAP, kit no. AC-20), carboxyterminal cross-linking telopeptide (CTX, kit no. AC-02F1) and tartrate-resistant acid phosphatase (TRAP, kit no. SBTR201R), according to the manufacturers’ instructions. Serum insulin-like growth factor 1 (IGF-1) was measured by using an ELISA kit (no. DG100) from R&D Systems. The selection of these bone biomarkers was based on a few feeding trials with intake of fruit and vegetables( Reference Gunn, Weber and McGill 25 – Reference Lin, Ginty and Appel 27 ) and the consideration of limited available serum. Quality control of each bone biomarker was performed using two control samples in duplicate for each plate. The control samples with known concentrations (low value and high value) were supplied by respective kit manufacturers. The concentrations of the low- and high-value control samples must fall within the manufacturer’s recommended range for the assay to be valid. The reference ranges for adults (male and female) are as follows: CTX, 25–1008 pg/ml; TRAP, 3·24±0·79–4·36±0·95; BAP, 4·7–29·3 µg/l; IGF-1, 53–640 ng/ml; osteocalcin, 9–42 ng/ml.
Plasma carotenoids (α-carotene, β-carotene, β-cryptoxanthin, lycopene, lutein/zeaxanthin) were measured using HPLC with fluorescence detection based on the method with intra- and inter-day precision (between 0·95 and 5·31 % and about 10 %, respectively) for all analytes conformed to Thurnham et al. ( Reference Thurnham, Smith and Flora 28 ), as previously described( Reference Jahns, Johnson and Mayne 16 ).
Statistical analysis
Data are reported as means with their standard errors. Effects of dietary treatment phases on blood variables were analysed by using repeated-measures ANOVA (JMP, version 9.0.0; SAS Institute, Inc.), where subject was a random effect. Normality was tested using Shapiro–Wilks test in JMP. Tukey contrasts were used for post hoc comparisons of the means. Pearson’s correlation coefficients were calculated between plasma total and individual carotenoid and bone markers at baseline and the end of each dietary treatment. The method used( Reference Hamlett, Ryan and Serrano-Trespalacios 29 ) provides estimates of both the within-individual correlation and the between-individual correlation across the course of the study, and correctly accounts for the multiple measurements on each subject.
Results
Of the thirty-eight individuals enrolled, twenty-nine completed the study and were included in data analysis (Fig. 1). The participants were general healthy, per experimental design, with a mean age of 32·1 (sem 2·5) years and normal BMI (23·6 (sem 0·6) kg/m2, and had a normal range of blood biochemistry profile when enrolled in the study (Table 1).
Compared with the baseline, decrements in fruit and vegetable intake (depletion-1) resulted in an increase in concentrations of serum total cholesterol and LDL-cholesterol (Table 1, P<0·05). High-fruit and vegetable diet decreased blood total cholesterol and HDL concentrations relative to the depletion-1 (P<0·05). Overall, dietary treatments had no effect on serum concentrations of alanine aminotransferase, aspartate aminotransferase, insulin, high-sensitivity C-reactive protein or TAG (P>0·05).
Consistent with the study design, plasma carotenoid levels, a commonly used biomarker of fruit and vegetable intake, decreased as a result of the depletion phase and increased with the high-fruit and vegetable diet (Table 1).
Intake of nutrients of study participants was calculated on the basis of 3-d diet records based on the USDA National Nutrient Database for Standard Reference, release 23( 23 ). As expected, the participants in the high fruit and vegetable phase had the lowest calculated PRAL and relatively higher intakes of B vitamins than in depletion-1 and depletions-2 (Table 2).
Table 2 Nutrient intakes of the study participantsFootnote * (Mean values with their standard errors)
* Estimated based on the US Department of Agriculture National Nutrient Database for Standard Reference, release 23( 23 ).
† On the basis of a 3-d diet record; n 29 (nine male and twenty female).
‡ Experimental diet; n 7 (calculated from 7-d rotating menu based on the US Department of Agriculture National Nutrient Database for Standard Reference, release 23( 23 )).
§ Calculated and reported( Reference Jahns, Johnson and Mayne 16 ).
|| Calculated based on the formula developed by Remer et al.( Reference Remer, Dimitriou and Manz 24 ) as PRAL (mEq/d)=(mg P/d×0·0366)+(g protein/d×0·4888)−(mg K/d×0·0205)−(mg Ca/d×0·0125)−(mg Mg/d×0·0263).
The participants had lower concentrations of BAP (Fig. 2(A)), a bone formation marker, at the end of depletion-1 than at the baseline (10·7 (sem 0·7) v. 9·5 (sem 0·8) µg/l for baseline and depletion-1, respectively, P<0·05). Compared with the depletion-1 phase, elevated intake of fruit and vegetables increased serum BAP from 9·5 (sem 0·8) to 11·3 (sem 0·7) µg/l (P<0·05). Lower serum BAP concentrations were observed after the depletion-2 and repletion phases, compared with the high-fruit and vegetable intake phase. There were no differences in other bone-formation-related markers, serum IGF-1 (Fig. 2(B)) and osteocalcin (Fig. 2(C)), among treatment phases (P>0·05).
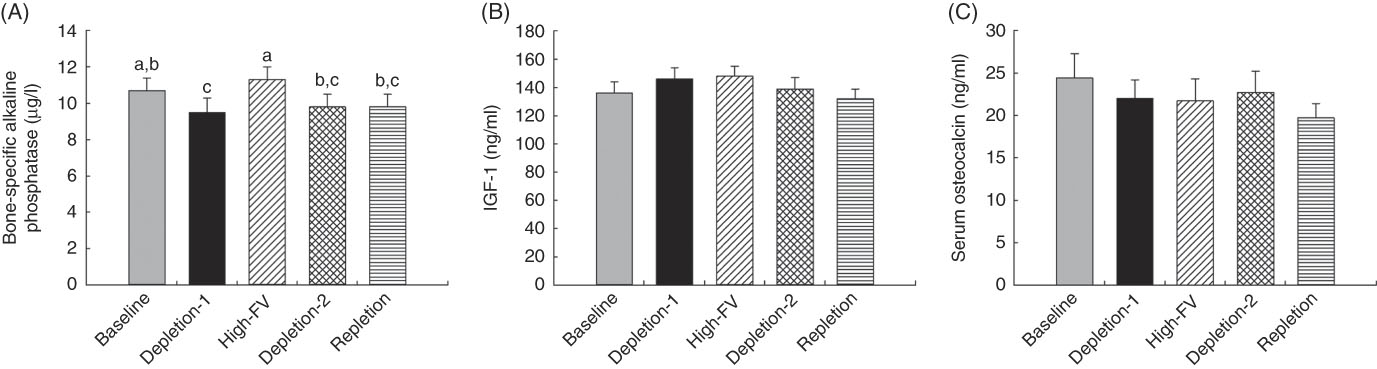
Fig. 2 Changes in serum bone formation markers in response to depletion and repletion of fruit and vegetables (FV). (a) Bone-specific alkaline phosphatase, (b) insulin-like growth factor 1 (IGF-1) and (c) osteocalcin. Values are means with their standard errors represented by vertical bars. Effects of dietary treatments on blood variables were analysed by using repeated-measures ANOVA (JMP, version 9.0.0; SAS Institute, Inc.), where subject was a random effect. Tukey contrasts were used for post hoc comparisons of means. a,b,c Mean values with unlike superscript letters were significantly different (P<0·05).
Compared with the baseline, concentrations of serum CTX (Fig. 3(A)), a bone resorption marker, were higher for the participants at the end of depletion-1 (0·68 (sem 0·05) v. 0·97 (sem 0·08) ng/ml for baseline and depletion-1, respectively, P<0·05). High intake of fruit and vegetables decreased serum CTX to 0·60 (sem 0·04) ng/ml, compared with the depletion-1 (P<0·05). Serum CTX concentrations were lower in repletion than depletion-1 (P<0·05) and tended to be lower than depletion-2 (P=0·051). Serum concentrations of TRAP were not affected by dietary treatment phases (Fig. 3(B), P>0·05).
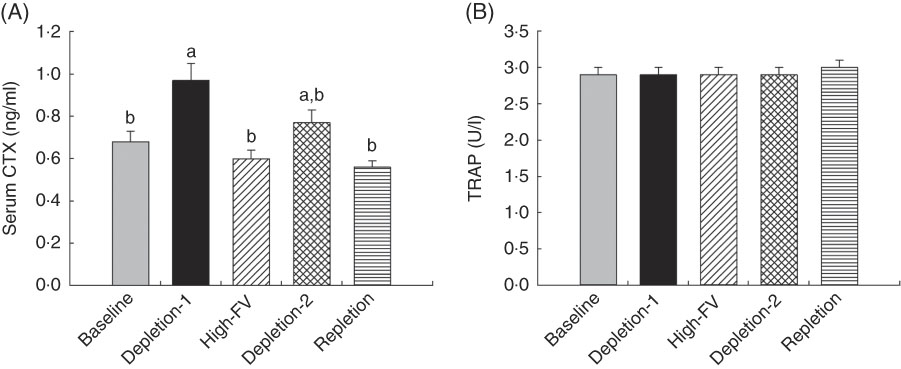
Fig. 3 Changes in serum bone resorption markers in response to depletion and repletion of fruit and vegetables. (a) Carboxyterminal cross-linking telopeptide (CTX), (b) tartrate-resistant acid phosphatase (TRAP). Values are means with their standard errors represented by vertical bars. Effects of dietary treatments on blood variables were analysed by using repeated-measures ANOVA (JMP, version 9.0.0; SAS Institute, Inc.), where subject was a random effect. Tukey contrasts were used for post hoc comparisons of means. a,b Mean values with unlike superscript letters were significantly different (P<0·05).
Serum CTX concentrations were inversely correlated with blood lycopene (r −0·39, P < 0·05) and BAP concentrations were positively correlated with blood lycopene and β-cryptoxanthin (r 0·43 and 0·48, P < 0·05, respectively) within subjects. In addition, serum concentrations of BAP tended to positively correlate with blood total carotenoids and α-carotene (r 0·37 and 0·34, P=0·06 and 0·08, respectively).
Discussion
In this secondary outcome analysis of a 28-week single-arm intervention feeding trial, we showed that concentration of serum CTX, a bone resorption marker, was increased while serum BAP, a bone formation marker, was decreased when the subjects were instructed to follow a prescribed diet low in carotenoids for 6 weeks. The concentration of CTX was decreased, whereas BAP was increased, when the subjects switched to a provided experimental diet high in fruit and vegetables (slightly above dietary guideline recommendations) for 8 weeks. Our data demonstrated that low intake of fruit and vegetables increases, whereas high intake decreases, bone turnover markers. To our knowledge, this is the first controlled intervention study to investigate depletion and repletion of fruit and vegetables on bone markers in healthy subjects. These findings strongly support that intake of fruit and vegetable at or above the amounts (five servings per d) recommended by the 2015 Dietary Guidelines for Americans by the USDA Food Patterns( 1 ) is beneficial to bone health.
With obesity growing in prevalence and an increased focus on diet modification to maintain healthy body weight and reduce obesity-related chronic disease, the influence of a high intake of fruit and vegetables on chronic diseases has attracted tremendous attention. High intake of fruit and vegetables as a component of a healthy diet pattern reduces obesity( Reference Alinia, Hels and Tetens 7 ) and is the only dietary characteristic being consistently recognised to be beneficial in almost every health outcome( 1 ). It is worth noting that in this study, relative to the baseline, depletion of fruit and vegetable intake (depletion-1) increased serum total cholesterol and LDL-cholesterol, whereas high intake lowered serum total cholesterol compared with the depletion-1 (Table 1); these findings are consistent with the well-established cardiovascular protective effect of fruit and vegetables( Reference Boeing, Bechthold and Bub 30 ).
Available data from observational and prospective cohort studies support the beneficial effects of high fruit and vegetable intake on bone health. Greater intake of fruit and vegetables is positively associated with increased bone mineral density( Reference Chen, Ho and Woo 11 , Reference Prynne, Mishra and O’Connell 12 , Reference Liu, Leung and Wong 31 , Reference Tucker, Hannan and Kiel 32 ), decreased bone loss( Reference Karamati, Yousefian-Sanni and Shariati-Bafghi 33 ) and reduced bone turnover( Reference Gunn, Weber and McGill 25 , Reference Macdonald, Black and Aucott 34 ). Furthermore, high fruit and vegetable intake is inversely associated with the risk of bone fracture( Reference Benetou, Orfanos and Feskanich 14 , Reference Gunn, Weber and McGill 25 , Reference Dai, Wang and Ang 35 ), and Byberg et al. found that there was a dose–response inverse association between the intake of up to 5 servings/d of fruit and vegetables and hip fracture( Reference Byberg, Bellavia and Orsini 9 ). However, the lack of impact of increased fruit and vegetable consumption on bone turnover or bone mineral density has also been reported( Reference Macdonald, Black and Aucott 34 , Reference McTiernan, Wactawski-Wende and Wu 36 , Reference Nowson, Patchett and Wattanapenpaiboon 37 ). Data from controlled interventional studies regarding bone biomarkers in response to increased consumption of fruit and vegetables are lacking, and the findings from the few feeding trials are inconsistent( Reference Neville, Young and Gilchrist 26 , Reference Lin, Ginty and Appel 27 ).
The fact that high intake of fruit and vegetables decreased serum CTX concentrations, whereas increased BAP concentrations, indicates reduced bone resorption and increased bone formation. These findings support results from the few uncontrolled intervention studies, which also showed a significant beneficial effect of increased consumption of fruit and vegetables on bone markers( Reference Gunn, Weber and McGill 25 , Reference Lin, Ginty and Appel 27 ). The Dietary Approaches to Stop Hypertension intervention study found that high fruit and vegetable consumption over a 30-d period significantly decreased serum CTX by 16–18 % compared with a typical Western control diet in subjects aged 23–76 years, similar to the age group in our study (aged 19–59 years)( Reference Lin, Ginty and Appel 27 ). Similar findings from a double cross-over study reported( Reference Buclin, Cosma and Appenzeller 38 ) that a diet low in fruit and vegetables resulted in a 19 % increase in CTX, although the study focused mainly on the acid content of the diet. Similarly, a 12-week intervention study by Gunn et al.( Reference Gunn, Weber and McGill 25 ) reported that consuming nine servings of specific fruit and vegetables decreased serum CTX in postmenopausal women with osteopenia.
Our findings appear to be different with results from a 2-year intervention study in women aged 55–65 years that showed no significant effect of an additional 300 g of fruit and vegetables per d on bone turnover markers or bone mineral density( Reference Macdonald, Black and Aucott 34 ). However, in this study, the intake of fruit and vegetables was prescribed but not controlled, and the intake and compliance relied on a 3-d dietary checklist at each 3-month visit. A 16-week controlled intervention study by Neville et al.( Reference Neville, Young and Gilchrist 26 ) reported that increased fruit and vegetable consumption did not affect serum CTX or osteocalcin, a bone formation marker. This study, however, was conducted with subjects aged 65–85 years who habitually consumed less than or equal to two servings of fruit and vegetables daily, and self-select their fruit and vegetables during the intervention phase. In contrast, the subjects in our study were 19–59 years of age with normal intake fruit and vegetables before they entered the study and given a provided diet. Compared with subjects with a normal dietary pattern who have been prescribed to consume less fruit and vegetables, it is possible that subjects who habitually consumed less fruit and vegetables would have a different physiological status and may respond differently to the same diet; for instance, carotenoid levels may be lower in those who are not vitamin A replete. In addition, older subjects might be less responsive to the similar dietary treatment than those younger subjects in our study.
Data regarding the effect of fruit and vegetables on bone formation markers are scarce and inconsistent. Changes of bone resorption markers have been the primary focus in many studies, as increased bone resorption relative to bone formation is the primary factor responsible for all forms of acquired osteoporosis( Reference Teitelbaum 39 ). Increased serum BAP indicating increased bone formation, with intake of fruit and vegetables found in this study, has not been reported previously. In supporting our findings and consistent with the acid–base concept of fruit and vegetables, Ceglia et al. found that attenuating dietary acid load with the alkaline salt, potassium bicarbonate, increased serum IGF-1 levels( Reference Ceglia, Harris and Abrams 40 ), although no differences in serum IGF-1 levels among treatment phases have been detected in our study. However, Gunn et al. reported that increased intake of selected vegetables thought to be rich in phytochemicals that have bone resorption-inhibiting properties (such as citrus, cabbage and other cruciferous) decreased serum bone formation marker, procollagen type I N propeptide( Reference Gunn, Weber and McGill 25 ), whereas Neville et al. reported that increased fruit and vegetable consumption had no effect on osteocalcin, also a bone formation marker.
The beneficial effects of fruit and vegetables on bone may be multifaceted, and several mechanisms have been suggested. A primary theory is the acid–base hypothesis in which an acidic environment would increase urinary Ca excretion and lead to bone resorption and bone loss( Reference Tucker, Hannan and Kiel 32 , Reference New 41 , Reference Bushinsky 42 ). Dietary acid load affecting Ca retention and bone health has been repeatedly demonstrated( Reference Tucker, Hannan and Kiel 32 , Reference Buclin, Cosma and Appenzeller 38 ). In support of this hypothesis, several studies directly show that supplementing the base-forming mineral, potassium bicarbonate, decreased urinary Ca excretion and promoted Ca absorption( Reference Ceglia, Harris and Abrams 40 , Reference Sebastian, Harris and Ottaway 43 – Reference Dawson-Hughes, Harris and Palermo 45 ). PRAL, a measure of the acid–base load of foods, can be used to estimate renal net acid excretion( Reference Remer, Dimitriou and Manz 24 ). A lower PRAL indicates a higher content of fruit and vegetables that are rich in alkaline-forming components such as K, Ca and Mg. As expected, in this study, the provided diet high in fruit and vegetables had the lowest PRAL compared with diets in other experimental phases. Whether dietary acid load per se plays a primary role in the beneficial effects of high fruit and vegetable intake on bone has been disputed( Reference Fenton, Lyon and Eliasziw 46 , Reference Hanley and Whiting 47 ), and the degree that the acid load of a diet affects Ca excretion and bone health has not been fully established. We previously showed that a diet high in acid load increases fractional dietary Ca absorption, which could partially compensate for increased urinary Ca excretion( Reference Cao, Johnson and Hunt 48 ).
Alternatively, nutrients that are abundant in fruit and vegetables, such as magnesium, potassium, α-tocopherol, vitamin K and vitamin C, might independently affect bone metabolism in addition to the acid-load properties( Reference Byberg, Bellavia and Orsini 9 , Reference Chen, Ho and Woo 11 ). Kang et al.( Reference Kang, Kim and Bae 49 ) reported that energetic intake, protein, carbohydrate, Ca, P, Zn and total food intake were negatively correlated with urinary deoxypyridinoline, a bone resorption marker.
Last, fruit and vegetables contain phytochemicals with antioxidant properties such as flavonoids and carotenoids. It is well known that oxidative stress is detrimental( Reference Lean, Jagger and Kirstein 50 ) and antioxidants are beneficial to bone( Reference Cao and Picklo 51 ). Indeed, in this study we found that serum bone resorption marker, CTX, was inversely correlated with blood lycopene within subjects, whereas the bone formation marker BAP was positively correlated with blood lycopene and β-cryptoxanthin. These data suggest, therefore, that fruit and vegetables may affect bone indirectly via lower oxidative stress and inflammation by down-regulating osteoclastogenesis. The extent to which these potential mechanisms or others are acting with respect to fruit and vegetable intake needs further research.
This study has several strengths. First, the compliance with the intervention was ensured by provision of the entire diet, completion of 3-d diet records after 1 week into each phase, use of a compliance questionnaire at each visit during the provided diet phase and exclusion of three non-compliant subjects from the study. Compliance was confirmed by the changes in blood and skin carotenoids, a characteristic of intake of fruit and vegetables, with each treatment phase( Reference Jahns, Johnson and Mayne 16 ). Second, a unique feature of this study was that the same subjects were prescribed a low intake of fruit and vegetables and then switched to a provided diet high in fruit and vegetables, thus maximising the possibility of detecting an effect of increased consumption of fruit and vegetables. Third, the intake of six servings of fruit and vegetables in the provided diet phase was designed to be practical and consistent with the recommendation by the 2015 Dietary Guidelines for Americans( 1 ).
However, this study does possess limitations. Bone biomarker measurements were secondary end points, and the study was not specifically designed and powered for these end points. This may explain why we failed to observe changes in other bone markers in response to the intake of fruit and vegetables or detect significant differences in CTX (P=0·051) between depletion-2 phase and high intake of fruit and vegetables phase or between repletion and depletion-2 phases. Changes in bone mineral density, an indicator positively correlated to fracture risk, in addition to bone markers would be useful, but a long-term study would be needed to detect such changes. As expected, we did not detect any changes in bone mineral density (data not shown) during the study given the short duration of each phase from 6 to 8 weeks. Other limitations were that adjustments for possible confounders, such as intake of Ca, vitamin D, gender, ethnicity or other lifestyle factors, were not made because our study was not powered to examine these outcomes.
In conclusion, data from this controlled depletion and repletion intervention study demonstrated positive effects of increasing consumption of fruit and vegetables on bone marker status in healthy adults. Although we cannot pinpoint specific contributions of particular fruit and vegetable components, these findings lend support to a whole-diet approach of increasing fruit and vegetable consumption to improve bone health.
Acknowledgements
The authors thank Clint Hall, Becky Stadstad, Craig Lacher and Brian Gregoire for their contributions to the study coordination and data collection. The authors thank Matthew Picklo for his critical review and suggestions to the manuscript.
Supported by the USDA Agricultural Research Service Current Research Information System nos 3062-51000-053-00D and 3062-51000-051-00D, as part of the authors’ official duties.
The authors’ responsibilities were as follows: J. J. C. contributed to the study design and implementation regarding bone-related end points, data analysis and interpretation and manuscript preparation; L. D. W. and L. J. contributed to the overall human clinic trial design and implementation, data interpretation and manuscript preparation or critical review of the manuscript.
The authors declare that there are no conflicts of interest.


