


Bias in emotional processing has been implicated in the maintenance of depression; Reference Bourke, Douglas and Porter1 people who are depressed are more sensitive to negative affect and show a negativity bias when interpreting ambiguous stimuli. Reference Watters and Williams2 A bias towards perceiving ambiguous emotions as sad may change behaviour, which may in turn elicit negative reactions from others and thus sustain these biases in people with depression. However, there is little direct evidence of a causal relationship between biases in emotional expression processing and the maintenance of depressed mood. Reference Roiser, Elliott and Sahakian3 We investigated this by carrying out training designed to modify emotional expression processing in young adults reporting high levels of depressive symptoms. Although there is a growing literature on cognitive bias modification in depression and other psychopathologies, Reference Hakamata, Lissek, Bar-Haim, Britton, Fox and Leibenluft4 we are not aware of a study that has directly modified the perception of ambiguous emotional expressions in order to improve depressed mood.
Method
Participants were randomised to intervention or control procedures, repeated four times over consecutive days. The intervention procedure used feedback designed to increase the perception of happiness over sadness in ambiguous facial expressions, whereas the control procedure was identical but used feedback designed not to modify this perception. Participants completed self-report measures of depressive symptoms and mood before and after the training procedure, and 2 weeks after the end of the intervention. The study was approved by the University of Bristol Faculty of Science Research Ethics Committee (trial registration: ISRCTN02532638).
Young adults (n = 193) aged between 18 and 40 years (primarily undergraduates) recruited from the general population by advertisement completed the Beck Depression Inventory II (BDI-II). Reference Beck, Steer and Brown5 Of these, 80 (70% female) scored 14 or more (reflecting mood disturbance) and agreed to take part in the study. All provided informed consent. Testing took place in the School of Experimental Psychology at the University of Bristol.
A computer-generated randomisation sequence was minimised by BDI-II score (<20 or ⩾20) to balance participants with mild (14–19) and moderate to severe (20+) scores in each group, and concealed by requiring the researcher to complete a web form. This generated a number that the researcher entered into the computer delivering the intervention, which in turn assigned the participant to either the intervention or control condition. Participants and the researcher were masked to treatment allocation.
Prototypical ‘happy’ and ‘sad’ composite images were generated from 20 individual male faces showing a happy facial expression, and the same individuals showing a sad expression from the Karolinska Directed Emotional Faces, Reference Lundqvist, Flykt and OUhman6 using established techniques. Reference Tiddeman, Burt and Perrett7 These were used as end-points of a linear morph sequence, that changed in displayed emotion incrementally from unambiguously ‘happy’, through ambiguity, to unambiguously ‘sad’.
The BDI-II is a 21-item mood scale designed to measure depressive symptoms, with each item scored on a four-point scale. Reference Beck, Steer and Brown5 The Positive and Negative Affect Schedule (PANAS) comprises two ten-item mood scales designed to measure positive and negative affect, with each item scored on a five-point scale. Reference Watson, Clark and Tellegen8
The intervention and control conditions consisted of three phases: baseline, training and test. This procedure was identical on all 4 days over which the training was delivered. In the baseline phase, participants were required to judge faces from a morphed sequence as either sad or happy (i.e. two-alternative forced choice). These data allowed us to calculate the balance point at which participants shifted from perceiving happiness to perceiving sadness in the presented face. This was then followed by the training phase that differed only in that feedback (i.e. ‘correct’, ‘incorrect’) was provided. In the intervention condition, feedback was provided based on a shifted balance point, so that participants were trained to judge expressions near the balance point that were previously judged as sad, as happy (online Fig. DS1). In the control condition, feedback was based on the same balance point calculated in the first phase, so that the judgement of ambiguous expressions would not change. In the test phase, the balance point was again calculated, using the same methods as in the baseline phase, to establish the success of the procedure in modifying the perception of ambiguous emotional expressions. Full technical details of the intervention (e.g. presentation times, experimental procedure) are provided in the online supplement.
Our primary outcome measure was BDI-II score at 2-week follow-up after completion of training. Secondary outcome measures were PANAS subscale scores Reference Watson, Clark and Tellegen8 at 2-week follow-up and balance point after completion of treatment.
Linear regression was used to compare the intervention and control groups on primary (BDI-II) and secondary (PANAS, balance point) outcomes. Analyses were adjusted for baseline BDI-II score (i.e. the minimisation variable), and baseline score on the outcome measure for secondary outcomes. Analyses were conducted using PASW Statistics 18 on Windows. Our sample size provided 80% power, at an alpha level of 0.05, to detect a difference of six points on the BDI-II (assuming s.d. = 10) and five points on the PANAS (s.d. = 7).
Results
Two participants discontinued the intervention and one was lost to follow-up, leaving a sample of n = 77 for analysis. Participant characteristics are summarised in Table 1. Those in the intervention condition had lower BDI-II scores compared with those in the control condition, but there was no statistical evidence for a difference (adjusted mean difference –1.50, 95% CI –5.97 to 3.03, P = 0.5). They also showed slightly reduced negative affect (adjusted mean difference –1.67, 95% CI –4.84 to 1.51, P = 0.3), again with no statistical evidence for a difference. There was some statistical evidence for increased positive affect (adjusted mean difference 3.29, 95% CI 0.29 to 6.29, P = 0.032). Participants in the intervention condition showed a shift in balance point (number of continuum frames) compared with those in the control condition (adjusted mean difference –2.72, 95% CI –3.45 to –1.99, P<0.001).
Discussion
Our results provide preliminary evidence that modification of emotional perception may lead to some increase in positive affect. This provides some support for the hypothesis that biases in the perception of emotional facial expressions play a causal role in the maintenance of low mood. One interpretation of these results is that this modification establishes a virtuous cycle, whereby the alteration in perception of emotional expression in others may lead to changes in behaviour that are then reciprocated and reinforced. Biases in emotion recognition alter with changes in mood, Reference Anderson, Shippen, Juhasz, Chase, Thomas and Downey9 and antidepressant pharmacotherapy may act therapeutically via the modification of these biases, again establishing a virtuous cycle. Reference Harmer, Goodwin and Cowen10
TABLE 1 Characteristics of participantsFootnote a
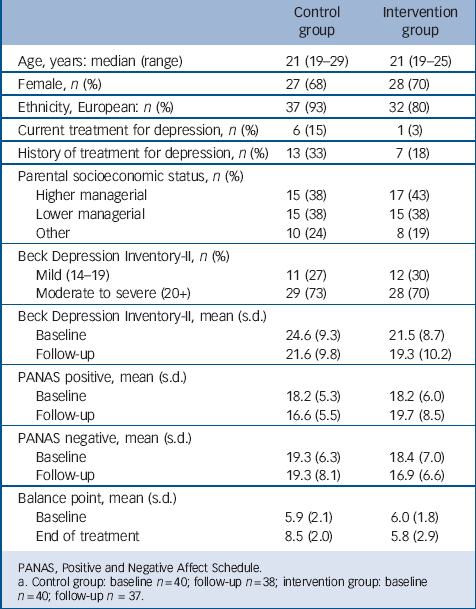
| Control group |
Intervention group |
|
|---|---|---|
| Age, years: median (range) | 21 (19–29) | 21 (19–25) |
| Female, n (%) | 27 (68) | 28 (70) |
| Ethnicity, European: n (%) | 37 (93) | 32 (80) |
| Current treatment for depression, n (%) | 6 (15) | 1 (3) |
| History of treatment for depression, n (%) | 13 (33) | 7 (18) |
| Parental socioeconomic status, n (%) | ||
| Higher managerial | 15 (38) | 17 (43) |
| Lower managerial | 15 (38) | 15 (38) |
| Other | 10 (24) | 8 (19) |
| Beck Depression Inventory-II, n (%) | ||
| Mild (14–19) | 11 (27) | 12 (30) |
| Moderate to severe (20+) | 29 (73) | 28 (70) |
| Beck Depression Inventory-II, mean (s.d.) | ||
| Baseline | 24.6 (9.3) | 21.5 (8.7) |
| Follow-up | 21.6 (9.8) | 19.3 (10.2) |
| PANAS positive, mean (s.d.) | ||
| Baseline | 18.2 (5.3) | 18.2 (6.0) |
| Follow-up | 16.6 (5.5) | 19.7 (8.5) |
| PANAS negative, mean (s.d.) | ||
| Baseline | 19.3 (6.3) | 18.4 (7.0) |
| Follow-up | 19.3 (8.1) | 16.9 (6.6) |
| Balance point, mean (s.d.) | ||
| Baseline | 5.9 (2.1) | 6.0 (1.8) |
| End of treatment | 8.5 (2.0) | 5.8 (2.9) |
PANAS, Positive and Negative Affect Schedule.
a. Control group: baseline n = 40; follow-up n = 38; intervention group: baseline n = 40; follow-up n = 37.
There are some limitations to our study. First, our participants did not have a formal diagnosis of depression. Since severity and chronicity of depression may influence response to an intervention of this kind, it will be necessary to test this method further on a clinically diagnosed population. Second, our results only achieved nominal statistical significance for one of our secondary outcomes. This suggests that our study lacked statistical power to detect more modest (but clinically valuable) improvements in mood. Third, our follow-up assessment was only 2 weeks later – it would be valuable to assess mood change over a longer period.
This technique could easily be used in conjunction with other psychological or pharmacological treatments. It is inexpensive, can be applied remotely, and does not require either high levels of motivation or the need for ‘homework’ tasks between sessions, as often demanded by cognitive–behavioural therapy. As a simple and acceptable procedure, emotional perception training may have a more general application to modifying behaviour in other psychiatric and behavioural problems and deserves to be further investigated in clinical populations.


eLetters
No eLetters have been published for this article.